
What is a LinkedIn Ads report template?
A LinkedIn Ads report template is a pre-built layout that pulls your campaign data into one clean, shareable format - so you can track performance, spot what's working, and show results without rebuilding the same report from scratch every week.
Instead of manually pulling data from LinkedIn Campaign Manager into a Looker Studio dashboard or Google Sheets, a LinkedIn Ads reporting template brings key metrics into one clean, shareable view.
The stakes are high. According to Dreamdata’s 2026 report, LinkedIn Ads delivers a 121% ROAS for B2B marketers, outperforming Google Search at 67% and Meta at 51%. And LinkedIn is the channel where B2B decisions get made: in a 2025 global survey by Statista, 53% of B2B professionals ranked it the most important social media platform for reaching their audience.
Campaigns at this scale need a reporting system that keeps up. And a strong LinkedIn Ads report template gives you exactly that. It helps you:
✅ Track the KPIs that predict pipeline: audience penetration, frequency, qualified leads, and cost per 1,000 member accounts reached - all in one view
✅ Break down performance by individual campaigns and ad creatives - so you can see exactly which campaigns and sponsored content are driving results
✅ Visualize LinkedIn Ads data with charts, goal widgets, and trend graphs - not just raw numbers
✅ Modify the layout to each client's goals and brand, without rebuilding anything manually
✅ Share updates through live links, scheduled PDFs, or automated email delivery
All of that is possible with Whatagraph IQ, and much more. It cuts the whole LinkedIn analytics reporting process from hours to minutes.
Here's the full workflow:
Step 1: Connect your LinkedIn Ads account - Whatagraph connects directly to your LinkedIn Ads account with a stable, no-code connector.
Step 2: Build or customize your template - Start from a pre-built LinkedIn Ads report template or use Whatagraph IQ to generate one from a single prompt.
Step 3: Add AI-powered insights - Whatagraph IQ Summary reads your actual report data and writes performance summaries automatically - in 18 languages.
Step 4: Automate delivery - Set up scheduled email reports, live links, or white-labeled PDF exports. Your client gets a fresh LinkedIn Ads report without you touching it.
Step 5: Query your data with Whatagraph MCP - Once your LinkedIn Ads data is connected, you can go further.
Whatagraph's MCP lets you connect your Whatagraph account directly to Claude or ChatGPT. You can ask plain-language questions about your LinkedIn Ads campaigns, such as:
- "Which campaigns are overspending this month?"
- “Show me lead generation performance compared to last quarter."
You get instant answers, without opening a single dashboard. No coding, no exports. Just your governed data, queryable in seconds.
What should be included in a LinkedIn Ads reporting template?
A solid LinkedIn Ads reporting template doesn't just display numbers. It tells a clear performance story: where your budget went, what it produced, and what to do next.
This template was co-created with Patrick Cumming, the founder of Ad Juice, a LinkedIn Ads specialist who has refined his reporting approach across dozens of B2B campaigns. Here's what to include:
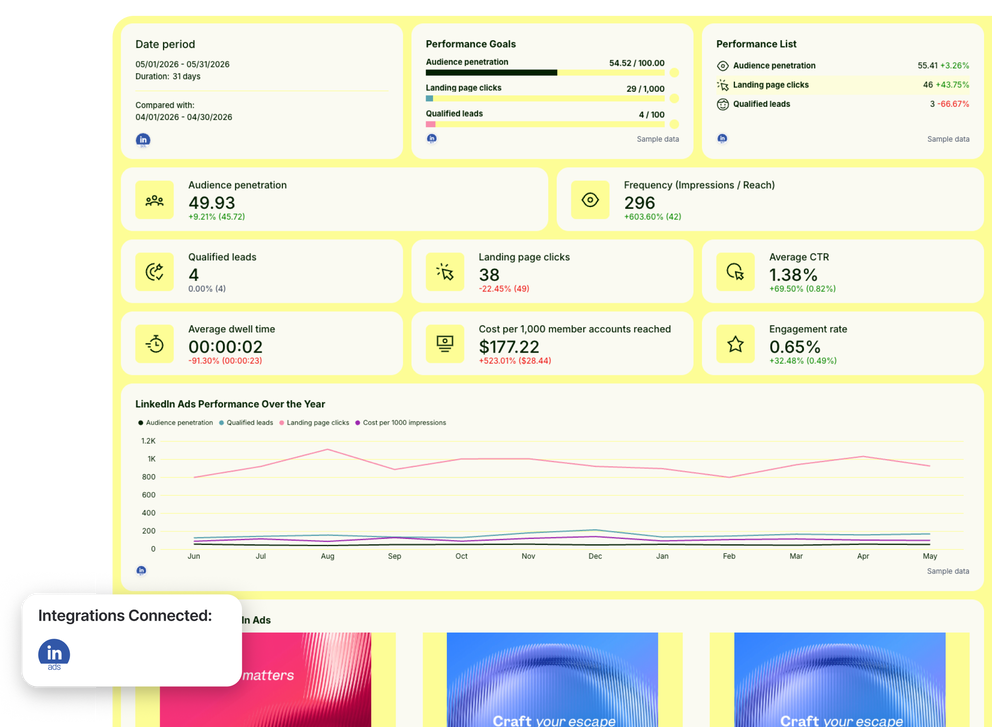
1. Performance goals and KPI summary
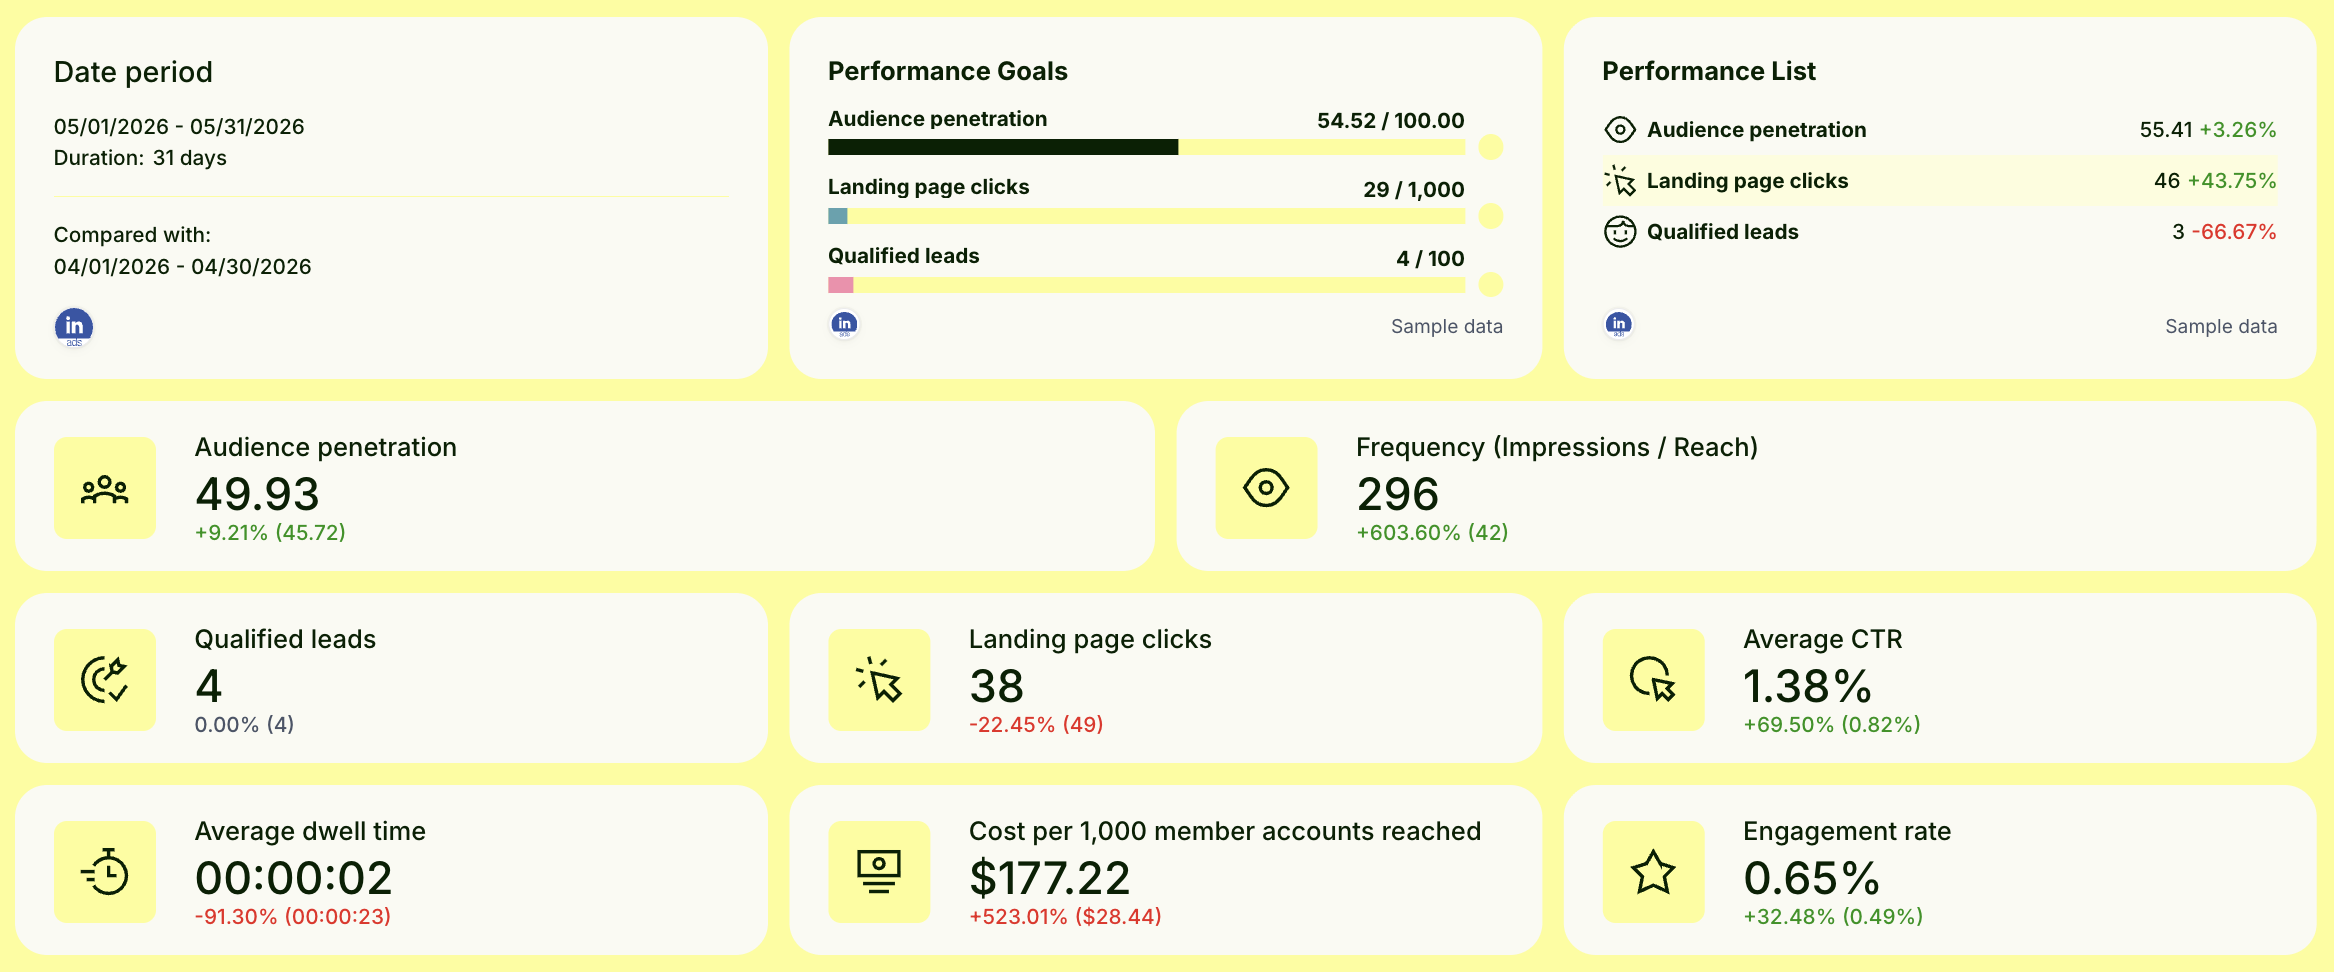
Start with goals alongside actuals - not buried in a table halfway down, but front and center.
Patrick recommends anchoring the top of every LinkedIn Ads report to a goal-pacing widget, so anyone reading it can see within seconds whether you're on track for the quarter. He says:
The main graph I use is goal-pacing. It tracks where we're at for our KPI on each metric vs where we should be over time. That way I can tell if we're on track or off-track to hit our KPI goal for the quarter.
Include:
- A goal widget tracking progress toward agreed KPIs: audience penetration, landing page clicks, and qualified leads
- A performance list showing period-over-period percentage changes per metric
- KPI scorecard widgets: audience penetration, frequency, qualified leads, landing page clicks, average CTR, average dwell time, cost per 1,000 member accounts reached, and engagement rate
- A yearly line chart plotting audience penetration, qualified leads, landing page clicks, and CPM together - useful for spotting seasonality and budget impact
The trend line in particular helps you explain performance shifts in context, rather than presenting a single month's numbers in isolation.
2. Top performing ads
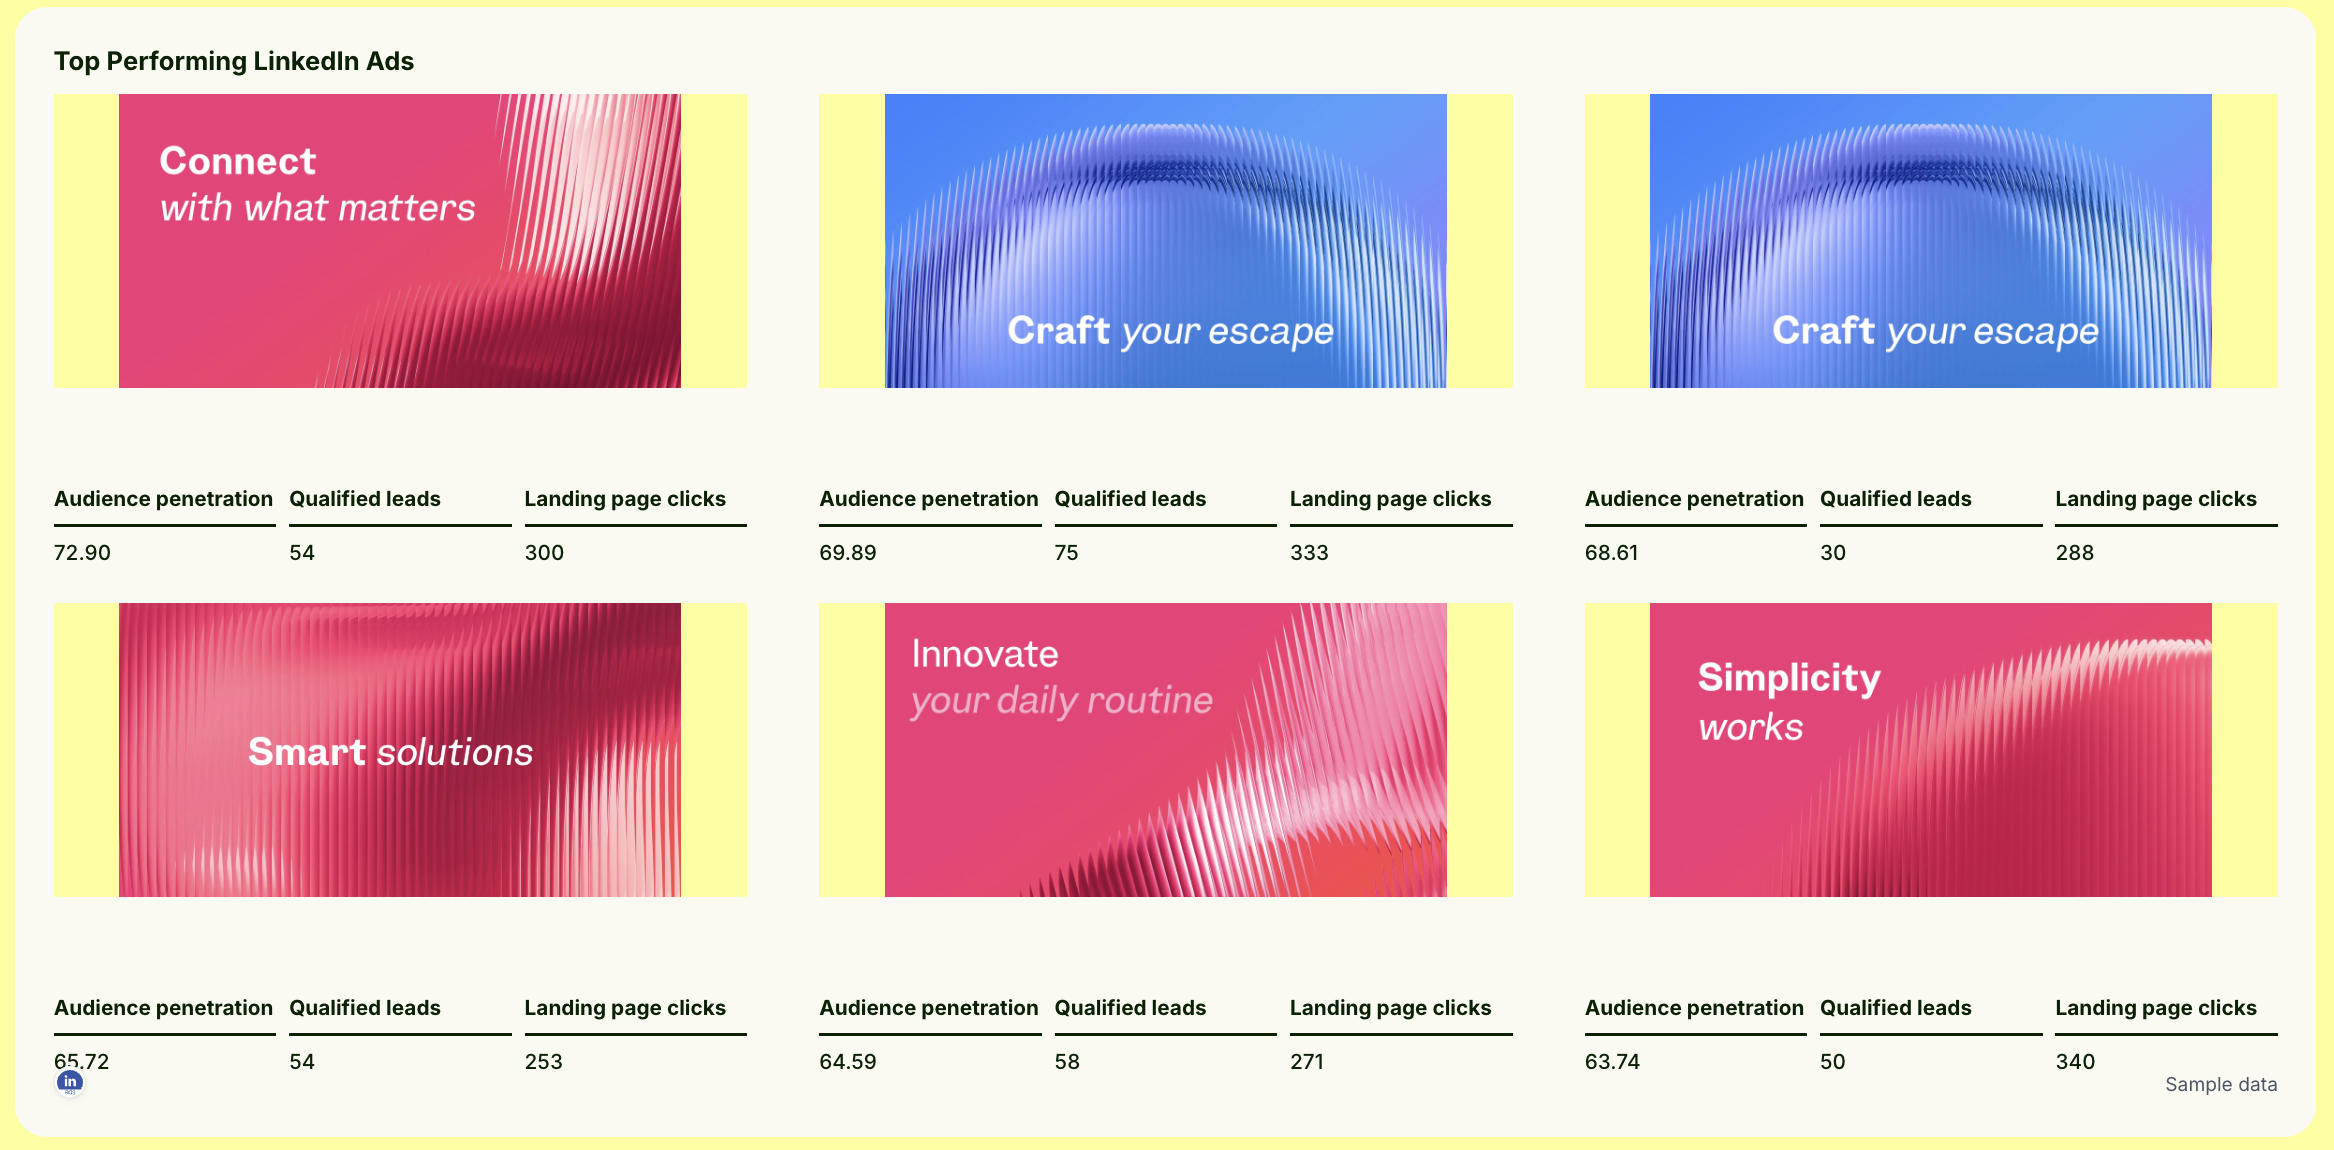
LinkedIn Ads performance lives and dies by creative. This section shows which ads are actually pulling weight.
Include:
- A carousel of top-performing ad creatives (sponsored content, text ads, or any other ad types you're running)
- Per-ad metrics underneath each creative: audience penetration, qualified leads, and landing page clicks
This gives your client something concrete to react to, which is far more useful than a table of campaign names they have to mentally decode.
3. Campaign performance breakdown
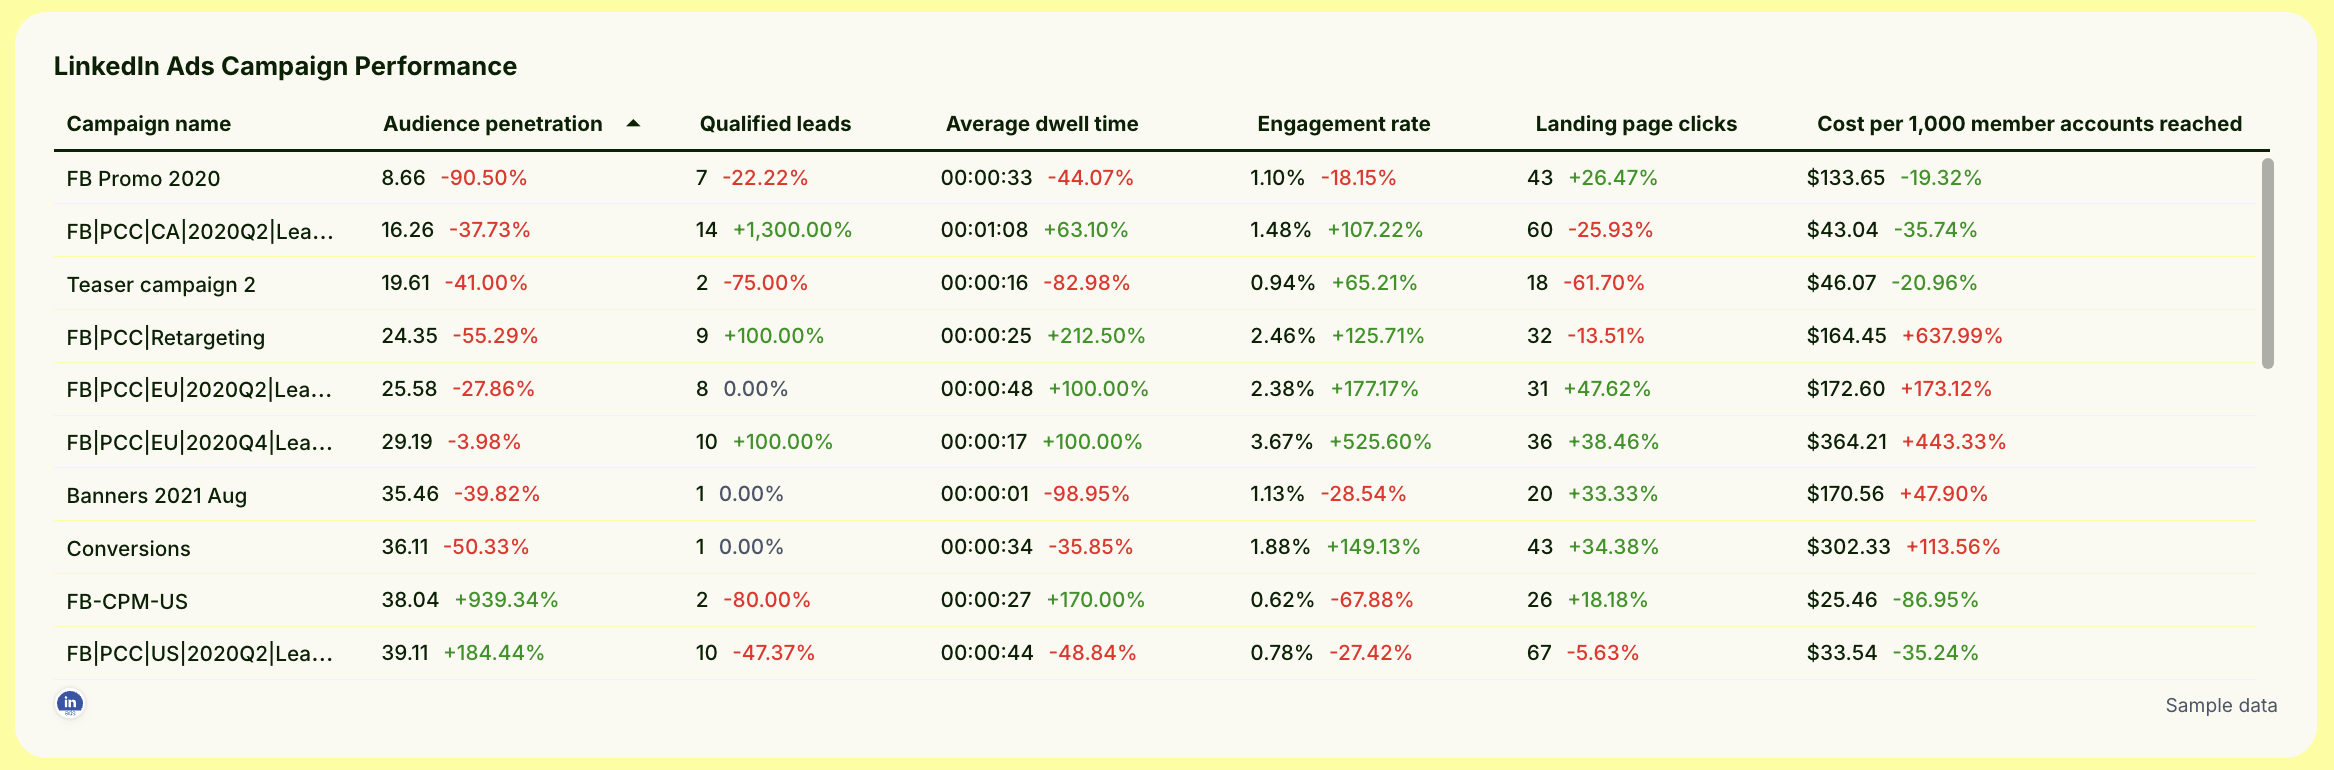
Drill into how individual LinkedIn Ads campaigns are performing with a campaign performance table.
For each campaign, show:
- Campaign name
- Audience penetration
- Qualified leads
- Average dwell time
- Engagement rate
- Landing page clicks
- Cost per 1,000 member accounts reached
This is where you identify what to scale, what to pause, and what needs a creative refresh before your client asks the question first.
4. Summary, wins, and recommendations
This is the section most LinkedIn Ads analytics reports skip entirely. It's also the one clients read first.
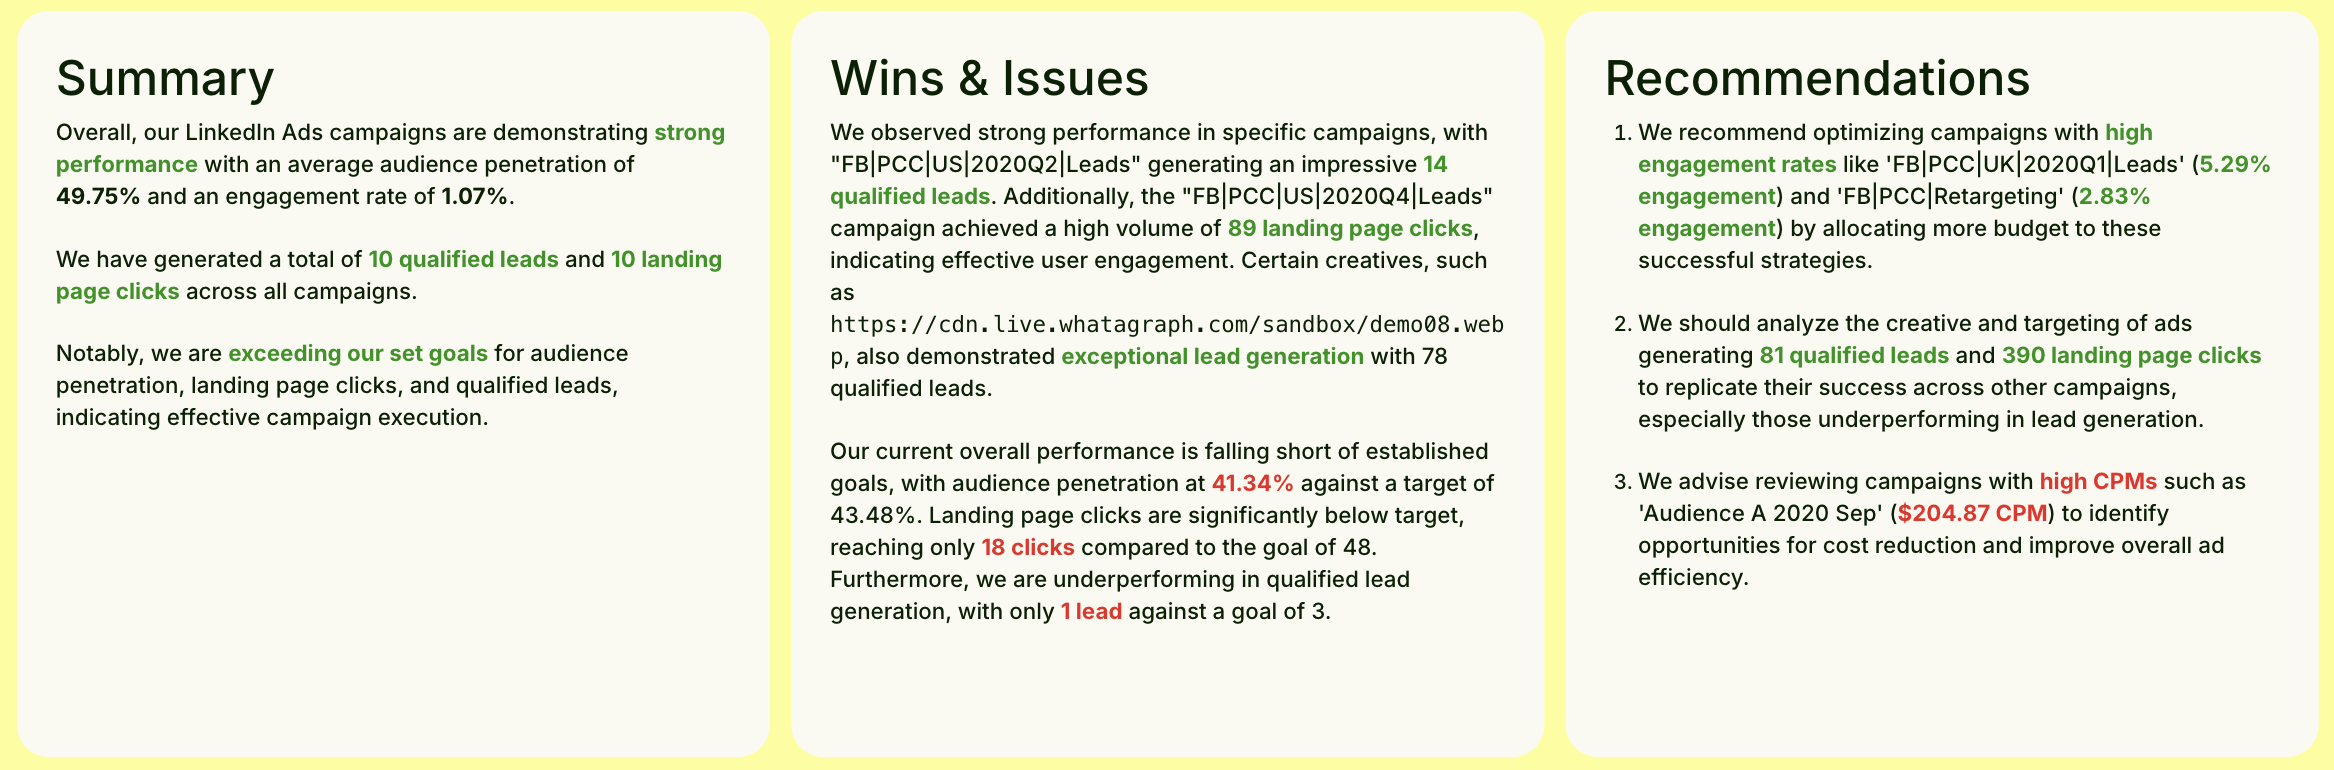
Include three text widgets side by side:
- Summary: overall performance for the period
- Wins and issues: what worked, what didn't, and where targets were missed
- Recommendations: specific actions for the next reporting period
Writing these manually every cycle is slow. Whatagraph IQ Summary reads your actual LinkedIn Ads data directly from the report and writes all three sections automatically, in 18 languages.
And for further analysis, Whatagraph MCP connects your Whatagraph account directly to Claude or ChatGPT.
You can ask plain-language questions about your LinkedIn Ads data without opening a dashboard or building a new report.
A few prompts to start with:
- "Which LinkedIn Ads campaigns had the highest audience penetration this month?"
- "Show me qualified leads and landing page clicks by campaign for the last 30 days."
- "Which ads have high spend but low engagement rate right now?"
- "Compare cost per 1,000 member accounts reached across my active campaigns this quarter."
Full setup guide: Connect Whatagraph to your AI assistant with MCP.
Which metrics to track in a LinkedIn Ads report template?
Most LinkedIn Ads reports track the wrong things.
CTR, CPM, and CPC are easy to pull from LinkedIn Campaign Manager - but according to Patrick Cumming (who co-created this template), they're not what move the needle:
CTR (click-through rate), CPMs, and CPCs (cost-per-click) are a total waste of time to track. The only things that really matter: are you reaching 80% audience penetration and 10 frequency every 90 days. Is it converting to pipeline or not?
Instead, Patrick says he only tracks these 7 metrics:
- Audience penetration - the percentage of your total target audience that has been exposed to your ads. Patrick's benchmark: 80% every 90 days. Below that, you're not reaching enough of your demographic for real demand.
- Frequency (impressions / reach) - how many times each unique user has seen your ads. The target is 10 per 90-day window. Without frequency, even a strong creative gets forgotten before it influences a decision.
- Qualified leads (SQLs) - not all conversions are equal. Track leads that actually enter the pipeline, filtering out micro-conversions that inflate numbers without moving revenue.
- Landing page clicks - a meaningful signal of intent. Someone clicking through to your landing page is showing genuine interest beyond a passive impression.
- Landing page CTR - landing page clicks divided by impressions. Useful for comparing conversion efficiency across different ads, ad types, and campaign types.
- Average dwell time - how long someone engaged with your ad before scrolling away. Patrick specifically says it’s a leading indicator of content relevance and future recall.
- Engagement rate - likes, comments, shares, and follows relative to impressions. Useful for figuring out which creatives are connecting with your a
- Cost per 1,000 member accounts reached - how much it costs to reach unique companies, not just individual users. This metric makes LinkedIn Ads costs make sense.


