
What To Include in a Content Marketing Report Template
A strong content marketing report template follows a simple rule: start with outcomes, then explain what drove them.
Each section below mirrors how real content marketers structure reports in Whatagraph—summary first, then channel-level detail, supported by trends, comparisons, and clear visuals.
1. Marketing Summary
Channels connected: All your marketing channels
This is the executive overview for stakeholders. It ties your marketing strategy to results and sets context for the rest of the performance report.
In short, it answers one question fast: Is content working, and why?
What to include:
- High-level key performance indicators (KPIs): total users, sessions, conversions, conversion rate
- Performance trackers showing progress vs. targets
- A short written summary highlighting wins, losses, and changes from the previous content monthly report
- One to three recommendations to help optimize future marketing efforts
- Trend graphs (last 12 months) for clicks, impressions, conversions
- Funnel visual showing impressions → clicks → conversions
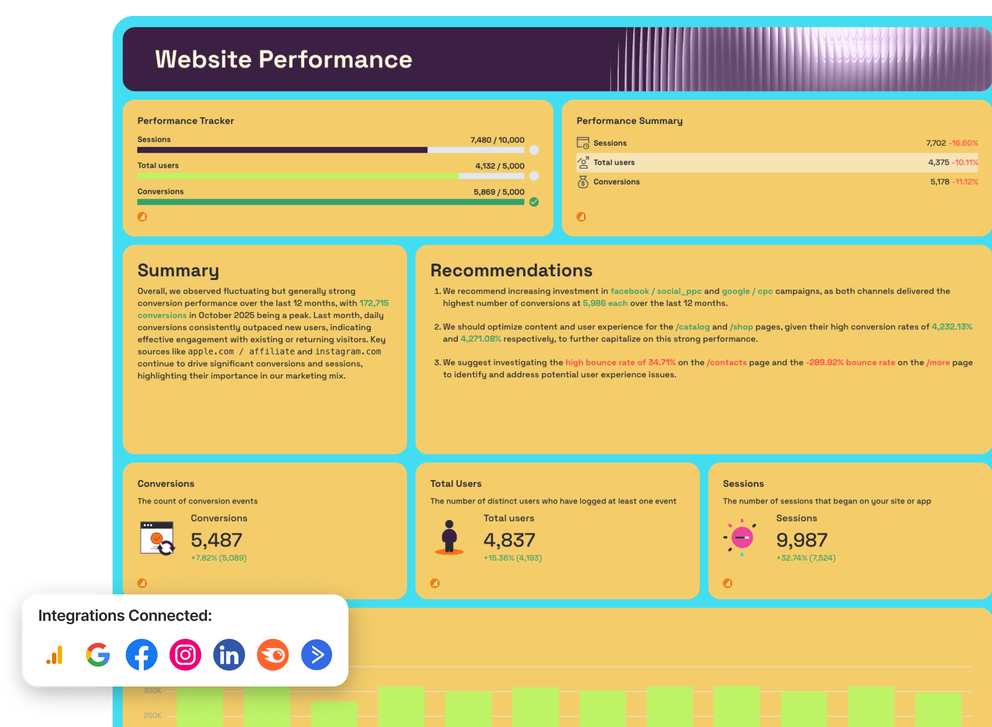
2. Website Performance
Channels connected: Google Analytics 4
This section shows what happens after content drives traffic. It’s where you connect website traffic to behavior, outcomes, and revenue.
What to include:
- Website traffic: users, sessions, new users
- Engagement metrics: average engagement time, bounce rate
- Conversions and conversion rate over time
- Traffic and conversion breakdown by source
- Device and platform performance
- Demographics (country, age, gender)
- Line charts for trends, bar charts for source comparisons, tables for page-level performance
3. SEO
Channels connected: Semrush, Google Search Console, Google Analytics 4
This section measures how content performs in organic search and where it’s gaining—or losing—visibility.
What to include:
- Organic traffic and SEO-driven conversions
- Keyword rankings (Top 3, Top 10, Top 20)
- Average position and ranking distribution
- Keyword-level performance (impressions, clicks, CTR)
- Backlinks and referring domains
- Keyword movement over time (improved vs. declined)
- Pie charts for ranking distribution, tables for keyword breakdowns, trend lines for growth
4. GEO
GEO focuses on how content performs in generative and AI search engines, alongside traditional SEO. It helps you understand how new discovery paths contribute to overall content marketing results.
What to include:
- Sessions, users, and events from AI sources
- Views and engagement trends from GEO traffic
- Top referring AI sources and URLs
- GEO vs. SEO comparison metrics
- Landing page performance for GEO traffic
- Time-series graphs for views and sessions
- Tables comparing GEO and SEO performance side by side
5. Facebook
This section focuses on how organic social media content performs organically on Facebook and how this leads to more followers, clicks, and conversions.
What to include:
- Reach, impressions, and follower growth
- Engagement metrics (reactions, comments, shares)
- Engagement rate and post-level performance
- Content format performance (posts vs. reels)
- Follower demographics (country, city)
- Funnels from impressions → reach → engagement → clicks
- Line charts for trends, tables for top-performing posts
- Carousel tables showing top performing posts and stories
6. Instagram
This section of the dashboard visualizes how Instagram social media marketing content leads to more followers, clicks, and conversions.
What to include:
- Impressions, reach, and follower growth
- Engagement rate and total interactions
- Stories and reels performance
- Video plays and engagement by content type
- Audience demographics and follower growth rate
- Trend graphs for reach and engagement
- Carousel tables for top posts, stories, and reels
7. LinkedIn
The LinkedIn section shows how content performs with a professional audience and supports B2B lead generation and awareness goals.
What to include:
- Key metrics like impressions, clicks, and engagement rate
- Follower growth and new followers
- Post-level engagement and click performance
- Audience demographics by role, location, or seniority (where available)
- Trend charts for impressions and clicks
- Carousel table highlighting top-performing posts
8. Email Marketing
This section connects how email content leads to clicks and conversions.
What to include:
- Emails sent and delivered
- Open rate and click-through rate (CTR)
- Conversions driven by email campaigns
- Email marketing Performance by campaign or newsletter
- Engagement trends over time
- Bar charts for campaign comparison
- Line charts for opens, clicks, and conversions


