
What To Include in a Marketing Mix Report Template
A marketing mix report should help you evaluate marketing performance across all marketing channels in one place, and help you plan better marketing strategy for the future.
Based on marketing report templates created by marketers on Whatagraph, here are the sections we recommend you include in your marketing mix dashboard template:
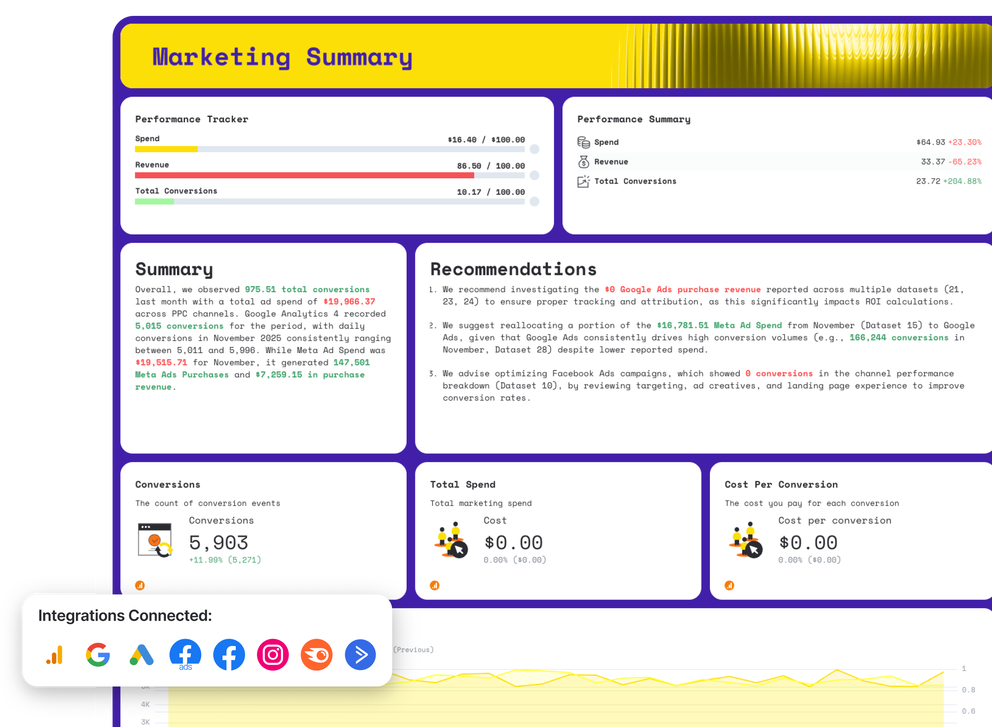
1. Marketing Summary
Channels connected: All your marketing channels
This section acts as the executive summary of your digital marketing report.
It shows how your combined marketing efforts contribute to outcomes and gives stakeholders a fast way to assess progress against the marketing plan.
What to include
- Total conversions and overall conversion rate
- Cross-channel spend and revenue
- High-level KPIs tied to core marketing goals
- Channel comparison table showing campaign-level results
- Monthly trends for conversions, spend, and revenue
- A roll-up performance report with short insights
- A high-level marketing dashboard view for leadership
- Clear takeaways to help teams optimize future initiatives
2. Website Performance
Channels connected: Google Analytics
This section explains how traffic behaves once it reaches your site. It connects acquisition activity to website traffic, on-site engagement, and outcomes like lead generation or sales.
What to include
- Users, sessions, and returning visitors
- Conversions and assisted conversions
- Bounce rate and engagement trends
- Source and medium performance
- Page-level performance for key landing pages
- Device and browser breakdowns
- One key demographic view (location or age)
- Trend graphs showing traffic and conversions over time
3. SEO
Channels connected: Google Search Console, Semrush
The SEO performance section shows how organic search contributes to your overall marketing mix.
It focuses on keyword visibility, rankings movement, and authority signals so you can understand whether SEO is strengthening or weakening over time.
What to include
- SEO performance goals vs actual results
- A written summary highlighting gains, losses, and risk areas
- Clear recommendations tied to ranking declines, technical issues, or backlink erosion
- Average position across organic Google search results
- Total organic traffic and period-over-period change
- Total keyword rankings, broken down by Top 3, Top 10, and Top 20 positions
- Keyword distribution charts comparing last month vs year-to-date
- Improved vs declined keyword rankings by position group
- Keyword-level performance table including impressions, clicks, CTR, and average rank
- Total backlinks and backlink growth or loss over time
- Referring domains, including new and lost domains
- Domain authority or authority score trend
4. Google Ads
Channels connected: Google Ads
This section evaluates paid search and display performance, showing how PPC spend turns into measurable results like conversions and eCommerce revenue.
What to include
- Impressions, clicks, and total cost
- CPC, CTR, and conversions
- Campaign-level a performance
- Keyword performance and quality signals
- Conversion trends by ad campaign
- Spend vs results over time
- Campaign performance compared month over month
- A focused SEO report reference for branded vs non-branded terms
5. Facebook Ads
Channels connected: Facebook Ads
This section measures paid social performance and creative effectiveness. It helps you understand how messaging, audiences, and placements influence conversions
What to include
- Reach, impressions, and spend
- Clicks, CTR, and conversions
- CPM and cost per conversion
- Campaign and ad-set breakdowns
- Creative-level performance
- Placement performance comparisons
- Audience insights tied to personas
- Conversion trends over time
6. Organic Social Media (Facebook & Instagram)
Channels connected: Facebook Pages,Instagram Business
This section shows how your social media content marketing performs without paid amplification. It highlights key metrics like engagement, followers, and reach across social media platforms.
What to include
- Reach, impressions, and engagement
- Engagement rate and reactions
- Follower growth trends
- Post-level performance tables
- Best-performing content formats
- A concise social media report summary
- Channel comparison for Facebook vs Instagram
- Insights tied to your target audience
7. Email Marketing
Channels connected: ActiveCampaign
Email reporting shows how owned distribution supports your broader mix. It connects campaigns to engagement and downstream conversions.
What to include
- Emails sent and delivered
- Opens and click-through activity
- Conversion performance by campaign
- Engagement trends over time
- Unsubscribe and reply metrics
- Contribution to overall marketing performance
- Results summarized in a clear monthly report
- Supporting insights from marketing analytics


