

Challenges
Managing Reporting Operations Across 200+ Clients and 500+ Reports
André Cardoso, Project and Performance Marketing Manager at Wise Pirates, landed at the agency when it was going through an explosive growth.
Between 2020 and 2022, Wise Pirates scaled from 25 to over 100 team members. Now the agency serves over 200 clients across a range of companies under its umbrella, like:
- Performance marketing
- Social media management
- SEO
- Web analytics
- Marketing automation
Each of these companies has its own client base and projects, managed by dedicated Project Managers who act as “pivots” – team members who are hands-on in the project and the main point of contact with the client.
They’re also responsible for delivering monthly client reports that are accurate and high-quality.
When André arrived, the team was already using Whatagraph as their reporting tool. Although he wasn’t involved in the decision-making process, he recalls why they chose Whatagraph initially:
“We started using Whatagraph because of how easy and intuitive it is to create simple reports,” André shared. “Even those who don't have technical knowledge can easily create reports right away.”
But with over 500 reports for different companies, clients, and projects, the challenge wasn’t just creating them—but maintaining consistent, quality reporting at scale.
At the time, there wasn’t yet a dedicated person to oversee the reporting process.
Each Project Manager was left on their own to create their own reports, which opened up room for inconsistencies, messiness, and human errors.
The agency realized they needed someone to bridge the gap between their teams and Whatagraph—someone who could stay on top of platform updates, support team members at creating and maintaining reports, and ensure quality across their growing client portfolio.
“We felt the need to have that specific person to be more organized, to have one specific person to go to for help,” André explained.
We felt the need to have a dedicated person to oversee the reporting process to be more organized.
Solution
Appointing a “Whatagraph Master”
This was when André stepped into his new role as the agency’s “Whatagraph master”.
In addition to managing reports for his own clients, André became the bridge between Whatagraph and all Project Managers across Wise Pirates.
“I am the Whatagraph master in the company,” André laughed. “When a Project Manager has any doubts using the platform or they need help, they come to me. And I stay on top of all your new features and functionalities.”
This centralized approach means no knowledge about the product gets lost, and Project Managers always have a go-to resource for support to create accurate and consistent reports across the board.
Building out templates
To speed up report creation, Wise Pirates had built out a comprehensive template library that covers their main client types:
- E-commerce templates for online retail clients
- Lead generation templates for service businesses
- SEO templates for organic growth campaigns
- Amazon advertising templates for marketplace sellers
- Black Friday templates for seasonal campaigns
Whenever a Project Manager onboards a new client, they can simply select the right template, connect the data sources, and customize as needed.
“It's easier to start working from templates than from complete scratch,” André explained. “For my specific clients, I develop these reports myself. For clients from other Project Managers, I'm just here to help when something happens.”
Organizing reports at scale
But with so many reports, data sources, and clients, Wise Pirates still needed a better way to organize them all—and Whatagraph makes this easy.
On Whatagraph, André can:
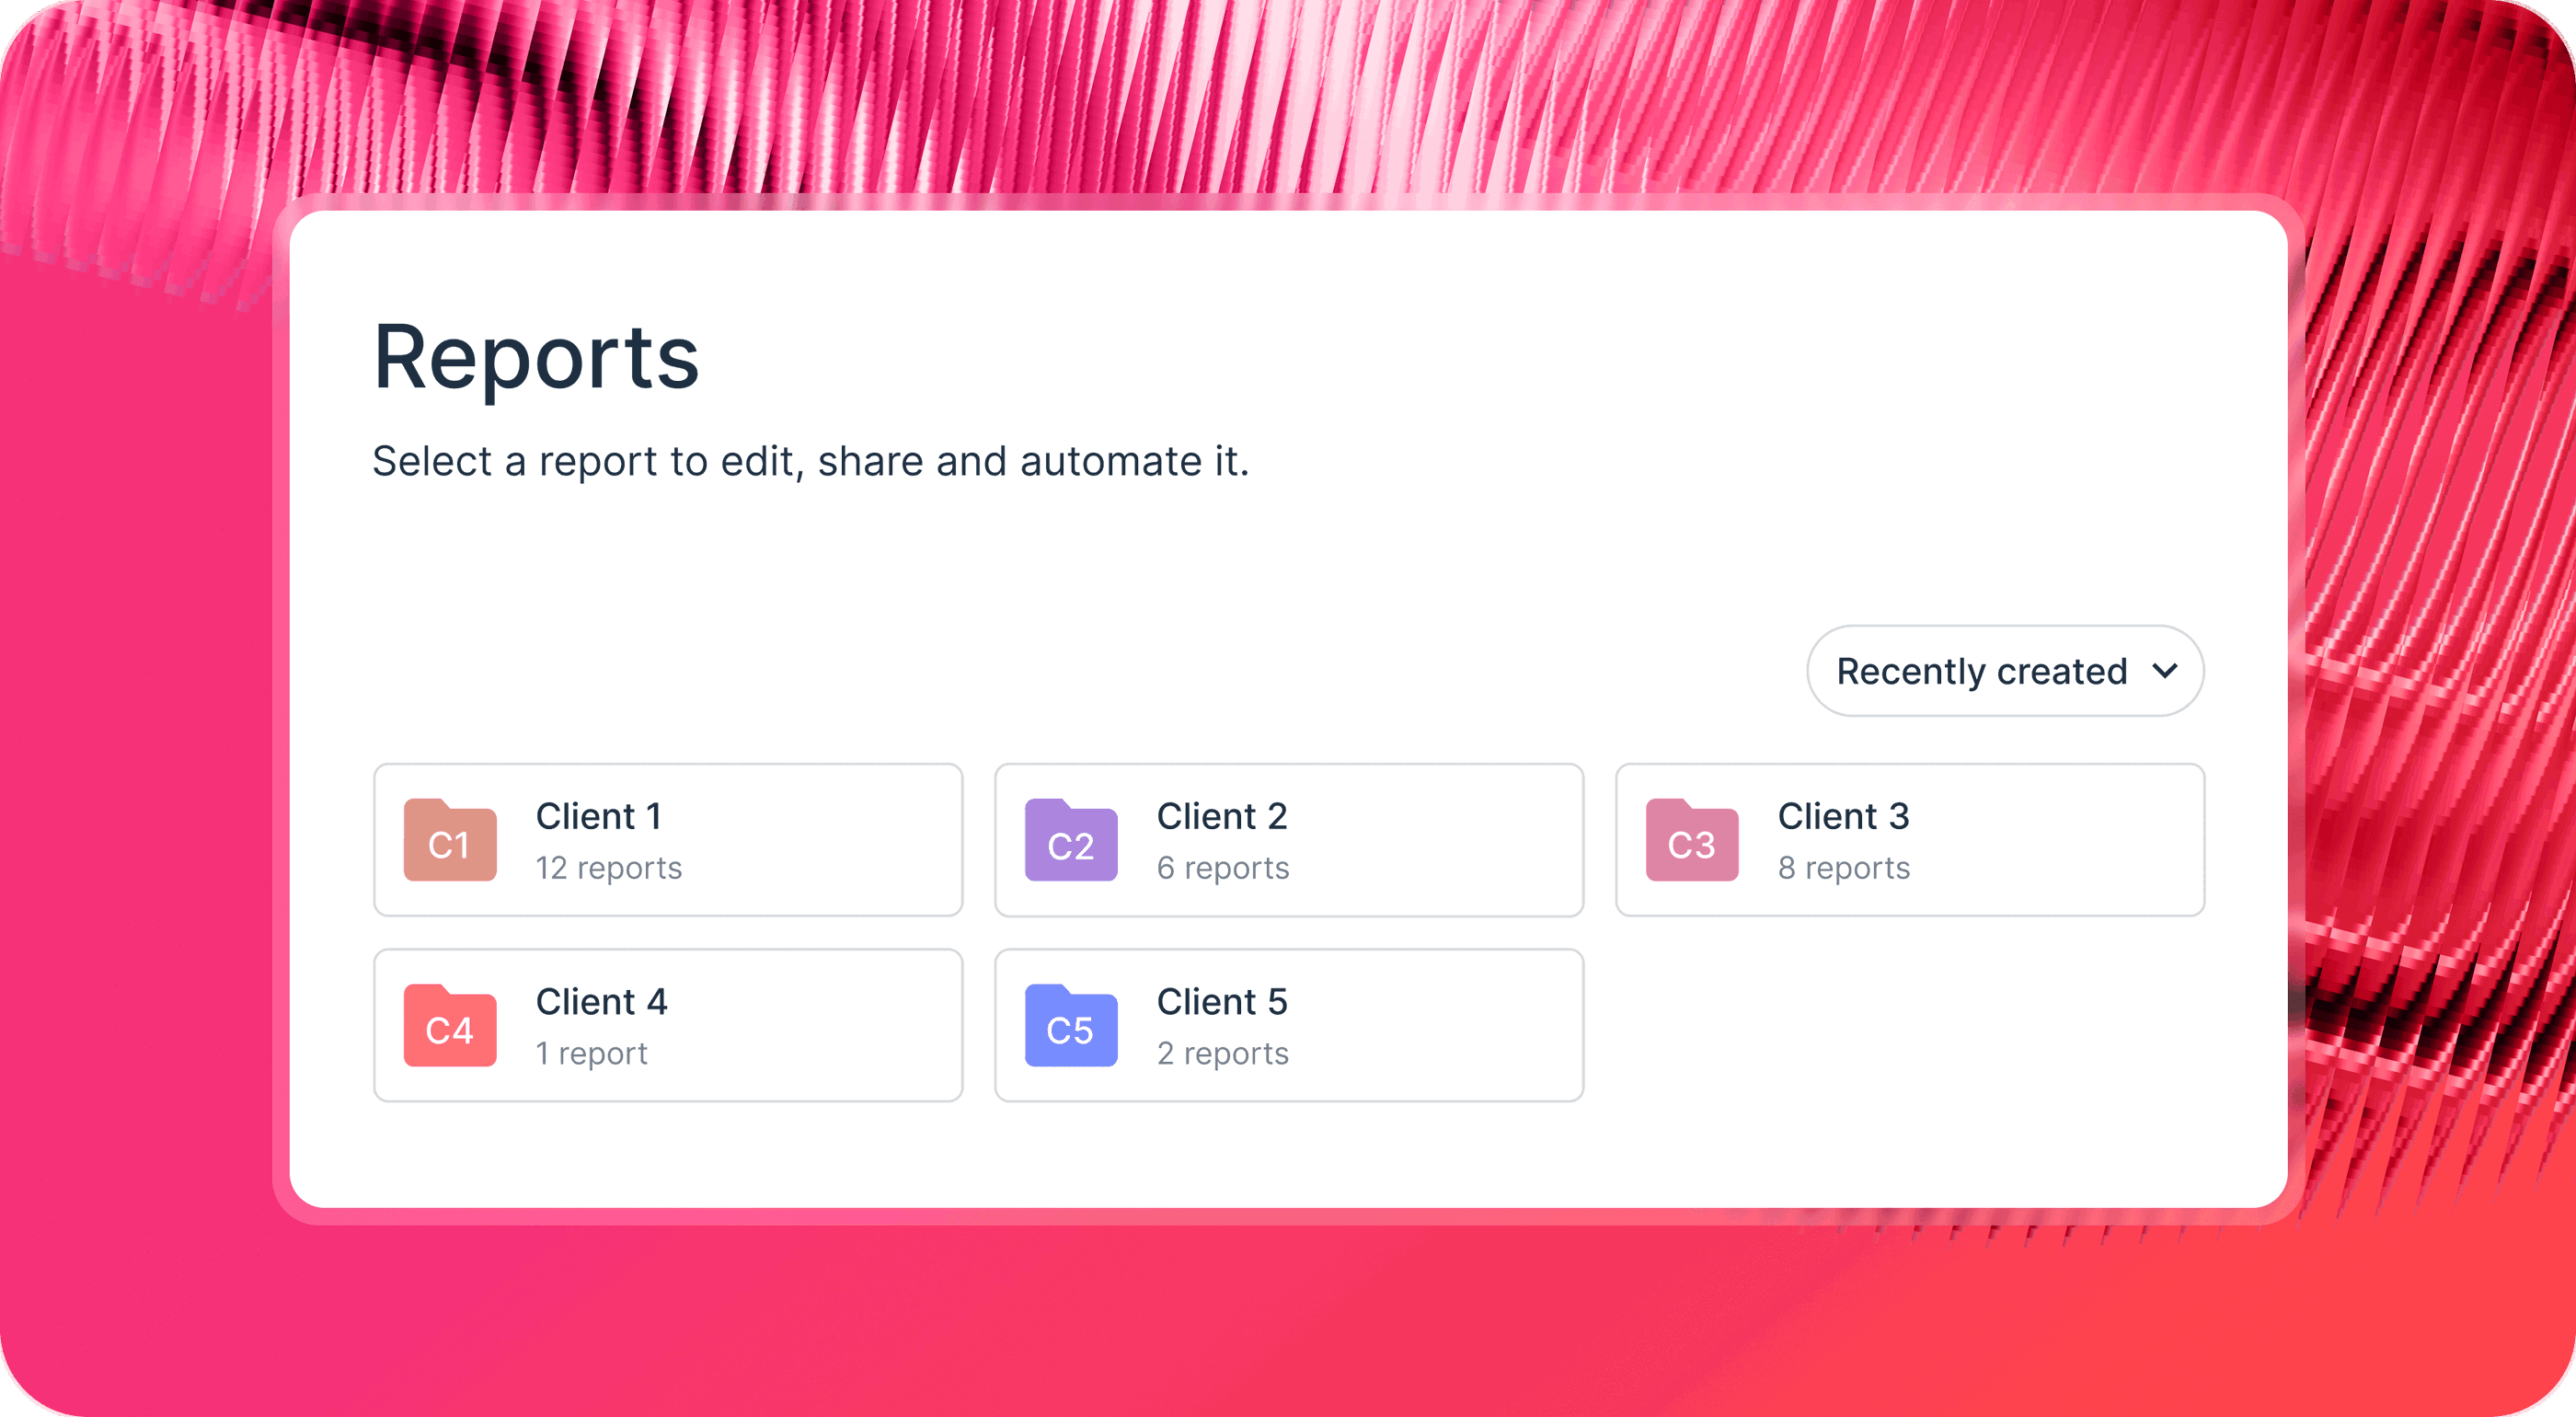
- Organize reports into specific folders
- Add data sources into specific folders
- Assign a specific team member to a client folder
“We now have 220 folders on Whatagraph, and some folders have like 166 reports in them, while others have 22,” André said.
The folder system keeps reports neat and tidy, while making it easy for Project Managers to quickly find what they need.
Taking organization to the next level with “Spaces”
Recently, André got an early look at “Spaces”, Whatagraph’s brand-new way to organize reports.
Instead of just folders, Spaces act as dedicated hubs that bring everything related to a client or project together in one place:
- Data sources
- Report templates
- Client-facing reports
- Internal performance monitoring dashboards (we call them “Overviews”)
With Spaces, Project Managers can not only store reports neatly, but also:
- Attach Overviews directly to a client space
- Create new reports, templates, or AI reports right inside a space
- Collapse or expand sections to keep navigation clean
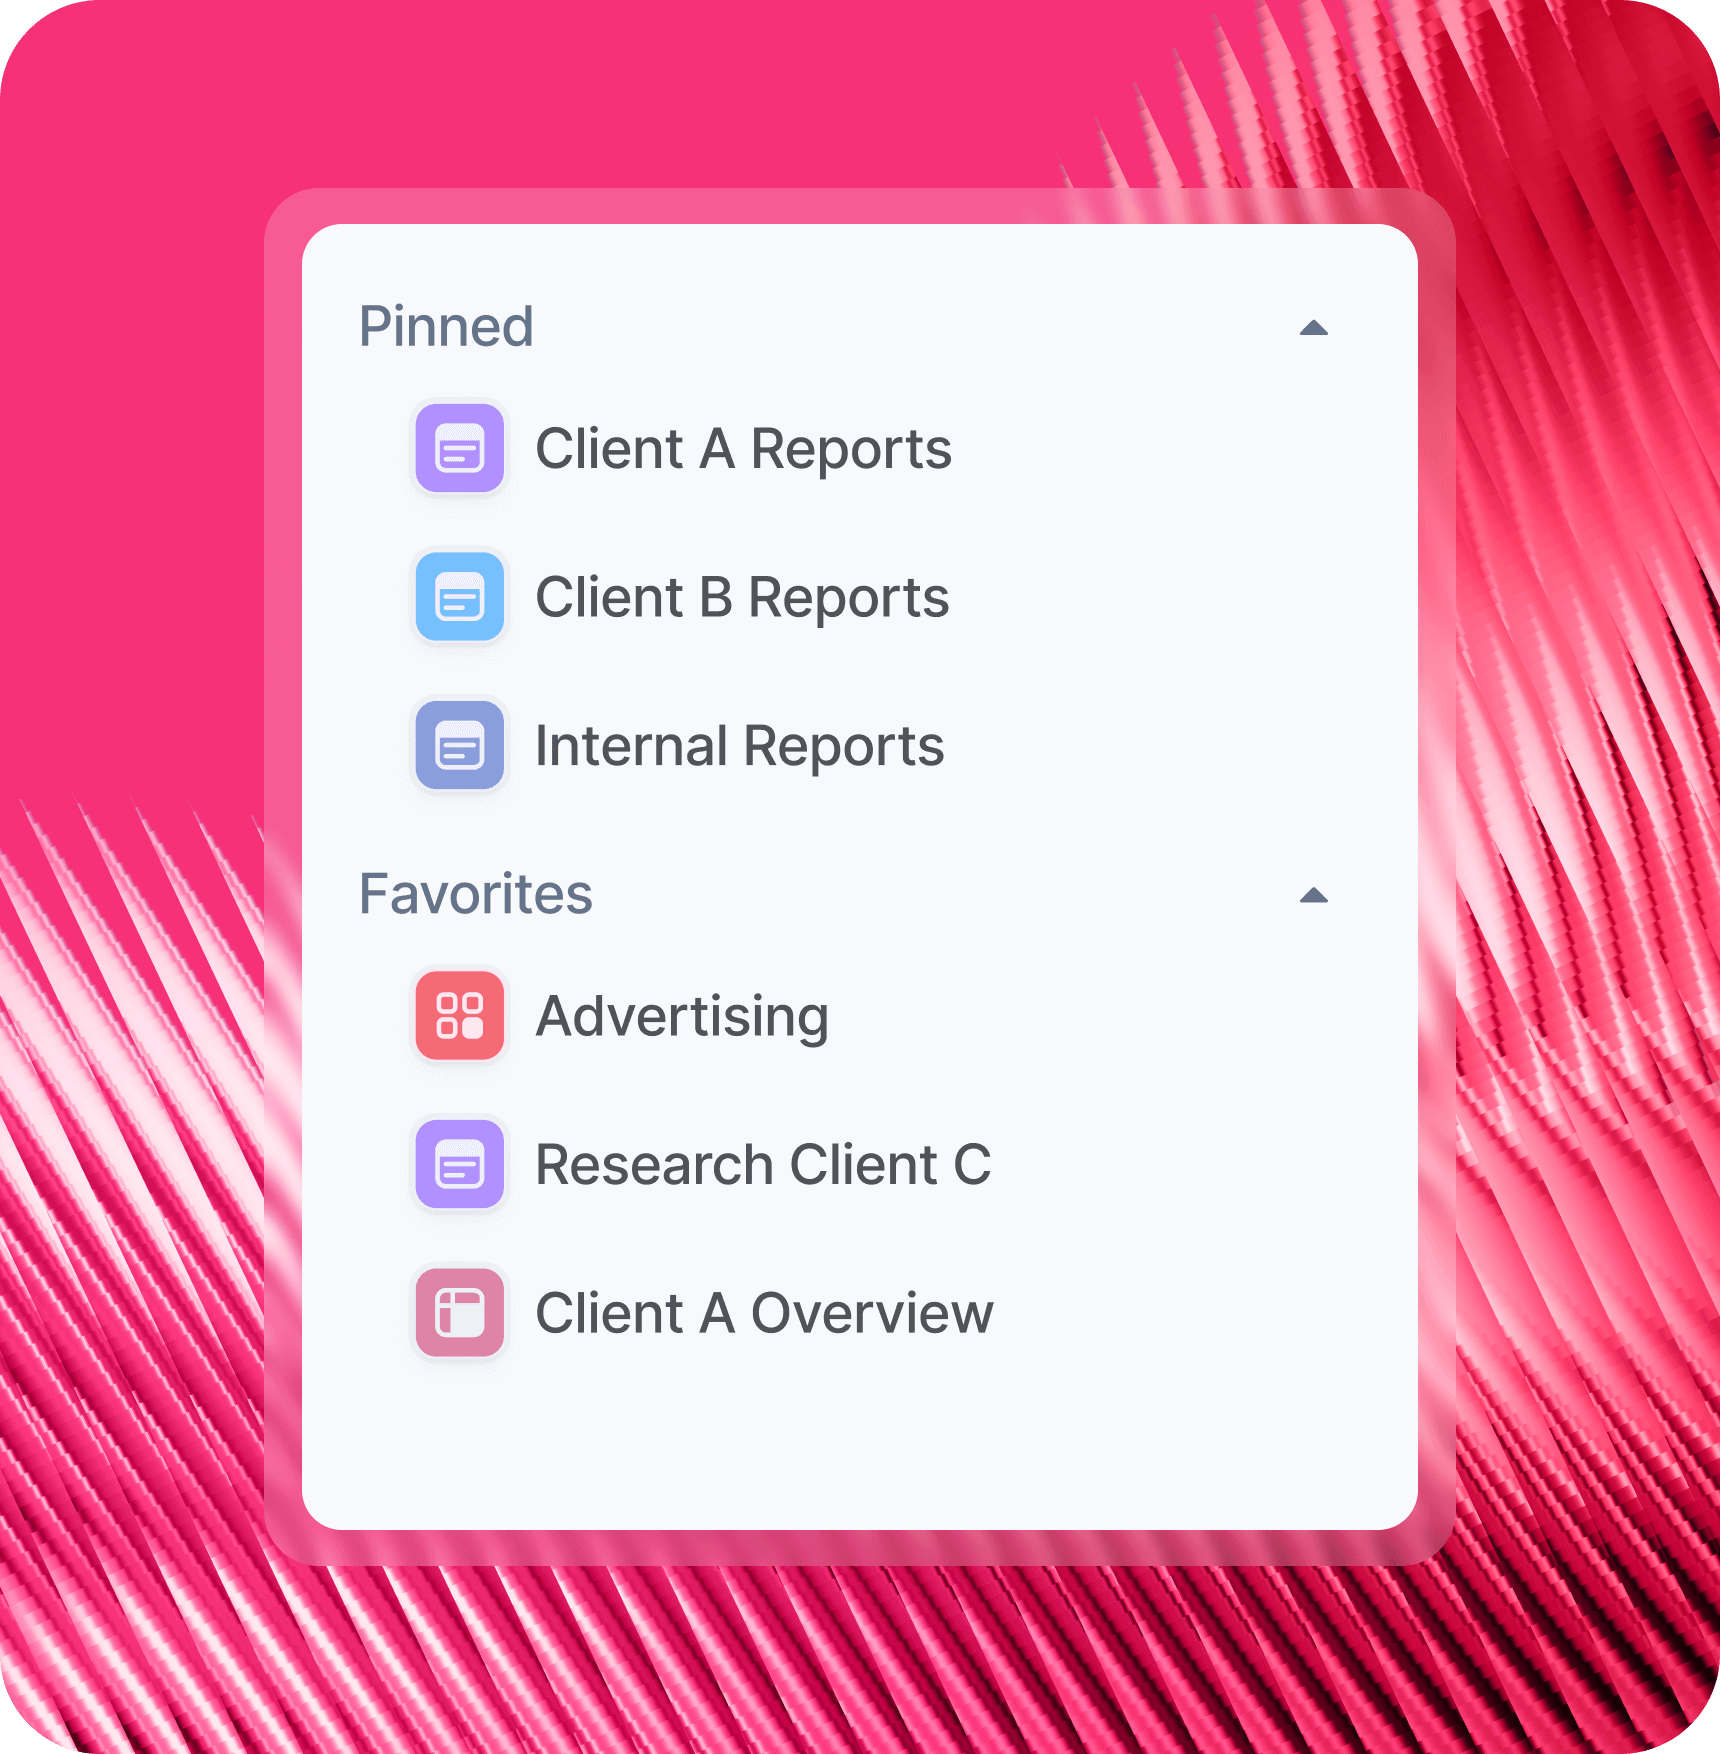
- Favorite or pin specific Spaces for quicker access
“My first impression is that Spaces is a lot easier to navigate," André shared. "It's a lot more intuitive, a lot cleaner, and even more modern. I think the rest of the team is going to really quickly get used to the new interface and really like using it.”
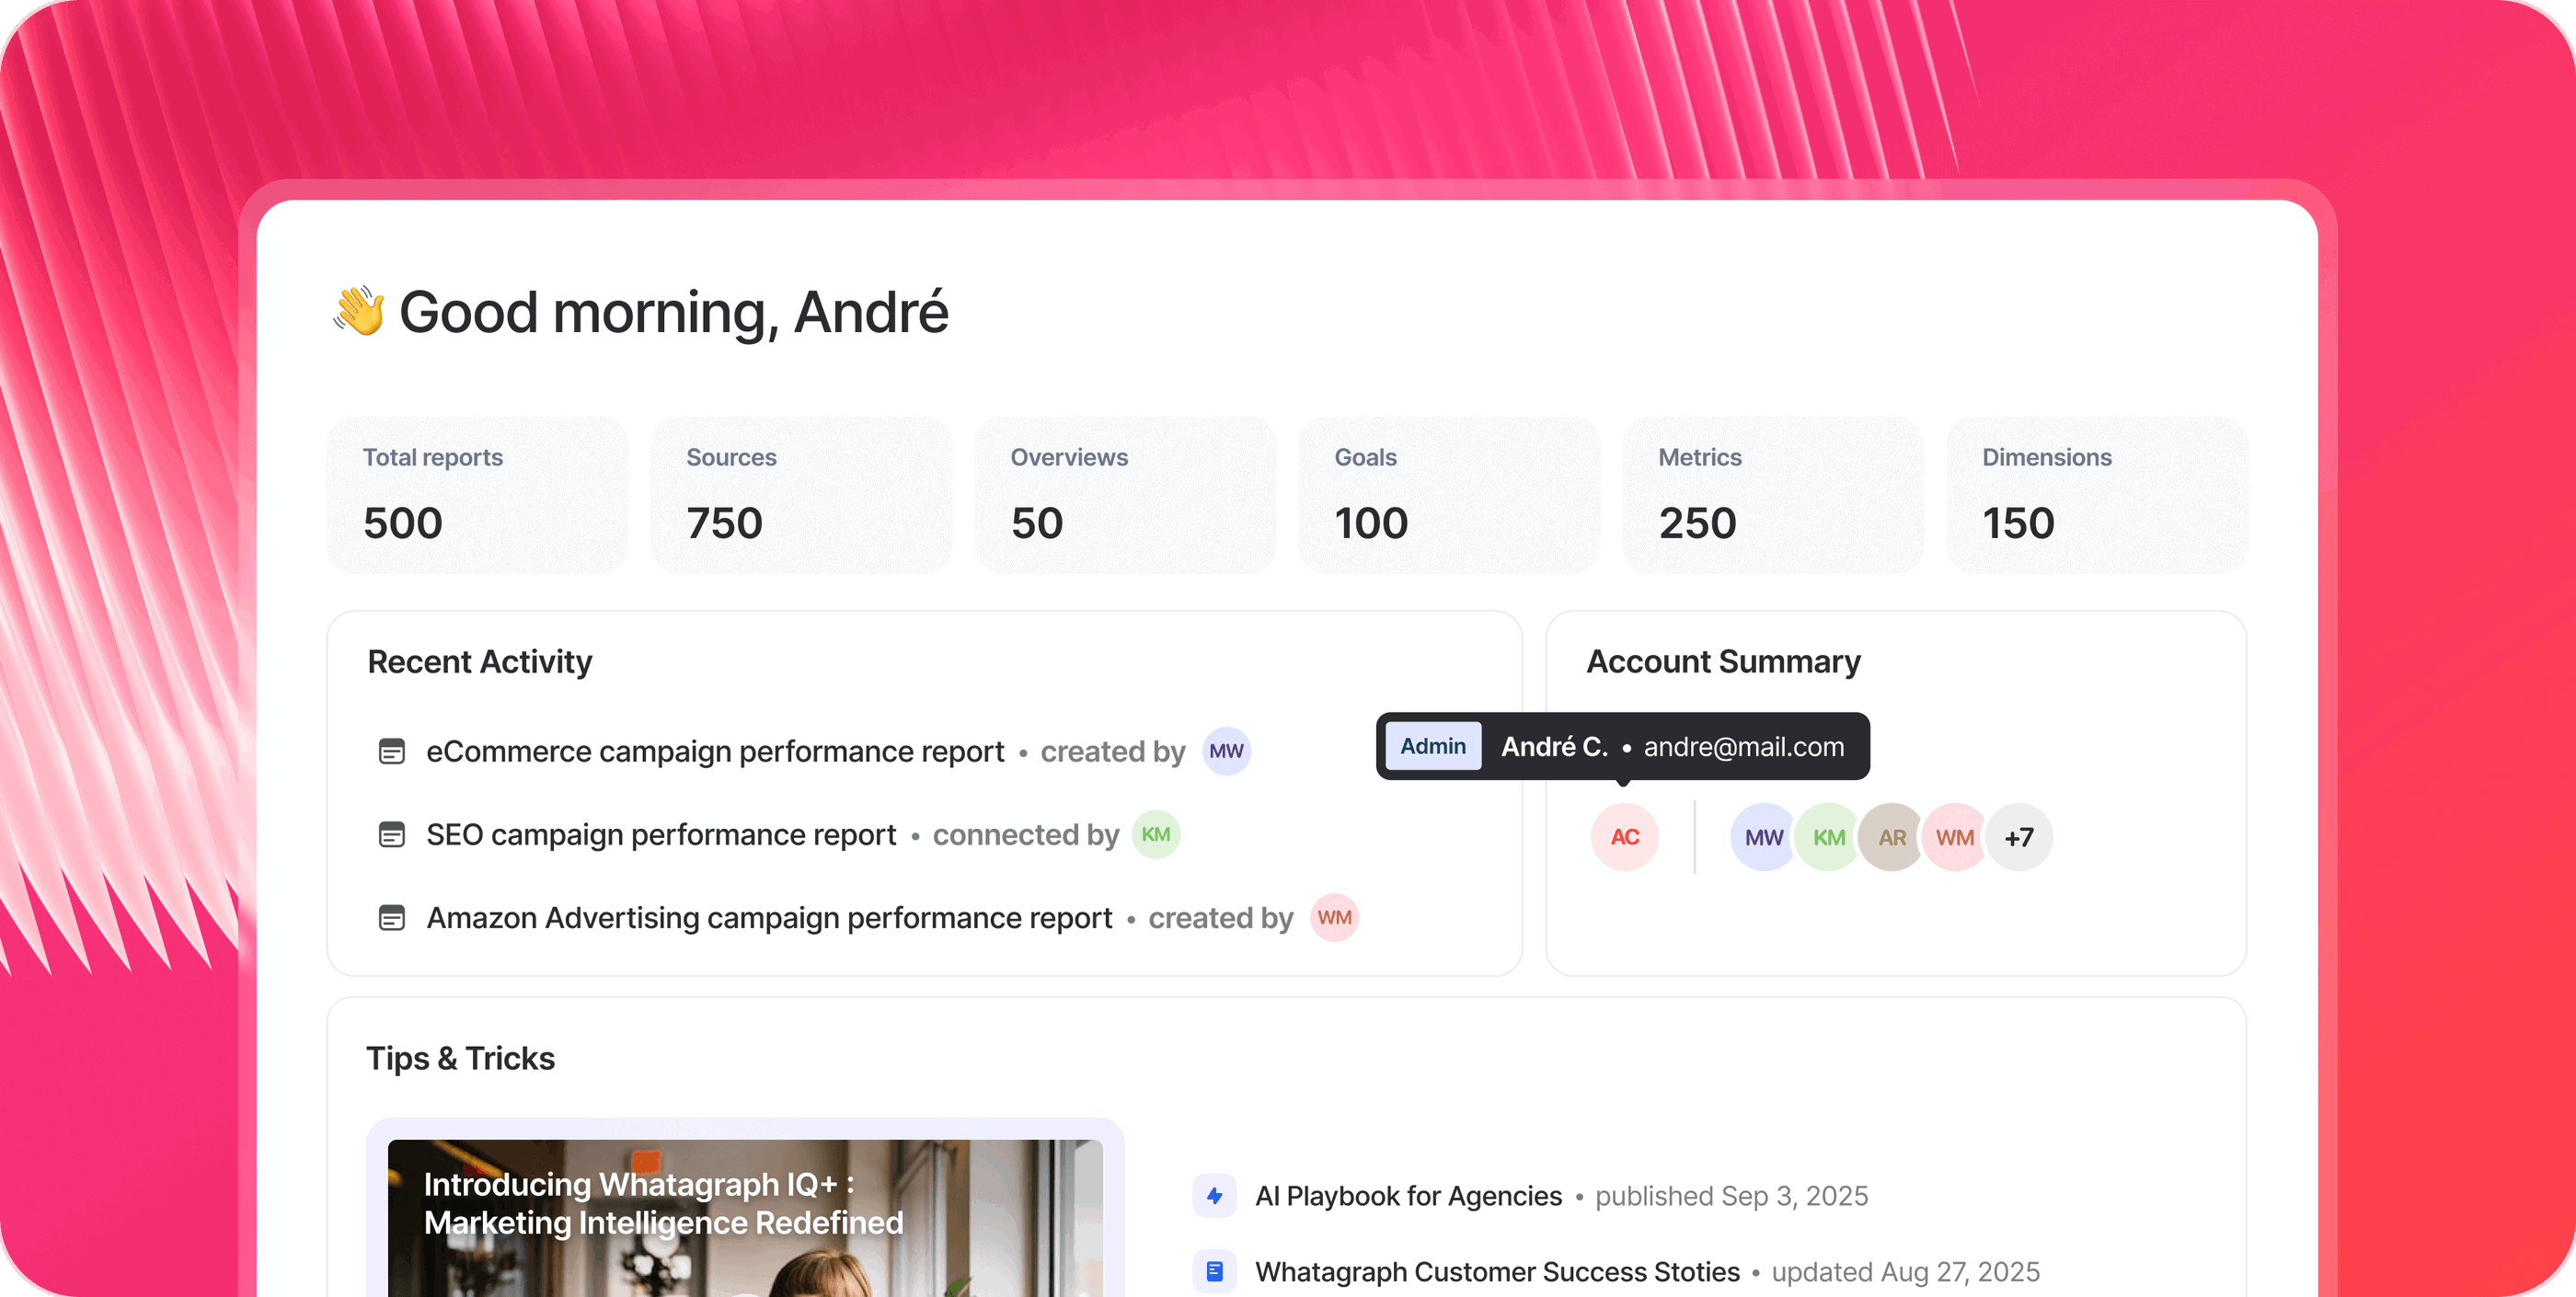
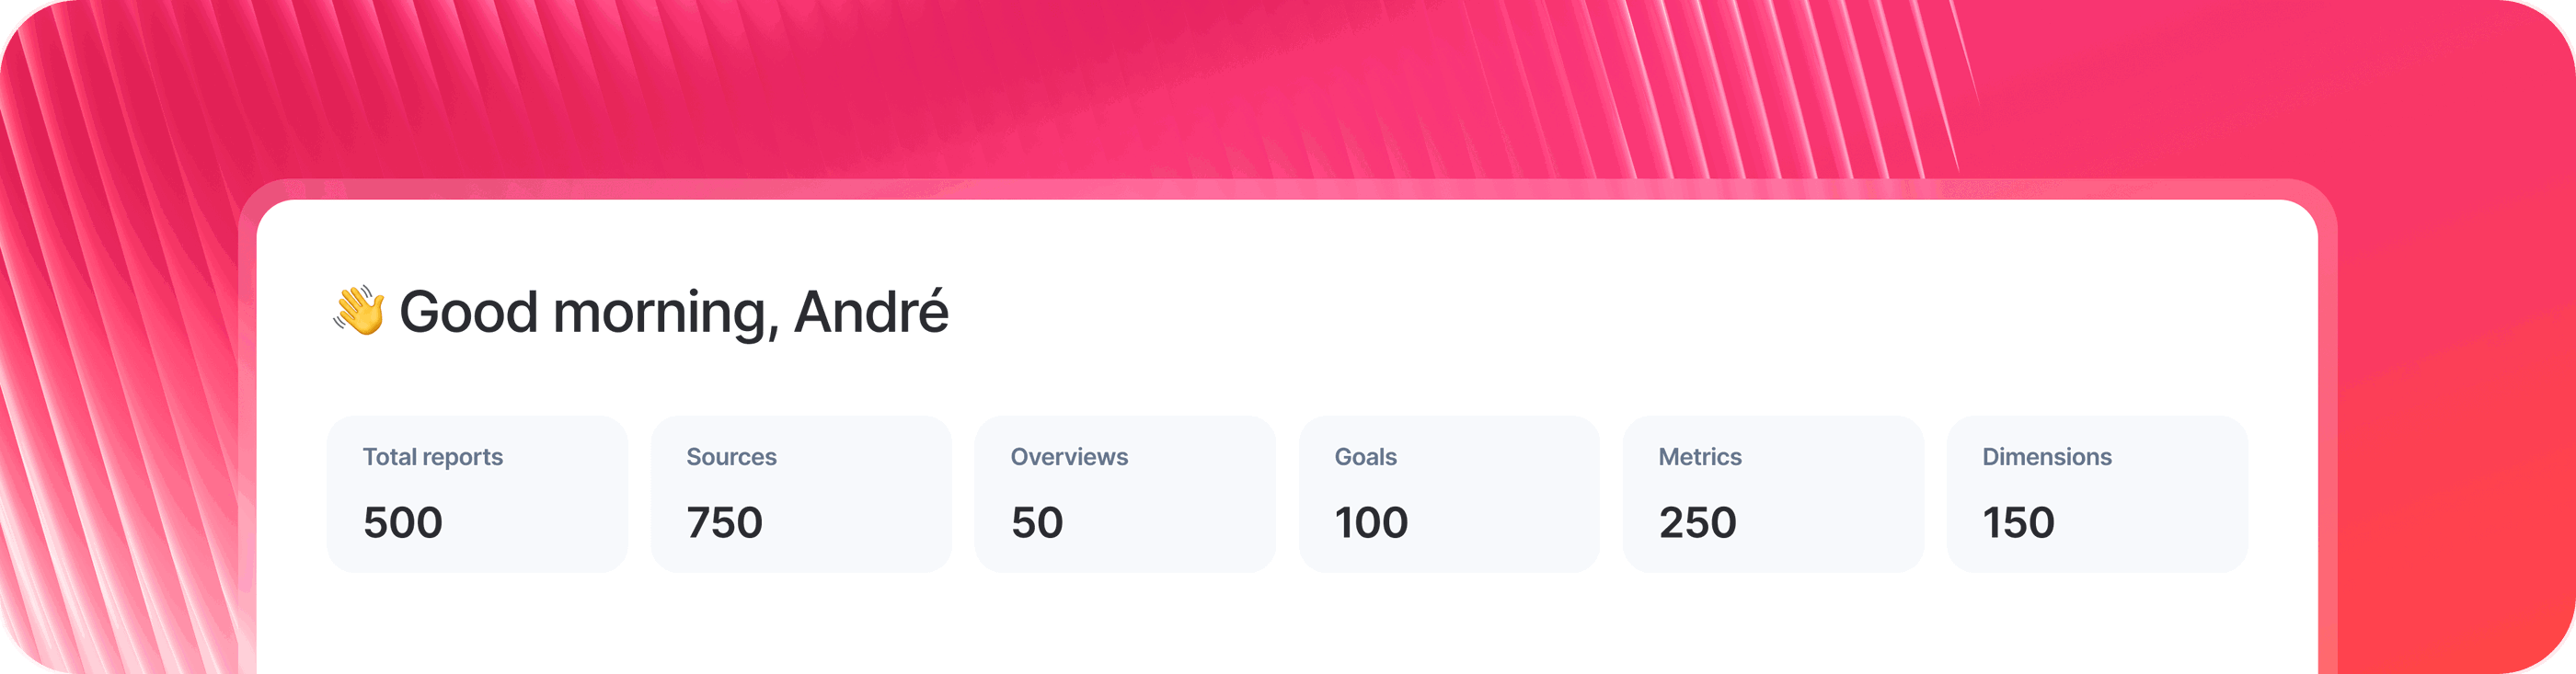
He was especially excited about the new overview metrics on the home screen—showing total reports and data sources at a glance:
“I really, really like those big numbers right at the beginning—total reports, total sources, like overviews immediately when you enter. I think it’s a really big improvement.”
 Looking ahead, André sees clear value in being able to favorite or pin client spaces:
“I definitely see a great use case for this because not every Project Manager that has access to Whatagraph is working with every single client. For me, I mainly work on six or seven, so it’s a lot easier to just favorite those spaces and go straight to them.”
Testing and implementing AI for greater efficiency
Wise Pirates is also strategically implementing Whatagraph IQ—a suite of AI features to build, style, and understand reports in seconds.
Feature #1: AI Widget Creator
André has extensively tested the AI Widget Creator and found it particularly valuable for building standard widgets.
“The AI Widget Creator is awesome at creating simple widgets, like number of impressions in Meta, number of impressions in Google Ads, the average CPC, average CPM, and so on,” André said.
Instead of building widgets from scratch, the team can just describe the widget they want in plain language—type, metrics, time range, filters—and Whatagraph builds it automatically in seconds.
They can also edit these widgets by just typing in what they want to be changed and Whatagraph AI makes the changes on their behalf.
Here’s how it works:
Feature #2: AI Summaries
André is most excited about the AI Summaries feature, which directly addresses their biggest time sink—typing out summaries manually.
“I’d say in 60-70% of the reports we create, writing out the insights takes the most time,” André explained. “The report itself doesn’t change much once a project gets going, but the team has to invest more time on writing out the insights every time.”
With AI Summaries, the team can:
- Add a text widget directly into a report
- Choose from formats like Summary, Wins, Recommendations, Issues, or a custom prompt
- Choose the language they want from 18 different options
And Whatagraph AI will write out these summaries solely based on the data on your report—without any hallucinations or security breaches.
Here’s how it works:
“I’m really curious to invest more of my time exploring AI Summaries,” André said. “I saw that we can ask for the positives and the negatives, and that can be a timesaver for the team.”
Feature #3: AI Insights
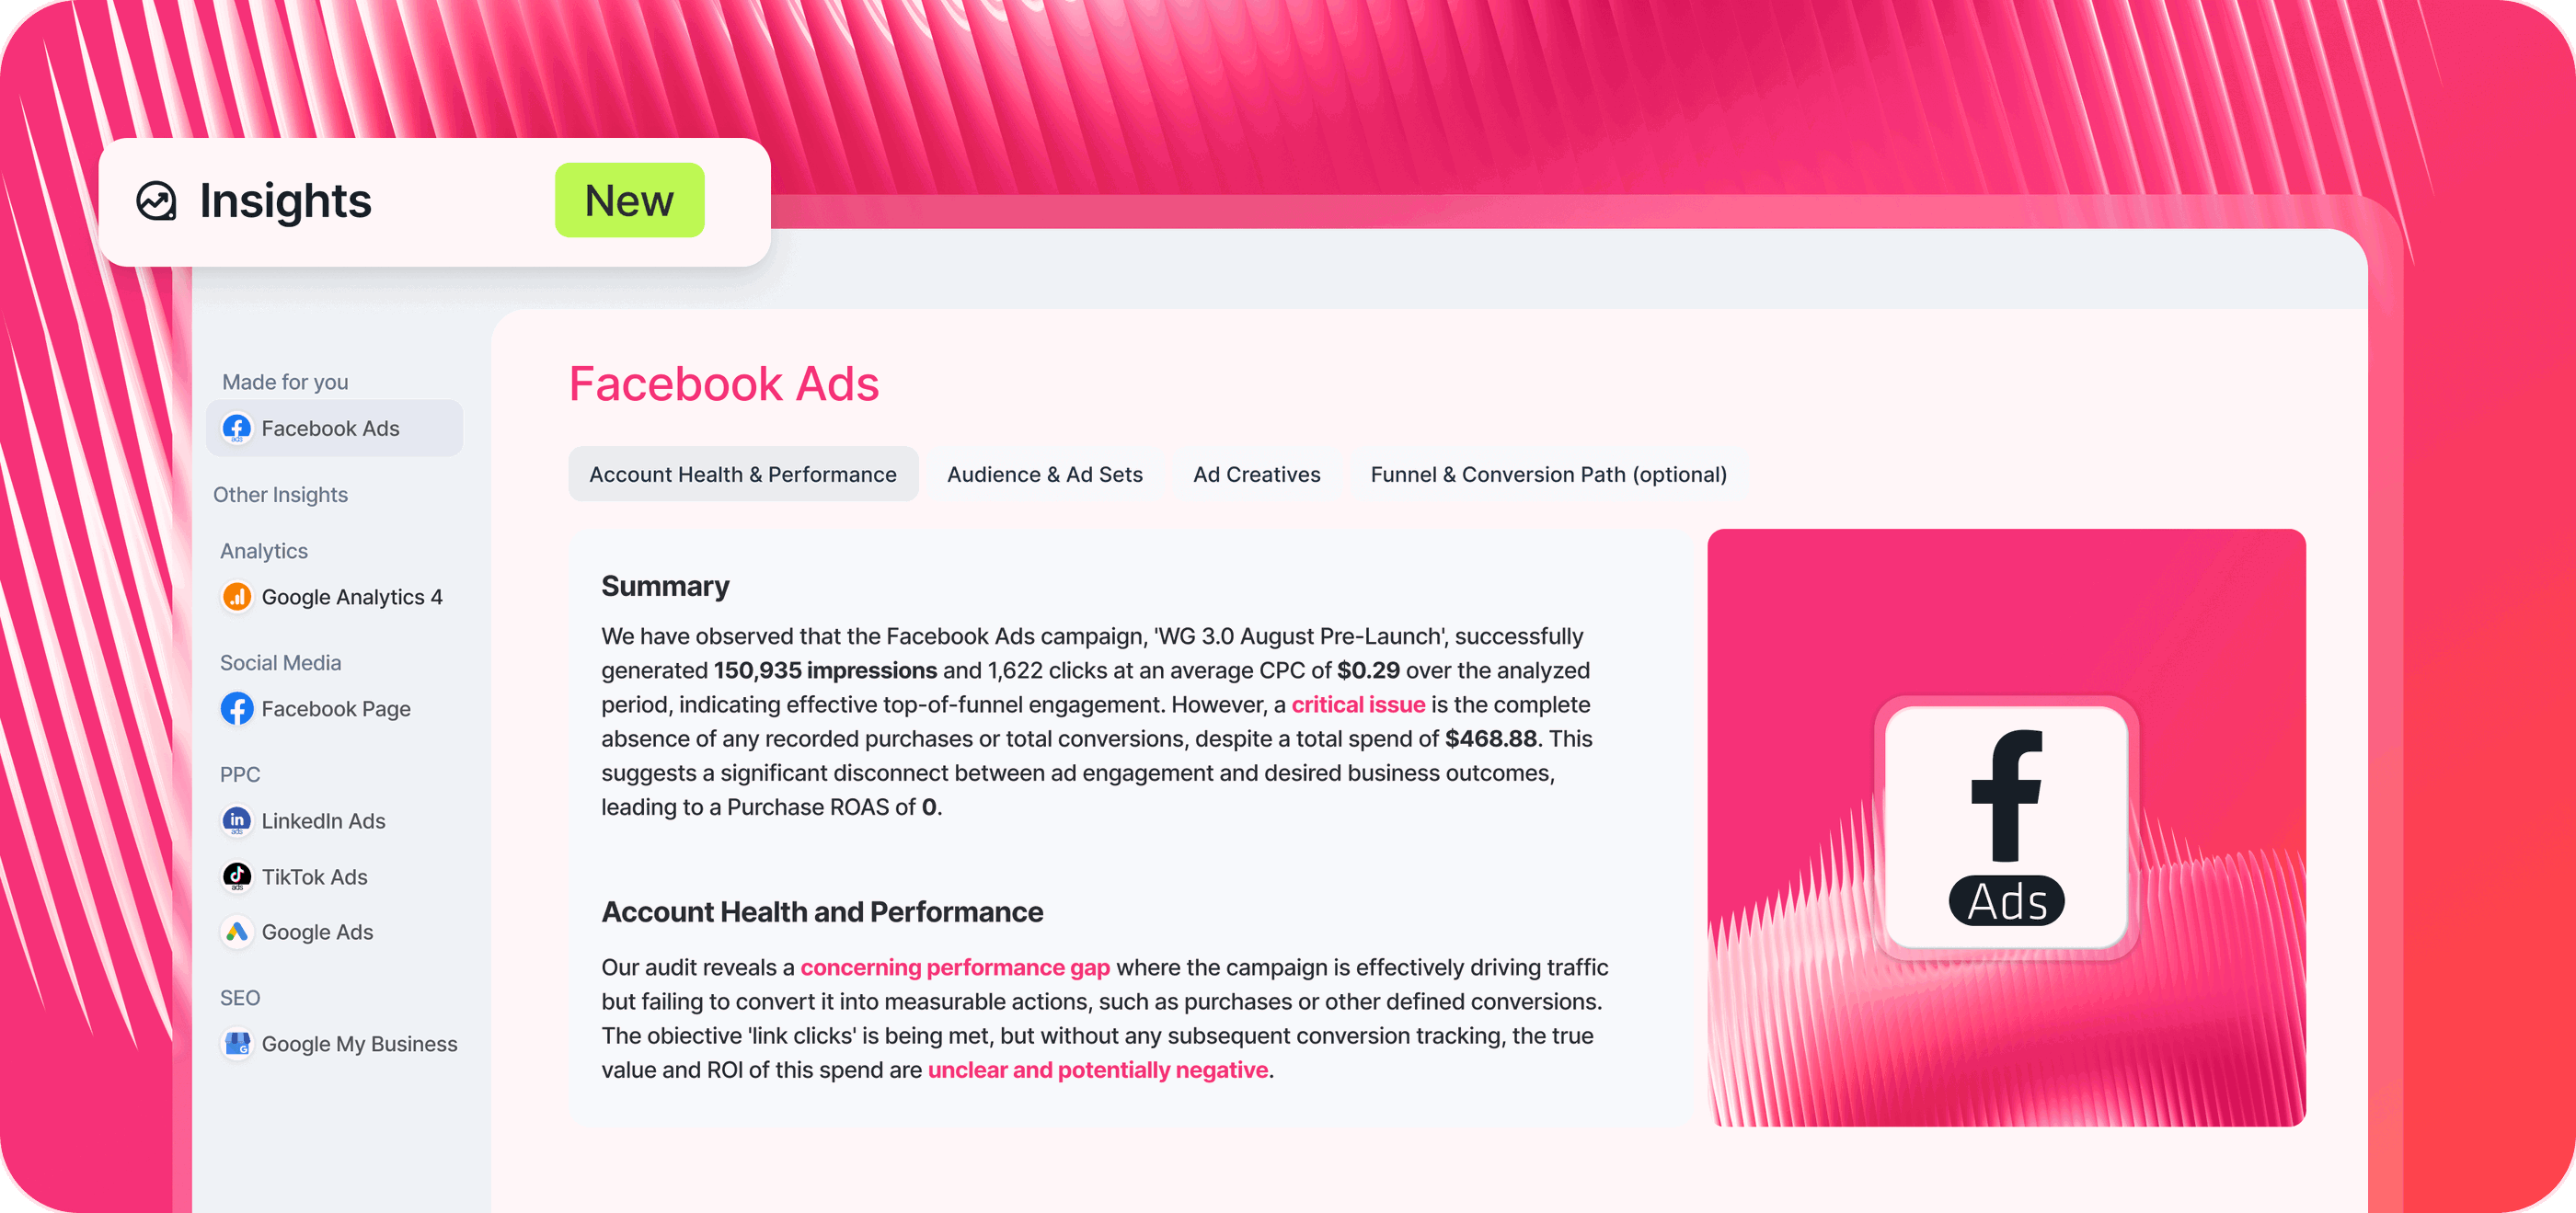
Another new AI feature André is excited about is AI Insights—a built-in audit tool that analyzes data from specific sources (like Facebook Ads) and highlights anomalies, issues, or unusual activity automatically.
Instead of manually digging through every data point, the team can instantly see account health across ad sets, audiences, creatives, and overall performance. This is especially valuable when onboarding new clients and trying to get a quick, accurate read on their accounts.
“This will be very useful when we have a new client and we have to analyze everything that we can possibly analyze,” André explained. “Having a place that highlights key account details makes our jobs easier—it’s almost like the analysis is done for us.”
Streamlining reporting process
Today, Wise Pirates’ reporting process runs like clockwork. Here’s how it works:
- Kickoff and discovery – The Project Manager meets with the client to understand business type, services, and reporting needs.
- Template setup – The right template is selected, data sources connected, and widgets customized.
- Folder management – André creates a client folder, adds the relevant sources, and assigns the Project Manager.
- Team collaboration – Specialists contribute insights from their domains (e.g., social media, Google Ads, paid social).
- Quality control & delivery – The Project Manager reviews for accuracy and consistency, aligns the team, and delivers the final report.
Together, these changes transformed Wise Pirates’ reporting into a centralized, efficient, and scalable system.
Whatagraph's AI Insights will be very useful when we have a new client and we have to analyze everything. Having a place that highlights key account details makes our jobs easier—it’s almost like the analysis is done for us.
Results
Templates ensure quality and consistency at scale
Managing 220+ folders and hundreds of reports for over 200 clients could easily turn chaotic. But Wise Pirates’ template system keeps everything consistent and efficient.
For most clients, building a report now takes just about two and a half hours with templates. More complex accounts take longer, but templates eliminate “blank-page syndrome” and give every Project Manager a solid starting point.
The template approach also makes sure every client—whether e-commerce, lead generation, SEO, or Amazon advertising—gets the same high standard of reporting.
Key metrics are always included, structures are consistent, and reports stay familiar month over month.
“Visually, the reports don't change too much so that the client is always familiar with the kind of reports that we present,” André noted. “It also makes it a lot easier to present results to clients.”
Strong client relationships through transparency and autonomy
For Wise Pirates, Whatagraph has become more than just a reporting tool—it’s a relationship builder with clients.
Instead of static PDFs, André shares live links to reports so clients can check performance anytime, filter dates, and dig into the numbers themselves. This transparency builds trust and can reduce churn.
“It’s great that we can share a live link to the dashboard with a client and the client can basically from their side change the dates and see specific numbers of a specific date," André explained. “That makes the client a bit more autonomous, which makes our work easier and helps us build better relationships with clients.”
The quality and transparency of Whatagraph reports have even become a key selling point in client pitches.
“This is a huge selling point for us as an agency, because the clients can trust that we are going to be super transparent with the numbers,” André shared. "If the numbers look good, we’re going to show that. If the numbers look bad, we’re also going to show that.”
Apart from this transparency, André also appreciates how Whatagraph’s reports add value to clients.
“Every client likes the reports and it is something where we can add value for the clients,” André noted. “Most clients see the reports as a good thing for the project.”
A strategic partnership, not just a software vendor
André also appreciates how Whatagraph is always developing new features and finetuning existing ones to make his team’s job easier.
“It's always better to have a partner that is trying to improve themselves than a partner that is standing still,” André noted. “Even if new features aren’t perfect immediately, we can see them improving from the beta stage, and that’s amazing.”
Instead of a static platform, Wise Pirates get access to new capabilities that steadily get smarter and more useful over time, proving that Whatagraph isn’t just a software vendor, but a strategic business partner that actually cares.
Behind the scenes, André’s also appreciates how responsive and friendly our Customer Support team is.
“I talk with someone from Whatagraph at least three times a week. You are almost always really, really quick to answer me, and I appreciate that.”
With average response times of just 5–10 minutes, plus opportunities to beta test new features, André sees the relationship as a true collaboration—one where his feedback directly shapes the platform his agency relies on.
André’s recommendation
When asked if he'd recommend Whatagraph to other agencies, André's response was immediate and enthusiastic:
“Yes, definitely! Whatagraph really is a great platform for building reports especially for agencies with fewer people and little technical knowledge. It's simple to use, it's intuitive, so even those without tech expertise can start using Whatagraph and start getting insights right away.”
Whatagraph is simple to use, intuitive, and even those without tech expertise can start getting insights right away.”