Track key metrics of all clients, campaigns, or team members in one dashboard
Bring data from multiple channels, campaigns, locations in one Overview. With automated goals, Whatagraph ensures you stay informed, in control, and ahead of the curve.


All the data for internal monitoring in an overview that's easy to create and customize
It's a single dashboard with any metrics from any of your marketing reports
In Whatagraph reports are organized and stored in folders. You decided what those are. Clients, locations, channels, campaigns, websites, account managers.
The Overview brings key metrics from those categories in one organized report, highlights targets, limits, and progress. And it's fully customizable.
How others leverage Overviews in their marketing day-to-day
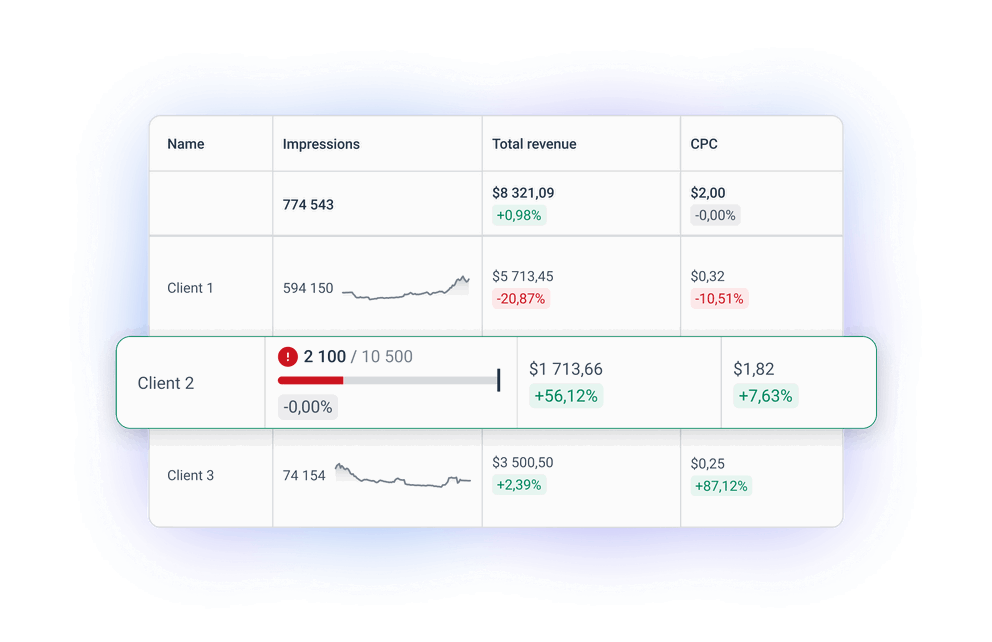
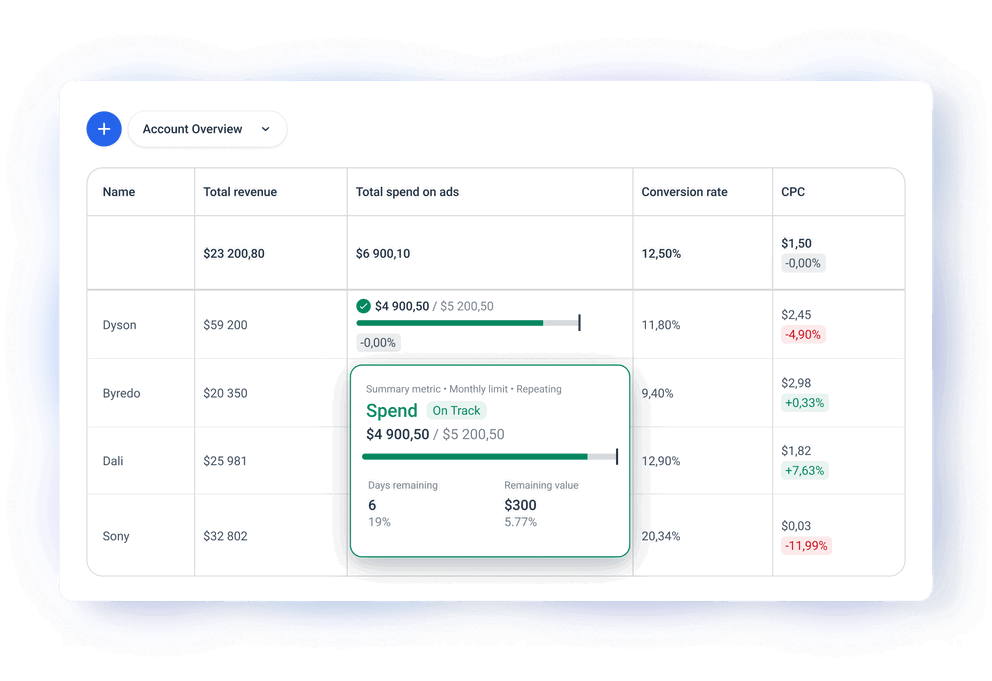
Track targets and limits for multiple clients
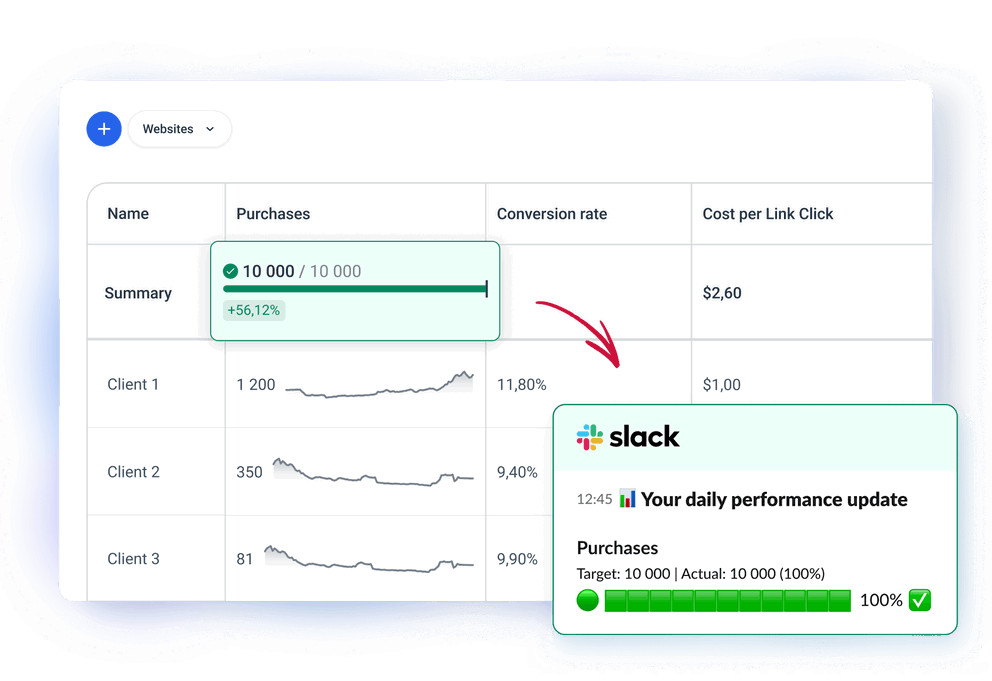
Set budget limits on ad spending and CPC. Create goals for the number of followers or website visitors. Create multiple overviews with targets and limits for websites, social media, e-commerce, or apps. Receive Email or Slack alerts about your performance.
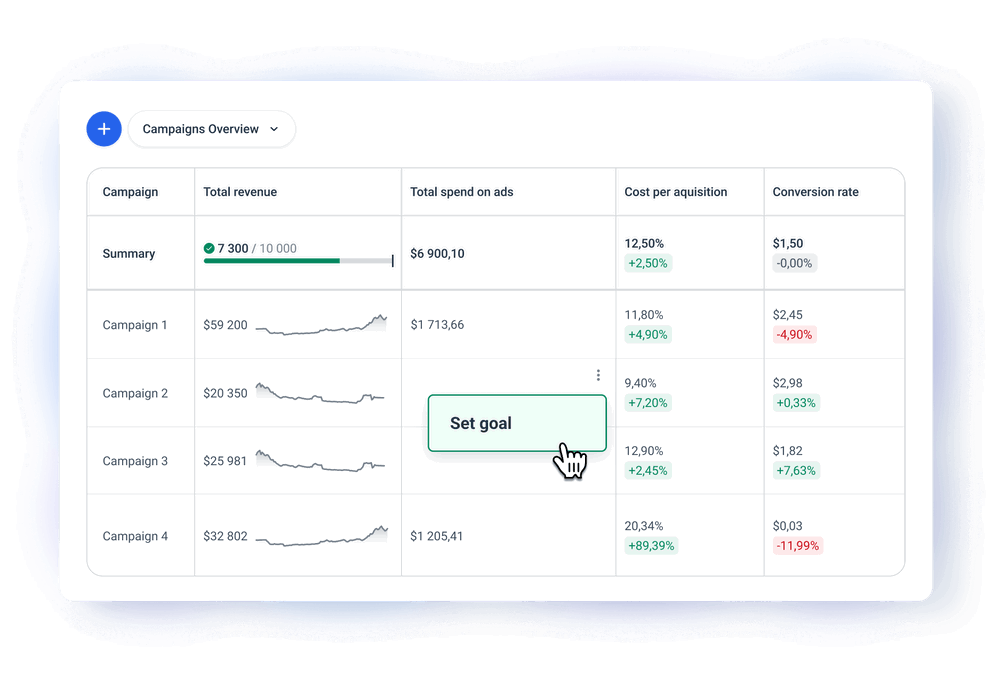
Use the Overview insights to optimize running campaigns
A bird's eye view of top-performing and underperforming campaigns instead of jumping between Meta's Ads Manager, LinkedIn Ads Manager, and other platforms to get the data.
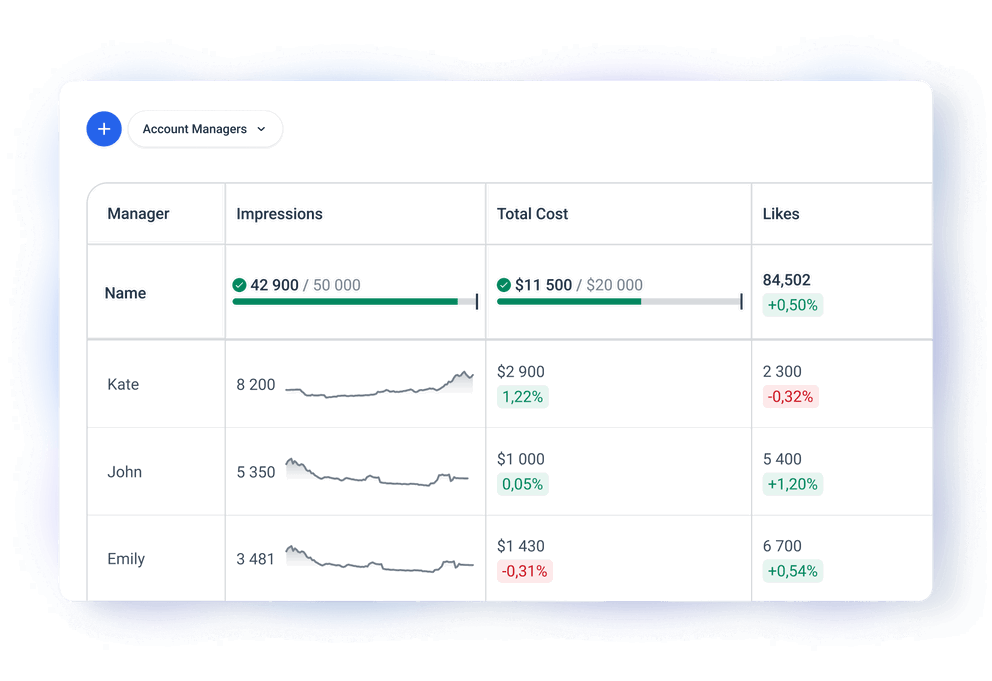
Track performance of your account managers
Create a dashboard where each account manager have their current performance on display. See who needs attention instantly.
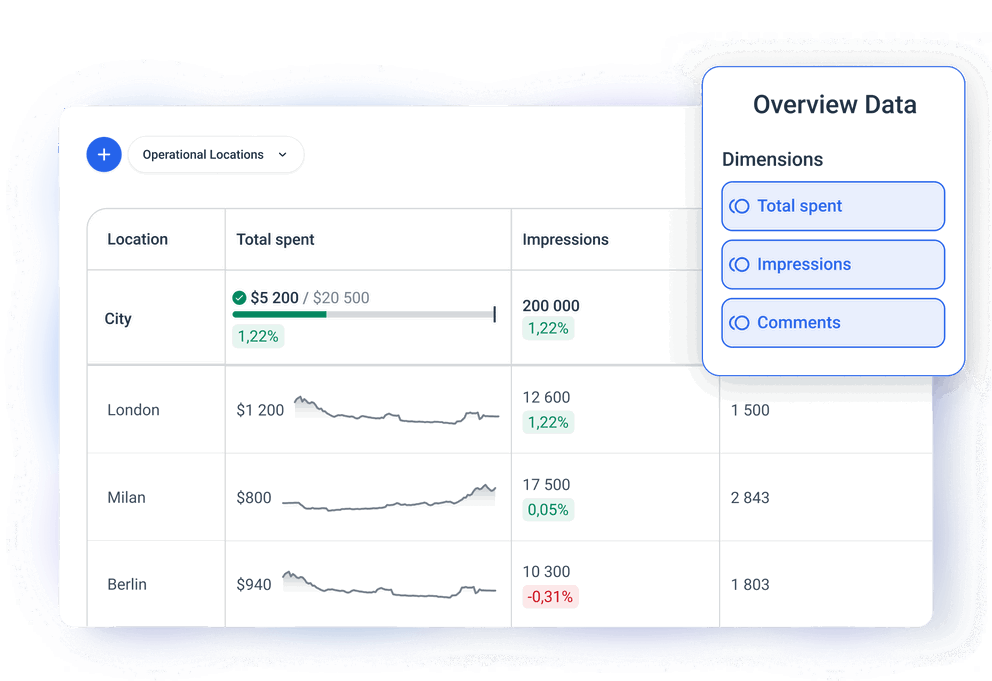
Track multiple operational locations
For brands operating in different locations across the globe, with each country or region having its own Ads accounts. Take a holistic view of all locations at once.
What others think about Whatagraph
I made a switch from GDS and Sheets for reporting to Whatagraph, and I am saving literal hours each week on performance report creation. Our small firm actually managed to onboard 2 new clients as a result of all the time we saved on managing data and reporting. The customer service is also really helpful and easy to reach.

Capterra verified review by
Mindaugas S., Marketing Consultant
Having active customer support to help fix any issues was a big contributor, but we also really liked the ability to save templates and connect sources to multiple charts/widgets at once without having to edit them individually. And having the grid layout is much easier to stay consistent with than the free form setup that Data Studio has.

Capterra verified review by
Nico T., Media Planner
The system has standard templates that are easy and fast to use. Also you can build your own report with lightning speed. It is very easy to use, has a lot of integration, and let get started very fast.

Capterra verified review by
Rasmus Bernt K., External Senior Management Consultant
We love Whatagraph - we would definitely recommend and our account manager is great! I love how easy this tool is to use, everyone on the team finds it much more user-friendly than other dashboards. Integration was easy, we sent some example reports to the team who duplicated these for us. We literally had to log in and send it to our clients!

Capterra verified review by
Stephanie S., Digital Director
We are showing our clients the work that we're doing for them and this is incredibly important for our clients ROI. They want to see results and having a tool like Whatagraph that can show data from virtually every source we use is hugely important.

Capterra verified review by
John S., SEO Strategist
The tool is easy to use; you do not need to have development resources. Even my junior project managers are capable of making campaign reports in minutes. There are a lot of pre-made templates you can use as well as many pre-made widgets.

Capterra verified review by
Erman E., Marketing Specialist
Really easy to connect data sources within the tool. The library of report templates has been helpful. The customer support team has been responsive to all of our needs. Our team enjoys the simplicity of setting up the reports and how the data is presented.

Capterra verified review by
Brent N., Director of Operations
Easy to create really beautiful graphs and reports which can help other team members to understand the most important takeaways. I especially like the automated report function, so I don't have to check on the same thing repeatedly.

Capterra verified review by
Orsolya S., Online Marketing Manager
Read more reviews on:


Built for marketing professionals like you: