
What This Real Estate Marketing Report Sample Includes
This real estate marketing report sample shows how agencies and in-house teams present performance in a way real estate professionals actually understand.
Instead of abstract digital metrics, the sample focuses on valuable information tied to leads, inquiries, and activity in the local market, helping stakeholders quickly see what’s working and why.
Below is a walkthrough of what’s included in the sample report and how each section supports clearer communication, stronger marketing strategy, and better decision-making.
1. Real Estate Marketing Summary
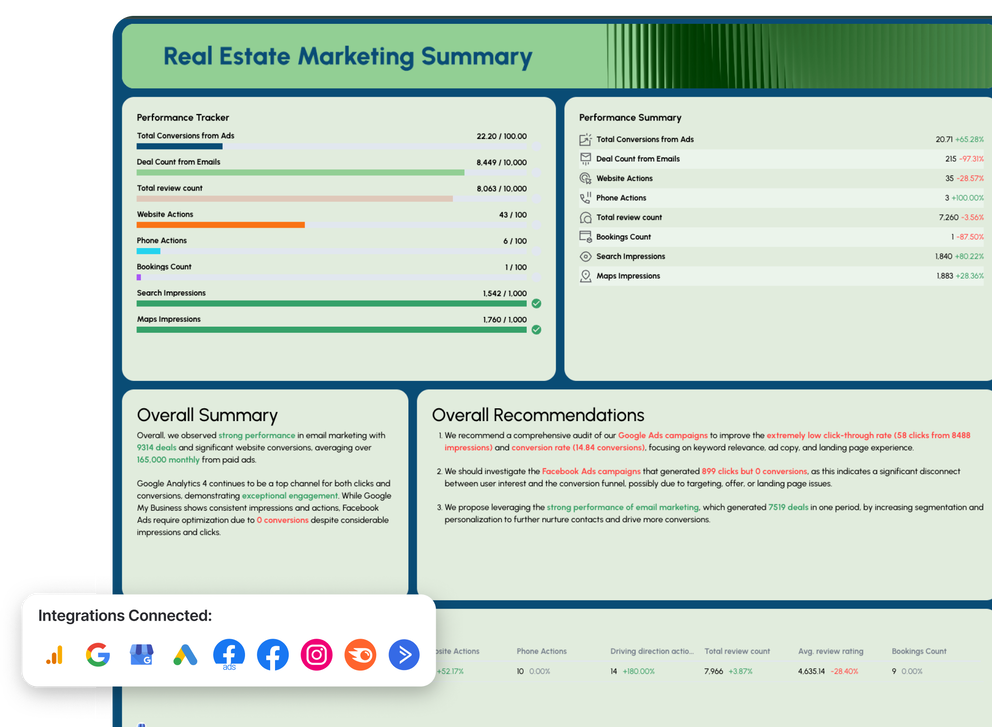
 This opening section shows how all marketing efforts come together. It’s designed so real estate agents, brokers, and owners can understand performance immediately—before diving into channel details.
What you’ll see in the sample:
- High-level key metrics like total leads, conversion rate, and inquiries
- Month-over-month and 12-month trends across key activities
- A consolidated dashboard view of performance across channels
- Top KPIs tied to lead generation and listing visibility
- Clear written takeaways that summarize what changed and what to focus on next
This section helps build trust by making performance easy to follow at a glance.
2. Google My Business Performance

This part of the sample highlights how local discovery supports visibility for a real estate business, especially for brokerages competing in specific neighborhoods.
What you’ll see in the sample:
- Search and map impressions over time
- Website actions, phone calls, and direction requests
- User reviews and review activity by day
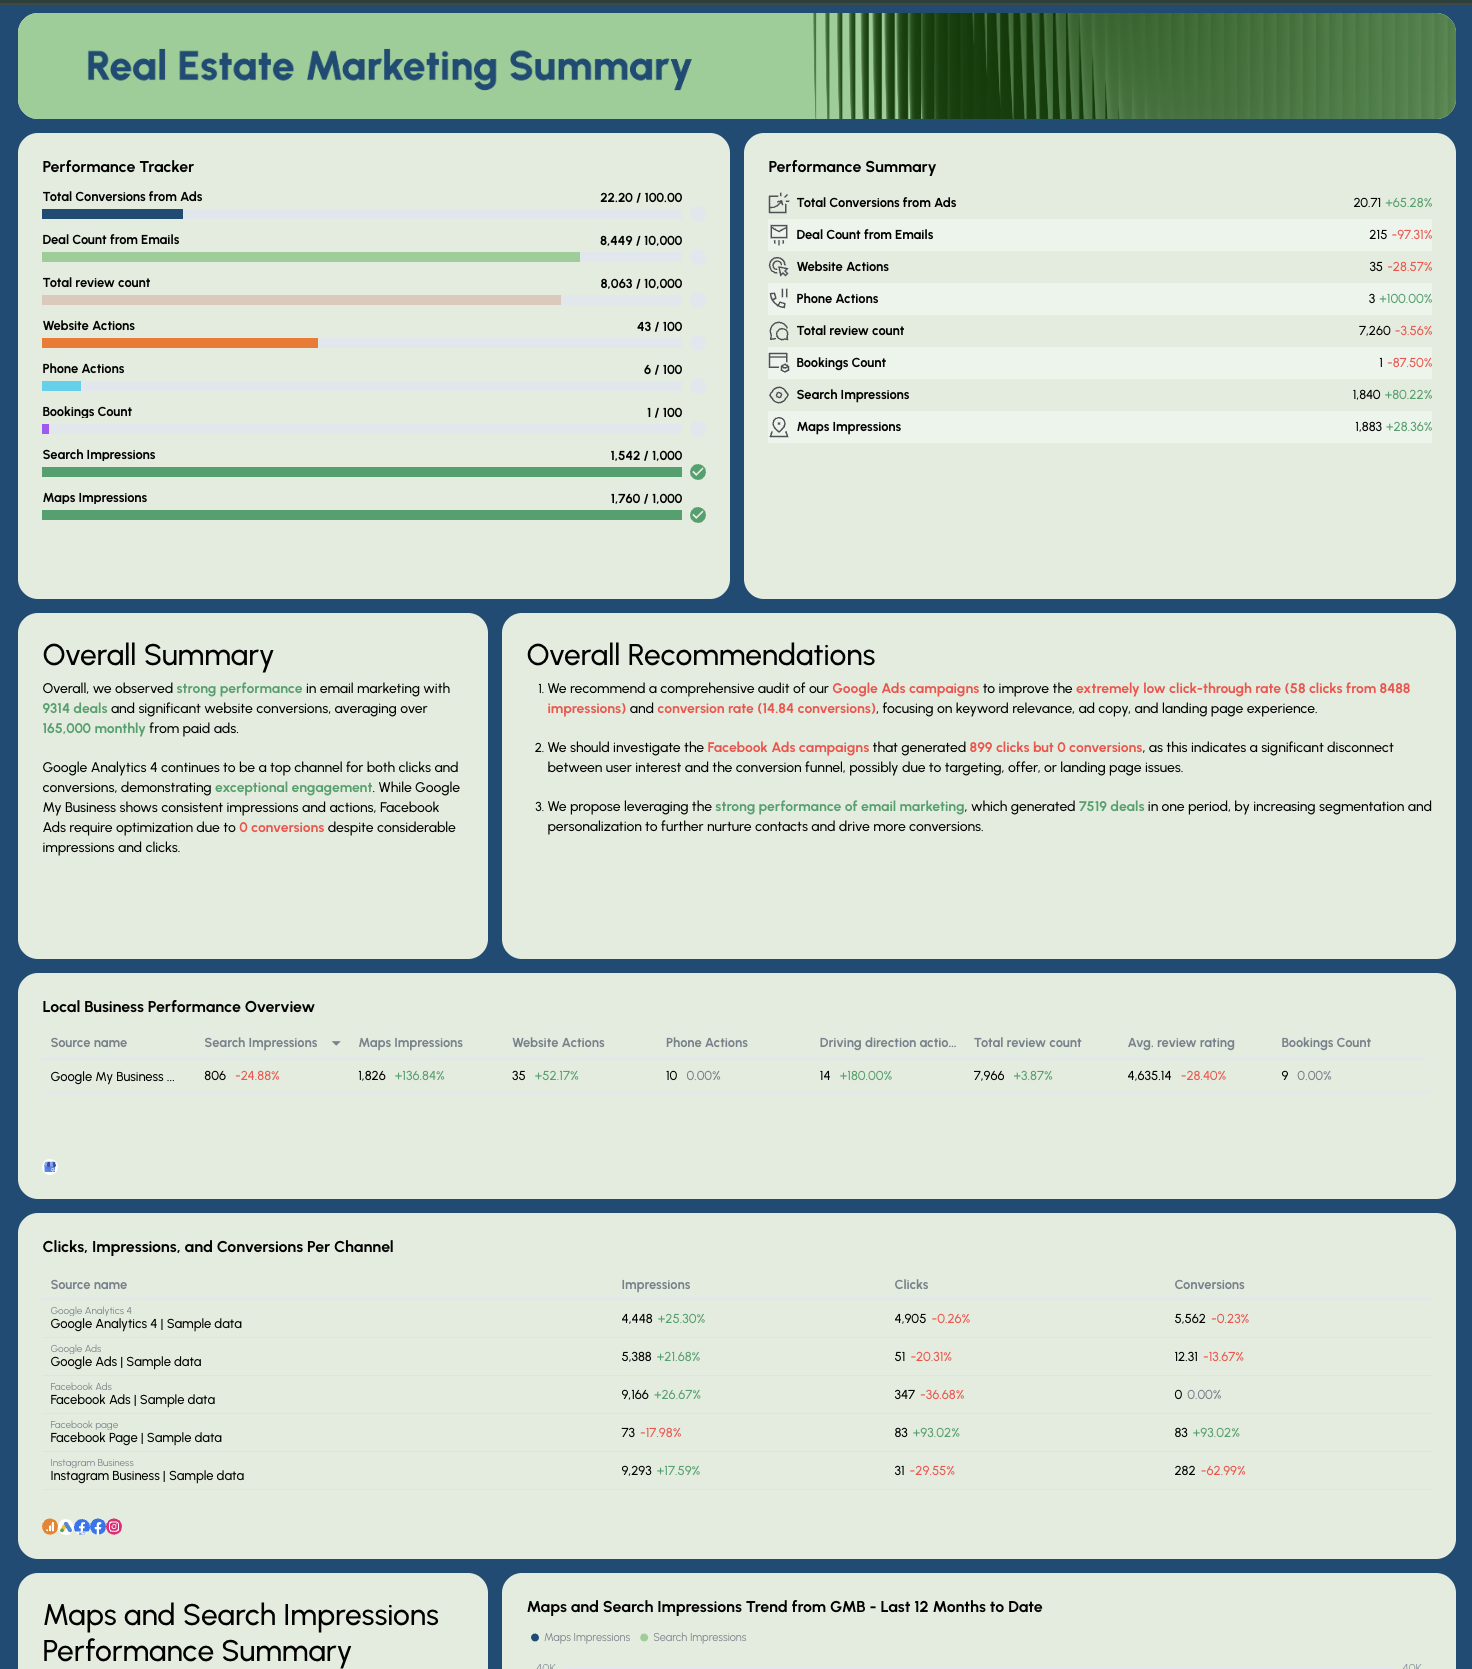
3. SEO Performance
The SEO section shows how organic traffic contributes to long-term growth and listing exposure within the real estate industry.
What you’ll see in the sample:
- Organic sessions and page views on your real estate website
- Form submissions and inquiry events
- Keyword rankings and top performing pages
- Traffic trends tied to content marketing efforts
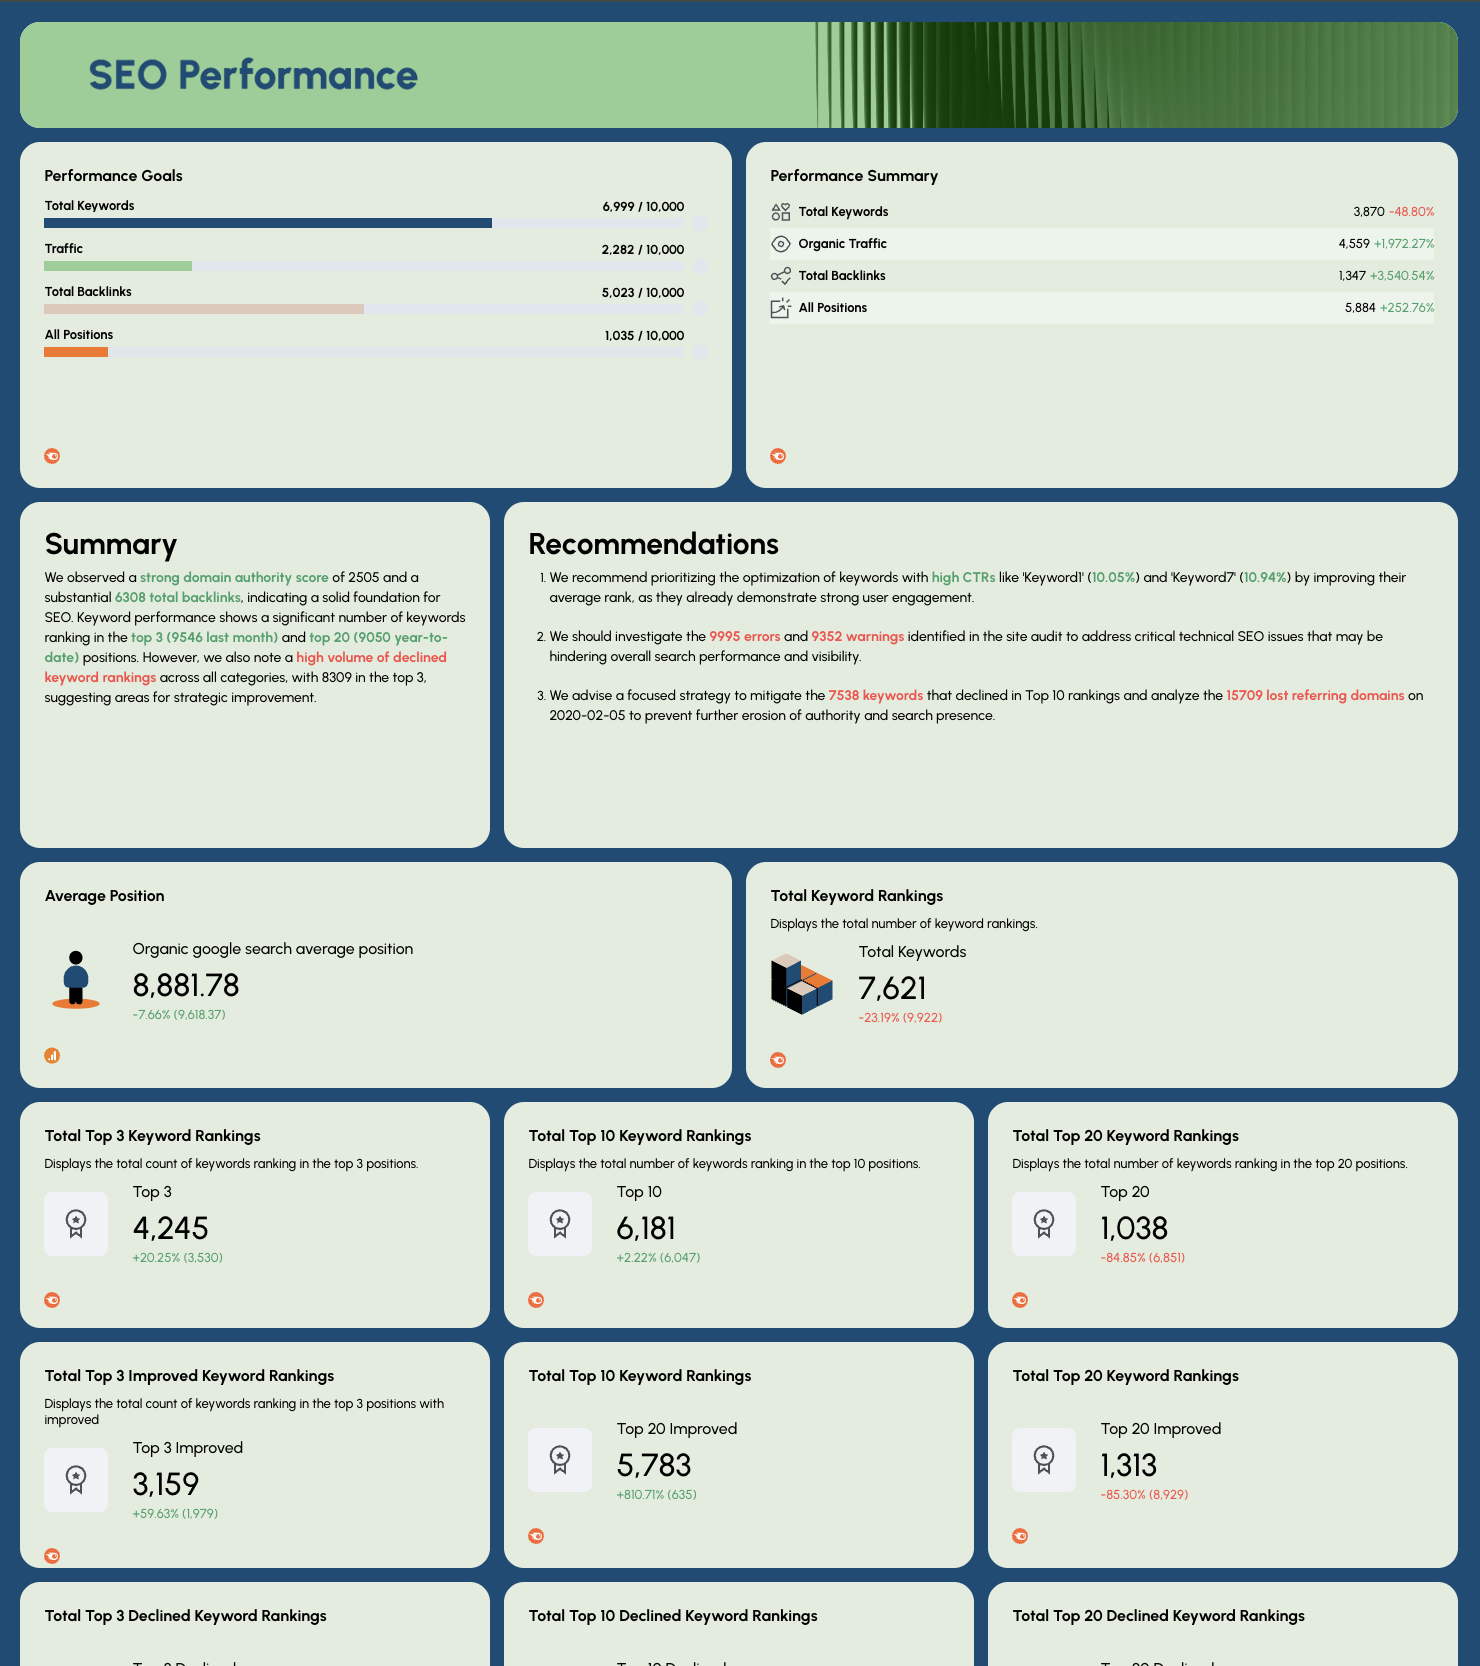
4. Google Ads Performance
This section illustrates how paid search captures high-intent demand from potential buyers and sellers.
What you’ll see in the sample:
- Ad spend, clicks, and lead volume
- Conversion rate by Google Ads campaign
- Performance by keyword theme (e.g. location or intent)
- Trends comparing spend vs conversions over time
- Carousels showing top performing Google Ads creatives
5. Facebook Ads Performance
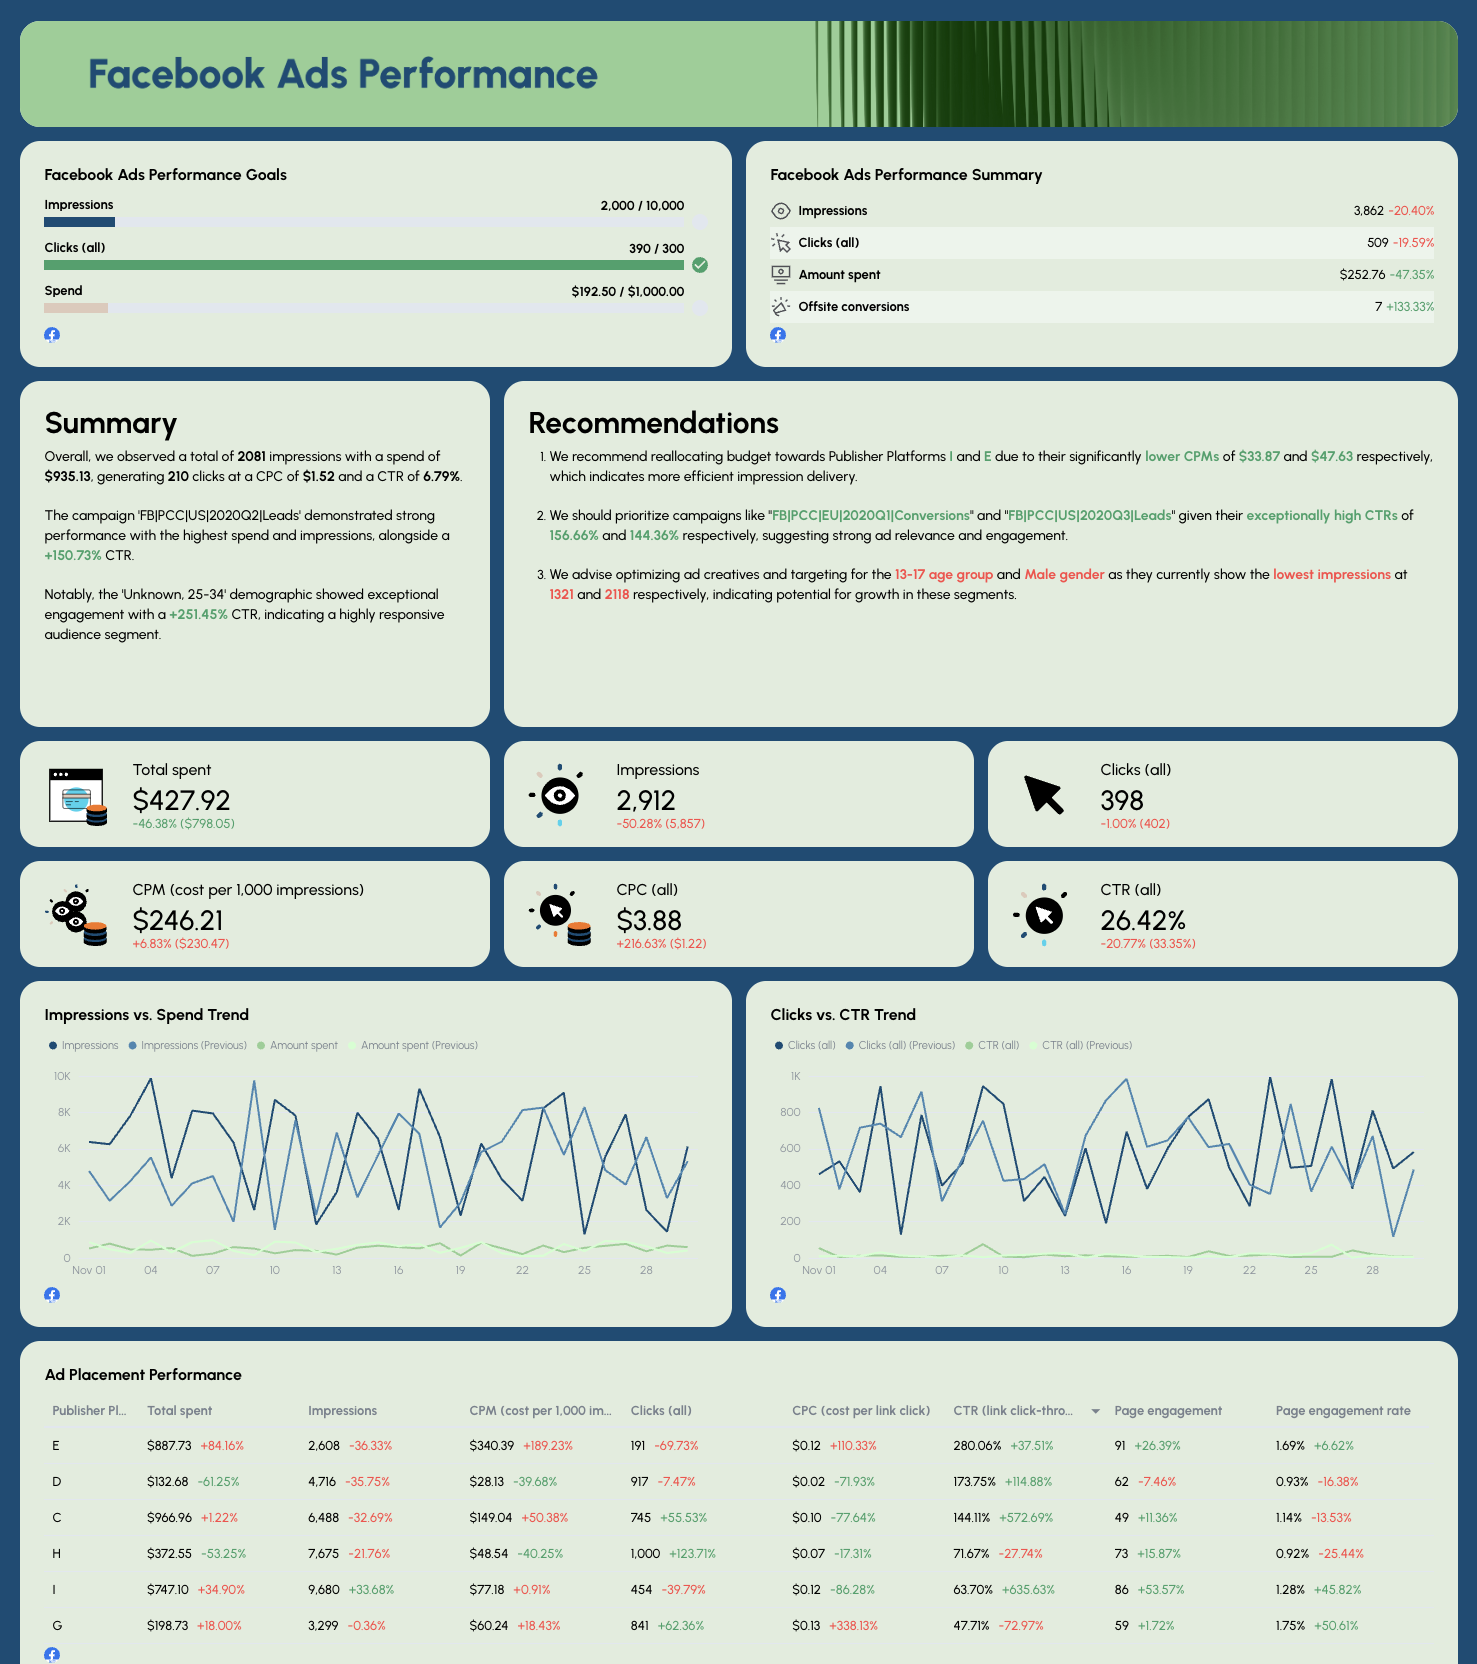
Here, the sample demonstrates how paid social marketing campaigns support awareness, engagement, and lead capture for listings and developments.
What you’ll see in the sample:
- Reach, impressions, and leads from ads
- Engagement trends by campaign
- Performance tied to property marketing goals
- Insights into which Facebook Ads creatives resonate with the target audience
6. Organic Social Media (Facebook & Instagram)
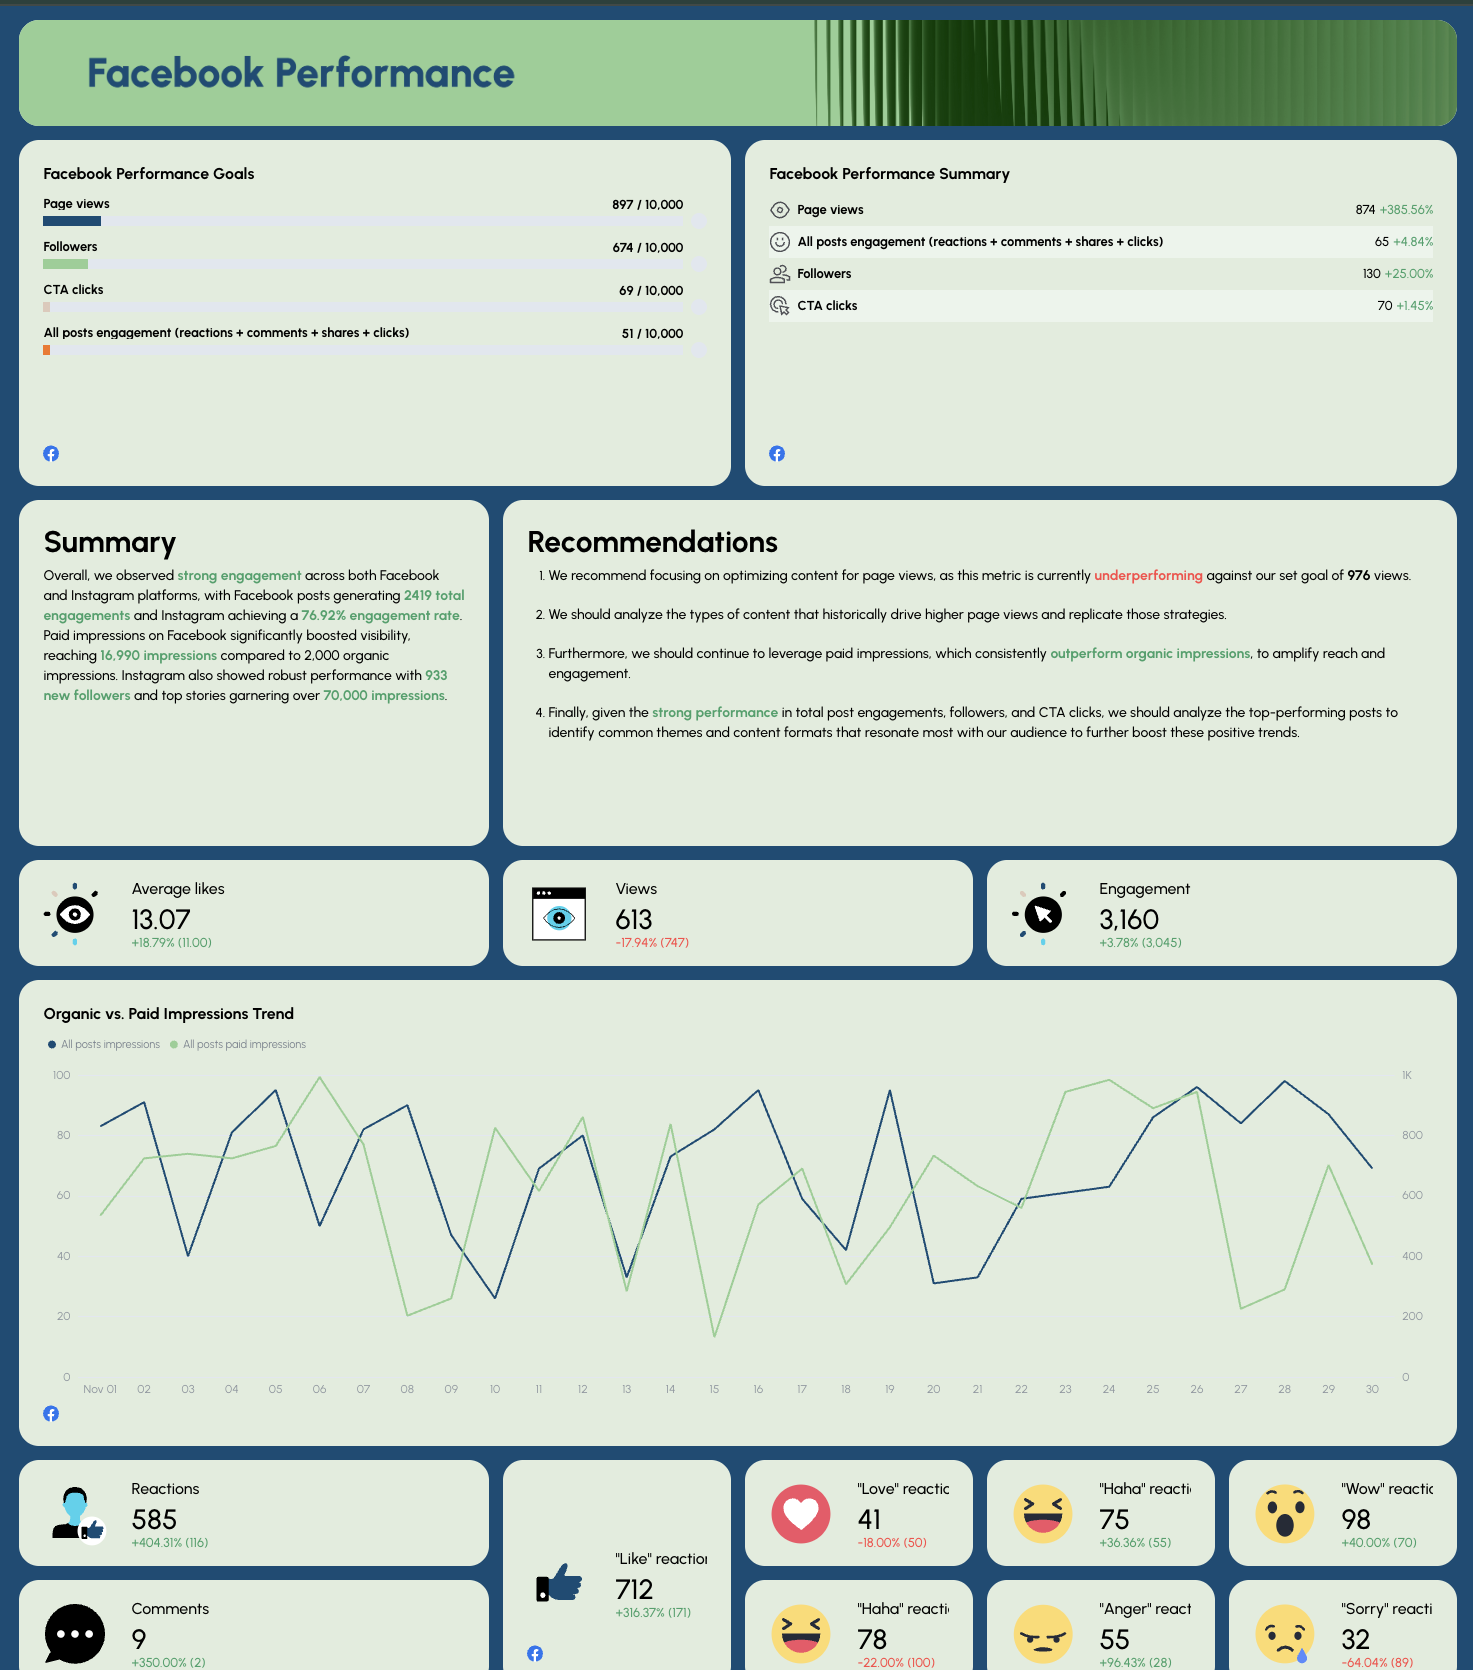
This section shows how unpaid social media activity contributes to visibility, engagement, and trust.
What you’ll see in the sample:
- Follower growth and engagement trends
- Performance of posts promoting listings and market updates
- Carousels showing top performing Facebook and Instagram posts, stories, and reels
7. Email Marketing
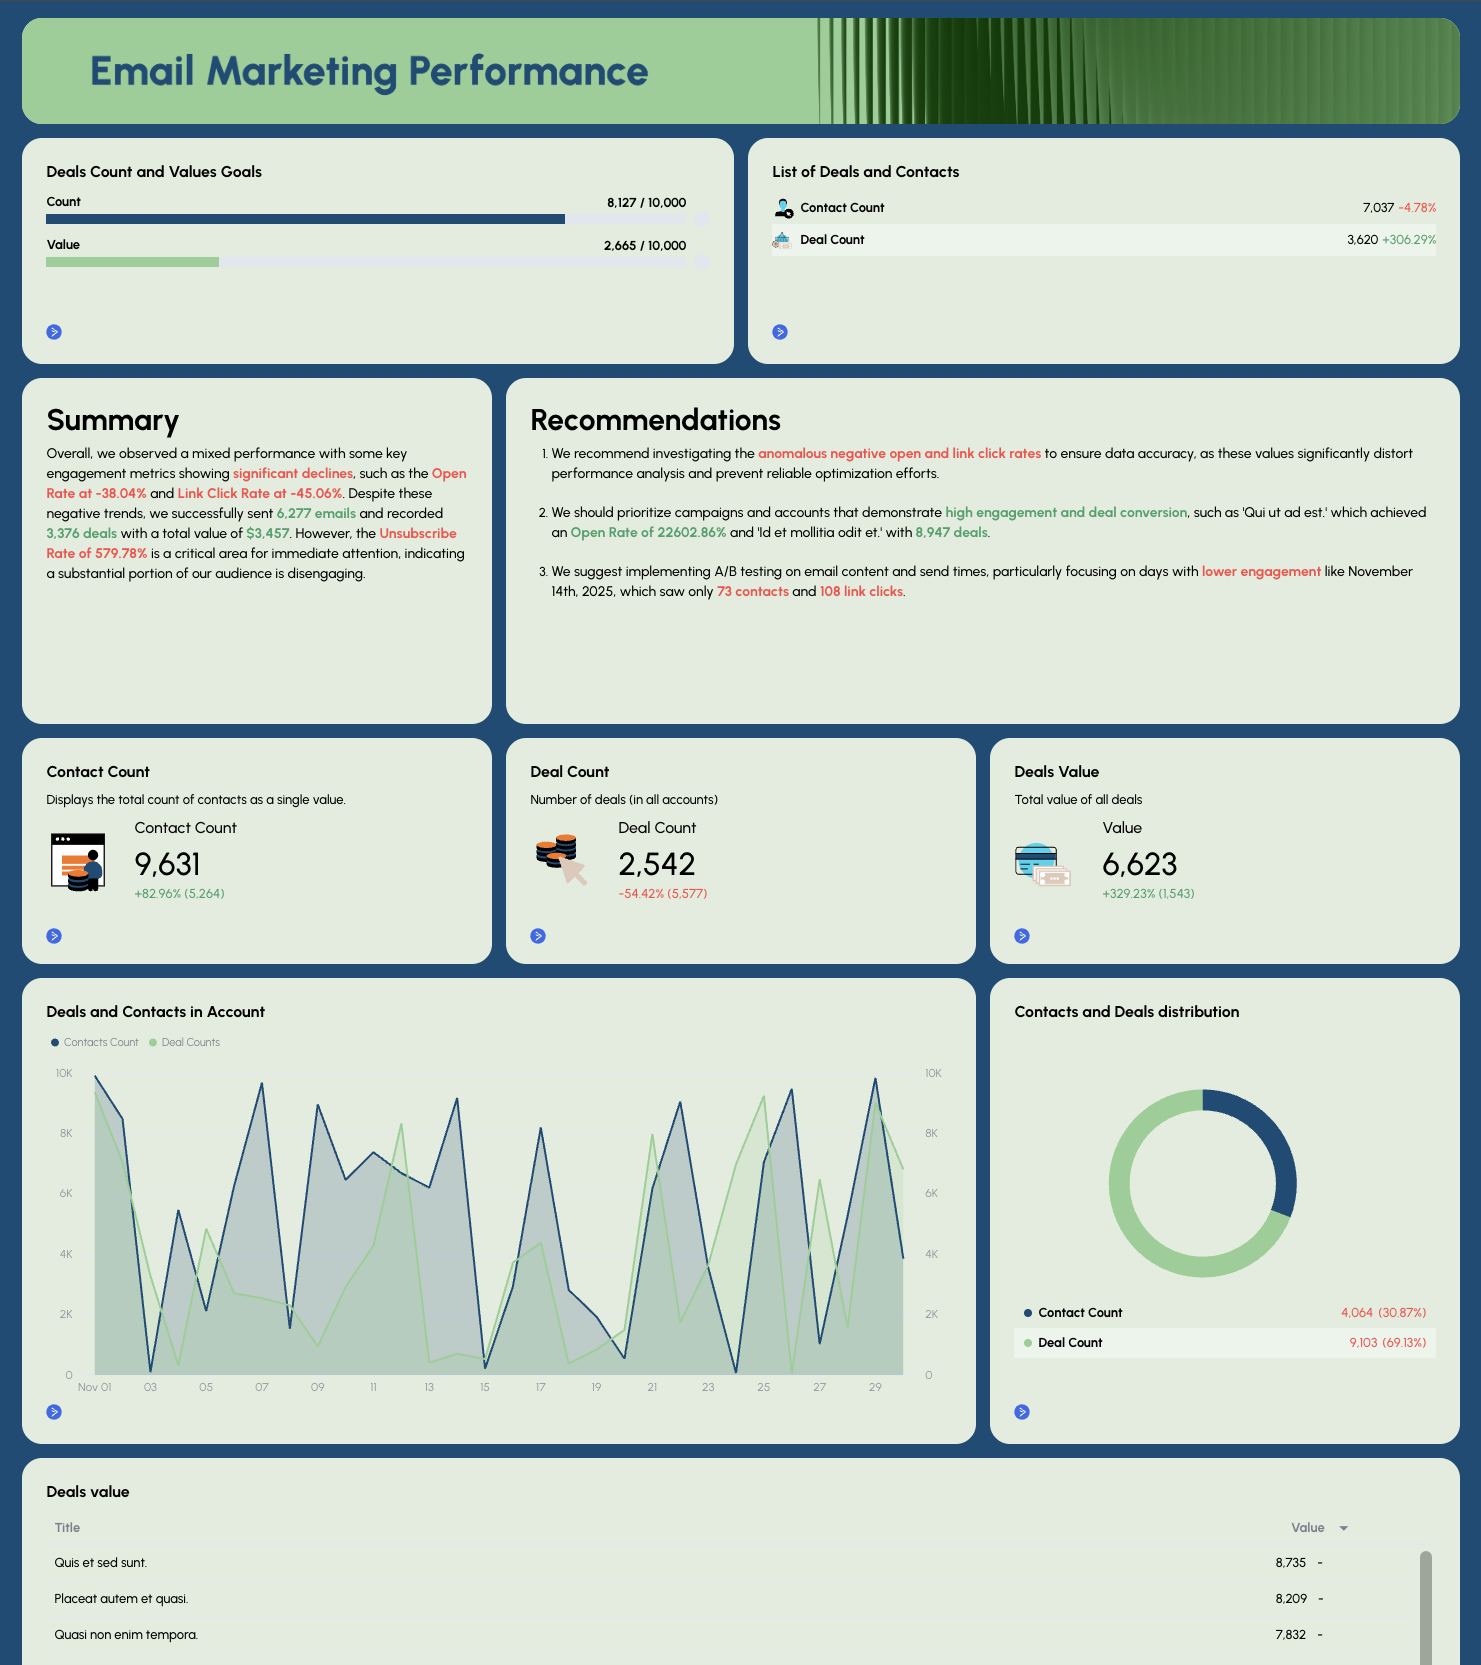
The email section demonstrates how nurture campaigns support longer sales cycles common in real estate. With tools like ActiveCampaign, you can tie back email marketing campaigns to deals closed.
What you’ll see in the sample:
- Sends, opens, and clicks from email marketing campaigns
- Inquiries driven by listing alerts and follow-ups
- Engagement trends over time
- How email supports ongoing lead generation


