


What is an ActiveCampaign reporting tool?
An ActiveCampaign reporting tool helps you pull your email marketing data out of ActiveCampaign and turn it into clear, structured reports - without the manual work.
ActiveCampaign has built-in analytics, and they're genuinely useful for checking campaign-level metrics.
But the moment you need to show a client how their email performance connects to their paid ads, their website traffic, or their revenue, you've hit a wall. The data lives in different places, and stitching it together takes time most teams don't have.
That's where a dedicated email analytics tool comes in. Instead of jumping between ActiveCampaign, Google Ads Manager, Meta, and a spreadsheet, you get one unified view that tells the complete story.
ActiveCampaign is proven to drive results. Over two-thirds of users (67%) report seeing ROI within six months, and 83% within the first year. But getting to those results - and being able to clearly show them to clients or stakeholders - depends heavily on how well you handle your email campaign reporting.
A good ActiveCampaign analytics tool takes the pressure off your team:
- Connects to ActiveCampaign and pulls campaign, contact, and automation data automatically
- Combines that data with other marketing channels for a full cross-channel picture
- Structures and visualizes metrics in a way that clients can actually follow
- Let's you white-label reports with your branding, not a generic dashboard
Whatagraph has also launched an MCP that lets you connect your data to Claude or ChatGPT and analyze your data there.
With Whatagraph, you get all of this. And with Whatagraph IQ, the process gets even faster.
Rather than assembling reports piece by piece, your team can:
- Type a prompt and get a full report built instantly, with charts, tabs, and metrics already in place
- Upload a client's logo or brand assets and let IQ apply the right colors and fonts automatically
- Generate written performance summaries pulled directly from your live data - no writing from scratch
- Ask IQ Chat a direct question about your ActiveCampaign data and get an instant answer, without digging through dashboards
We've also recently released an MCP that lets you connect your ActiveCampaign data to Claude or ChatGPT and analyze your data.
The result is less time spent on repetitive reporting tasks and more time spent on the work that actually moves the needle.
Uptick Marketing saw this firsthand. After switching to Whatagraph, their monthly reporting time dropped from 60 hours down to just 10 to 20 hours.
Whatagraph replaced our old reporting tool and internal spreadsheets we were using. It aggregates the data, transforms it, and displays it in comprehensive visuals. - Matt Spivak, Marketing Consultant at UpTick Marketing
What are the best ActiveCampaign reporting tools?
ActiveCampaign works well as an email and marketing automation platform - but when it comes to reporting, most teams quickly realize they need something more.
Here are five tools worth considering, and what each one is actually good at.
1. Whatagraph - best ActiveCampaign reporting tool for agencies and marketing teams
Whatagraph is an all-in-one marketing intelligence platform built for teams that need to report on multiple channels without building a data engineering stack to do it.
Connect your ActiveCampaign account alongside Google Ads, Meta, Shopify, HubSpot, and 60+ other sources, and your data flows directly into your reports - accurately, automatically, and without third-party connectors getting in the way.
Here's what you get:
- 60+ native integrations covering email, paid, social, SEO, e-commerce, and CRM platforms (e.g, Salesforce & Hubspot)
- Cross-channel reporting that blends ActiveCampaign data with the rest of your marketing stack in one unified view
- Whatagraph IQ: a full suite of AI features to build, brand, and analyze reports without manual setup
- Custom metrics and data blends you can create by asking AI - no formulas, no code
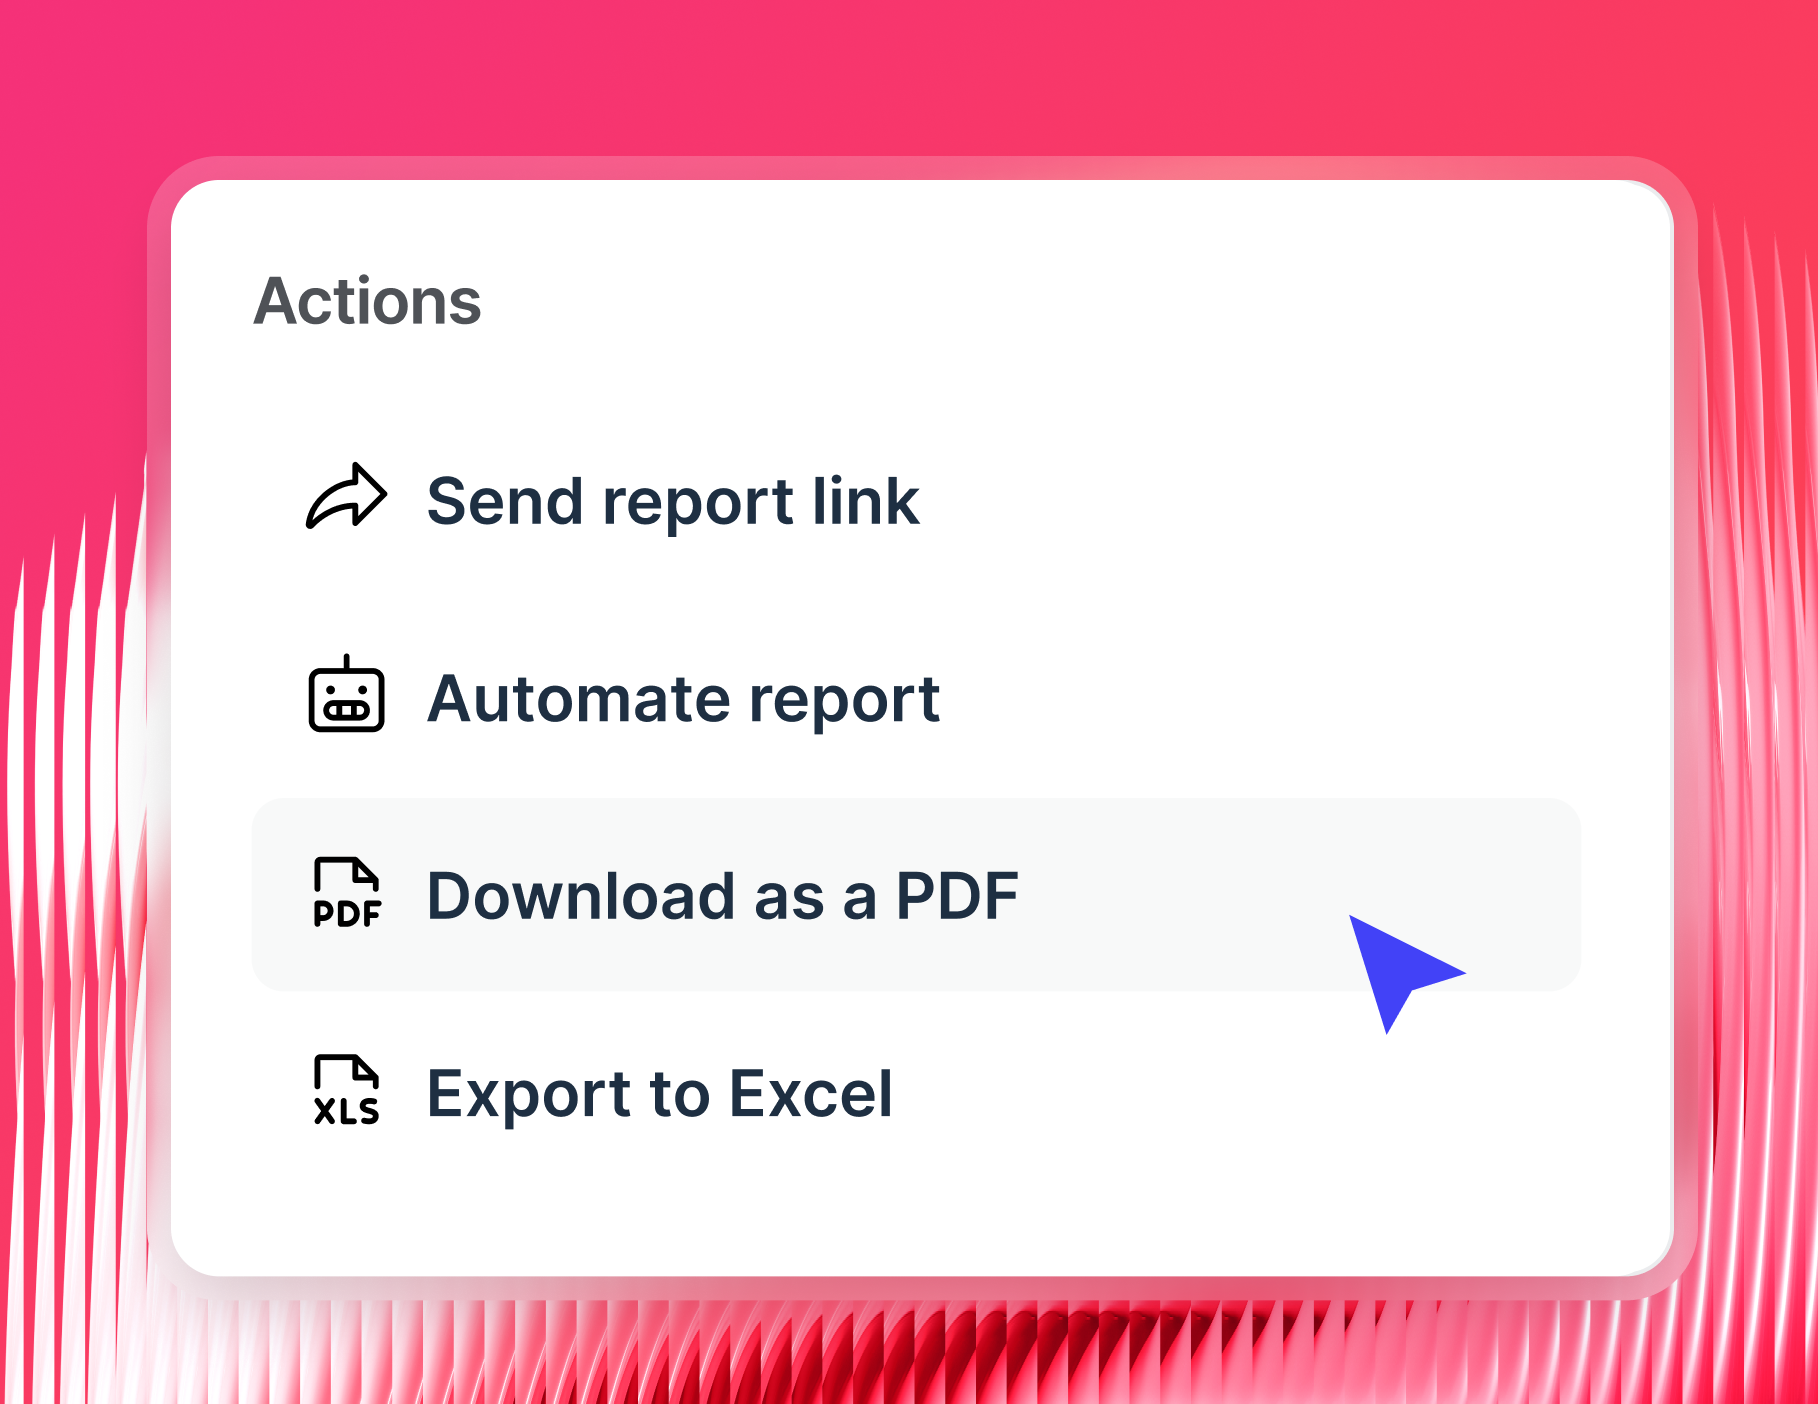
- Automated report delivery via email, Slack, live links, PDF, or CSV
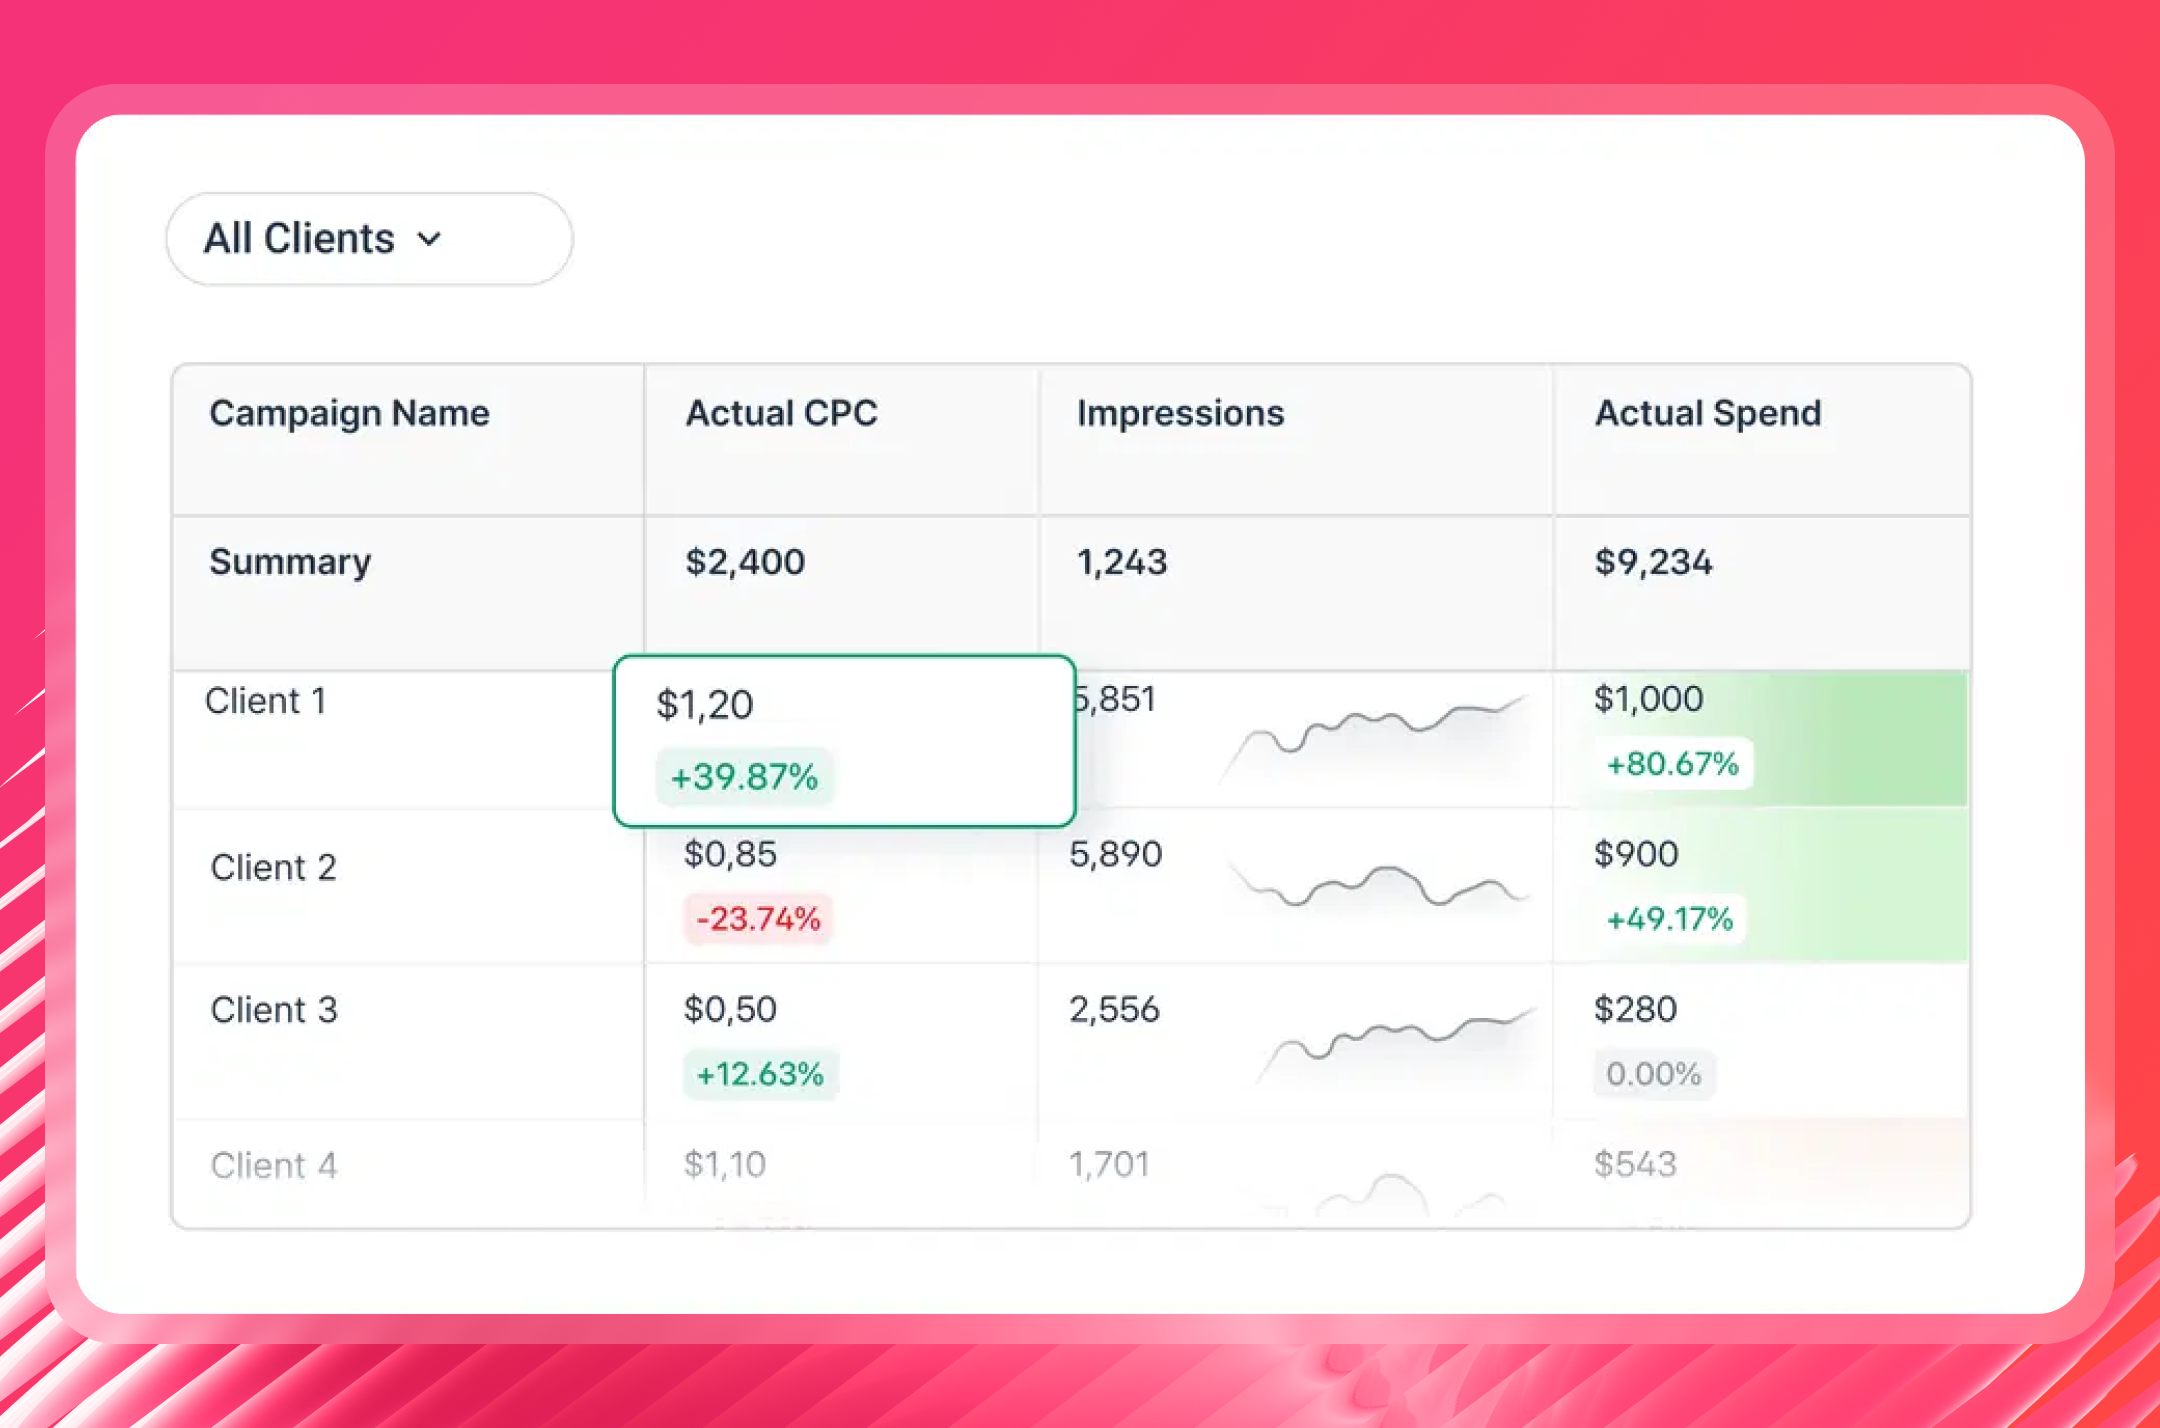
And for teams managing multiple clients, Whatagraph's Overview gives your team a single place to monitor all accounts at a glance.
The overview is the easiest for our internal way of working. Our Account Managers don’t have to ask me for KPIs anymore—they just grab the link and send it to the client quickly without my help. It’s just quicker and easier. - Tanja Keglić, Performance Marketing Manager at Achtzehn Grad
With Whatagraph IQ, you're not assembling custom reports from scratch. Instead, you can:
1. Build full reports from a prompt. Simply describe what you need, and IQ generates the entire report - tabs, charts, KPI widgets, and all. No drag-and-drop required.
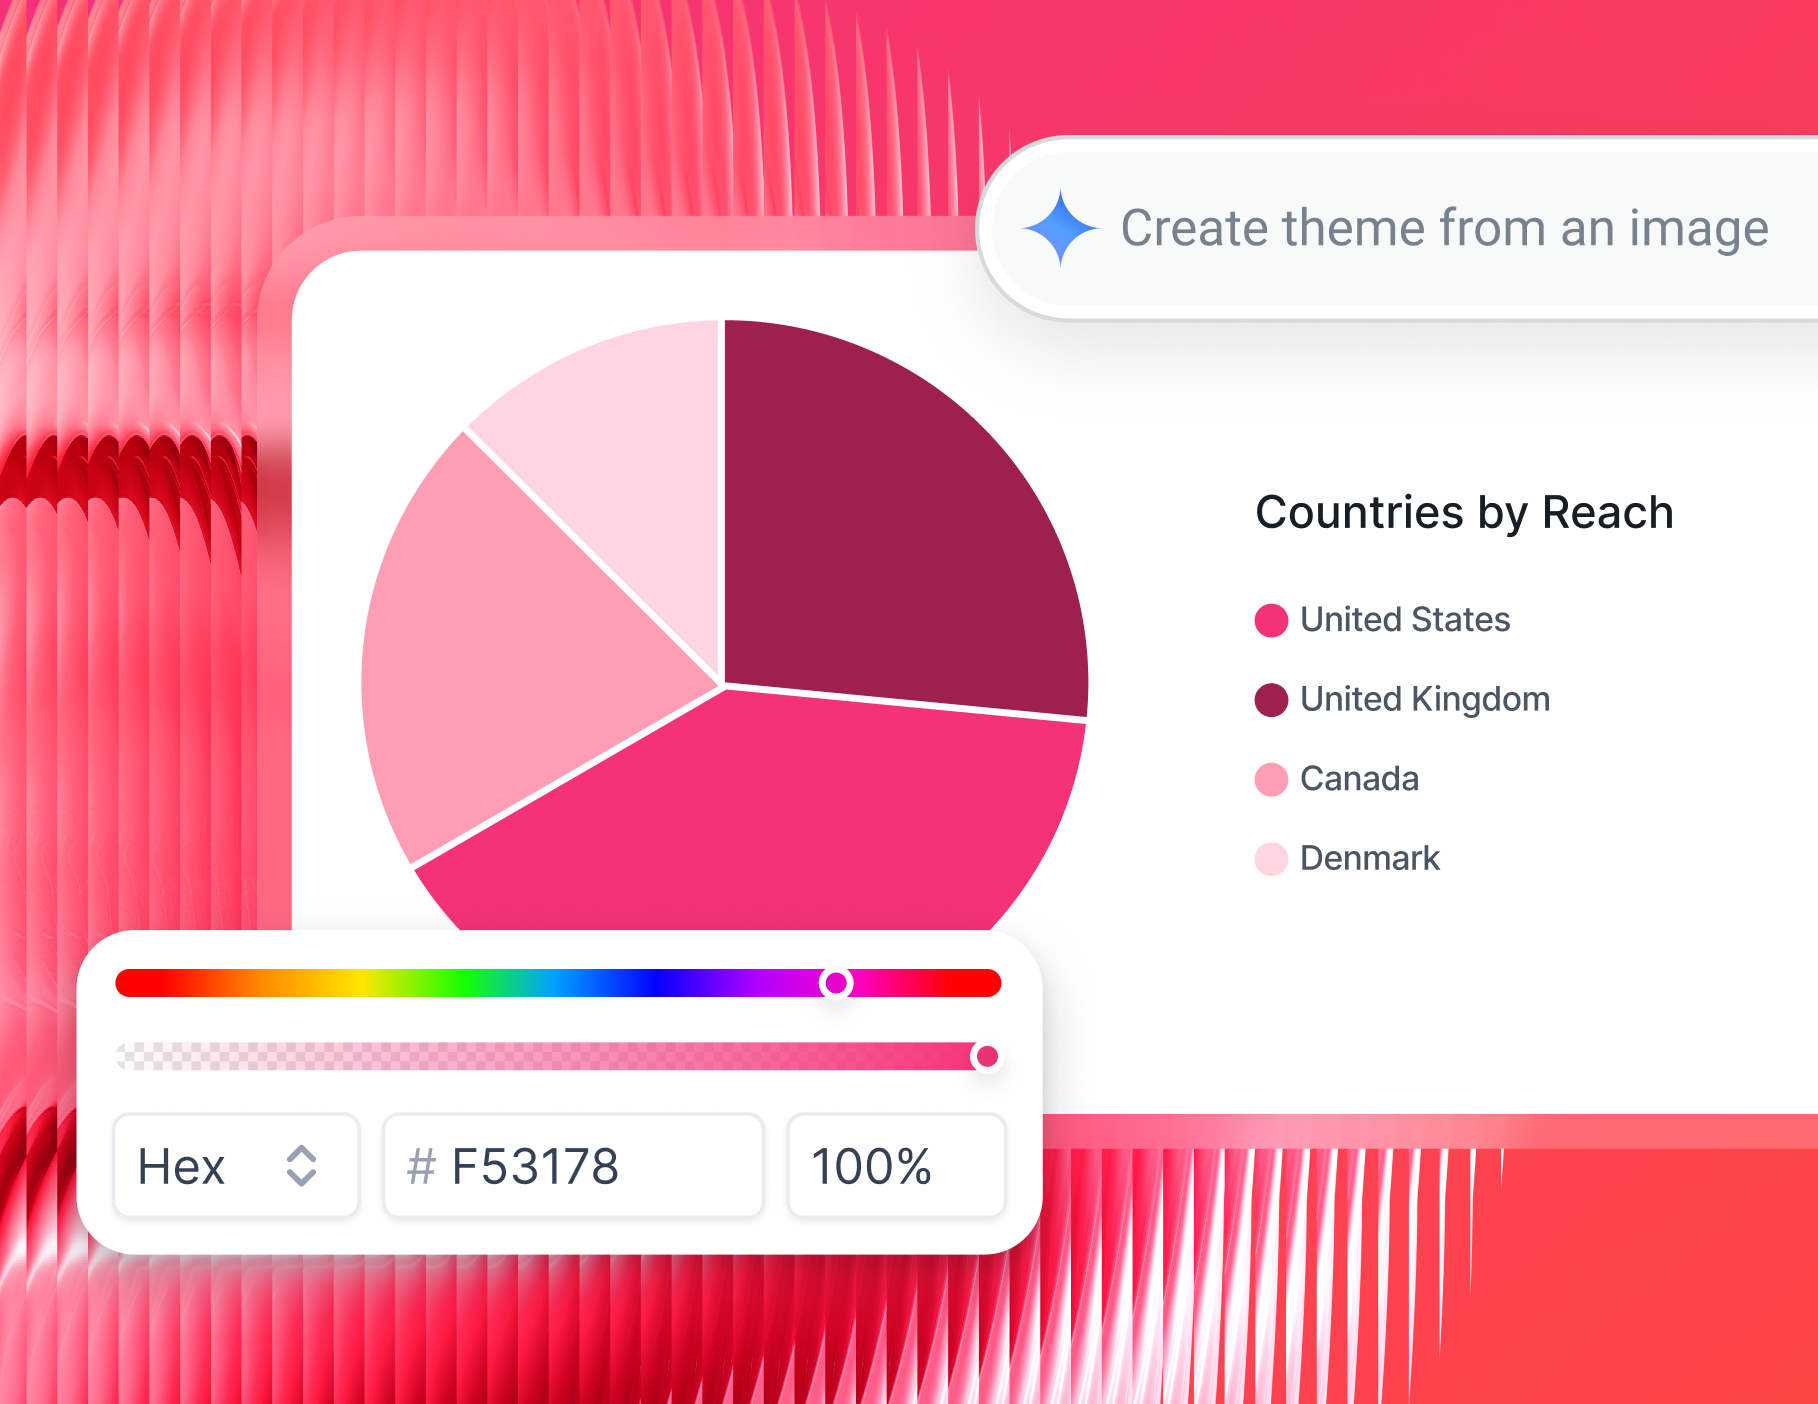
2. Brand reports in seconds. Upload a client logo or image, and IQ creates a matching theme with the right colors, fonts, and styling applied automatically.
When it comes to the importance of design, this is why Michael Keenan, from Principal Peak, thinks it’s important:
Design matters because decision-makers will judge your data by its cover before they ever consider its content. Make your reports pretty. Use consistent colors that match your brand. Add white space. Make your fonts readable. - Michael Keenan, Principal, Peak
This is exactly what Whatagraph IQ Themes helps with - branded, visually consistent reports applied in seconds.
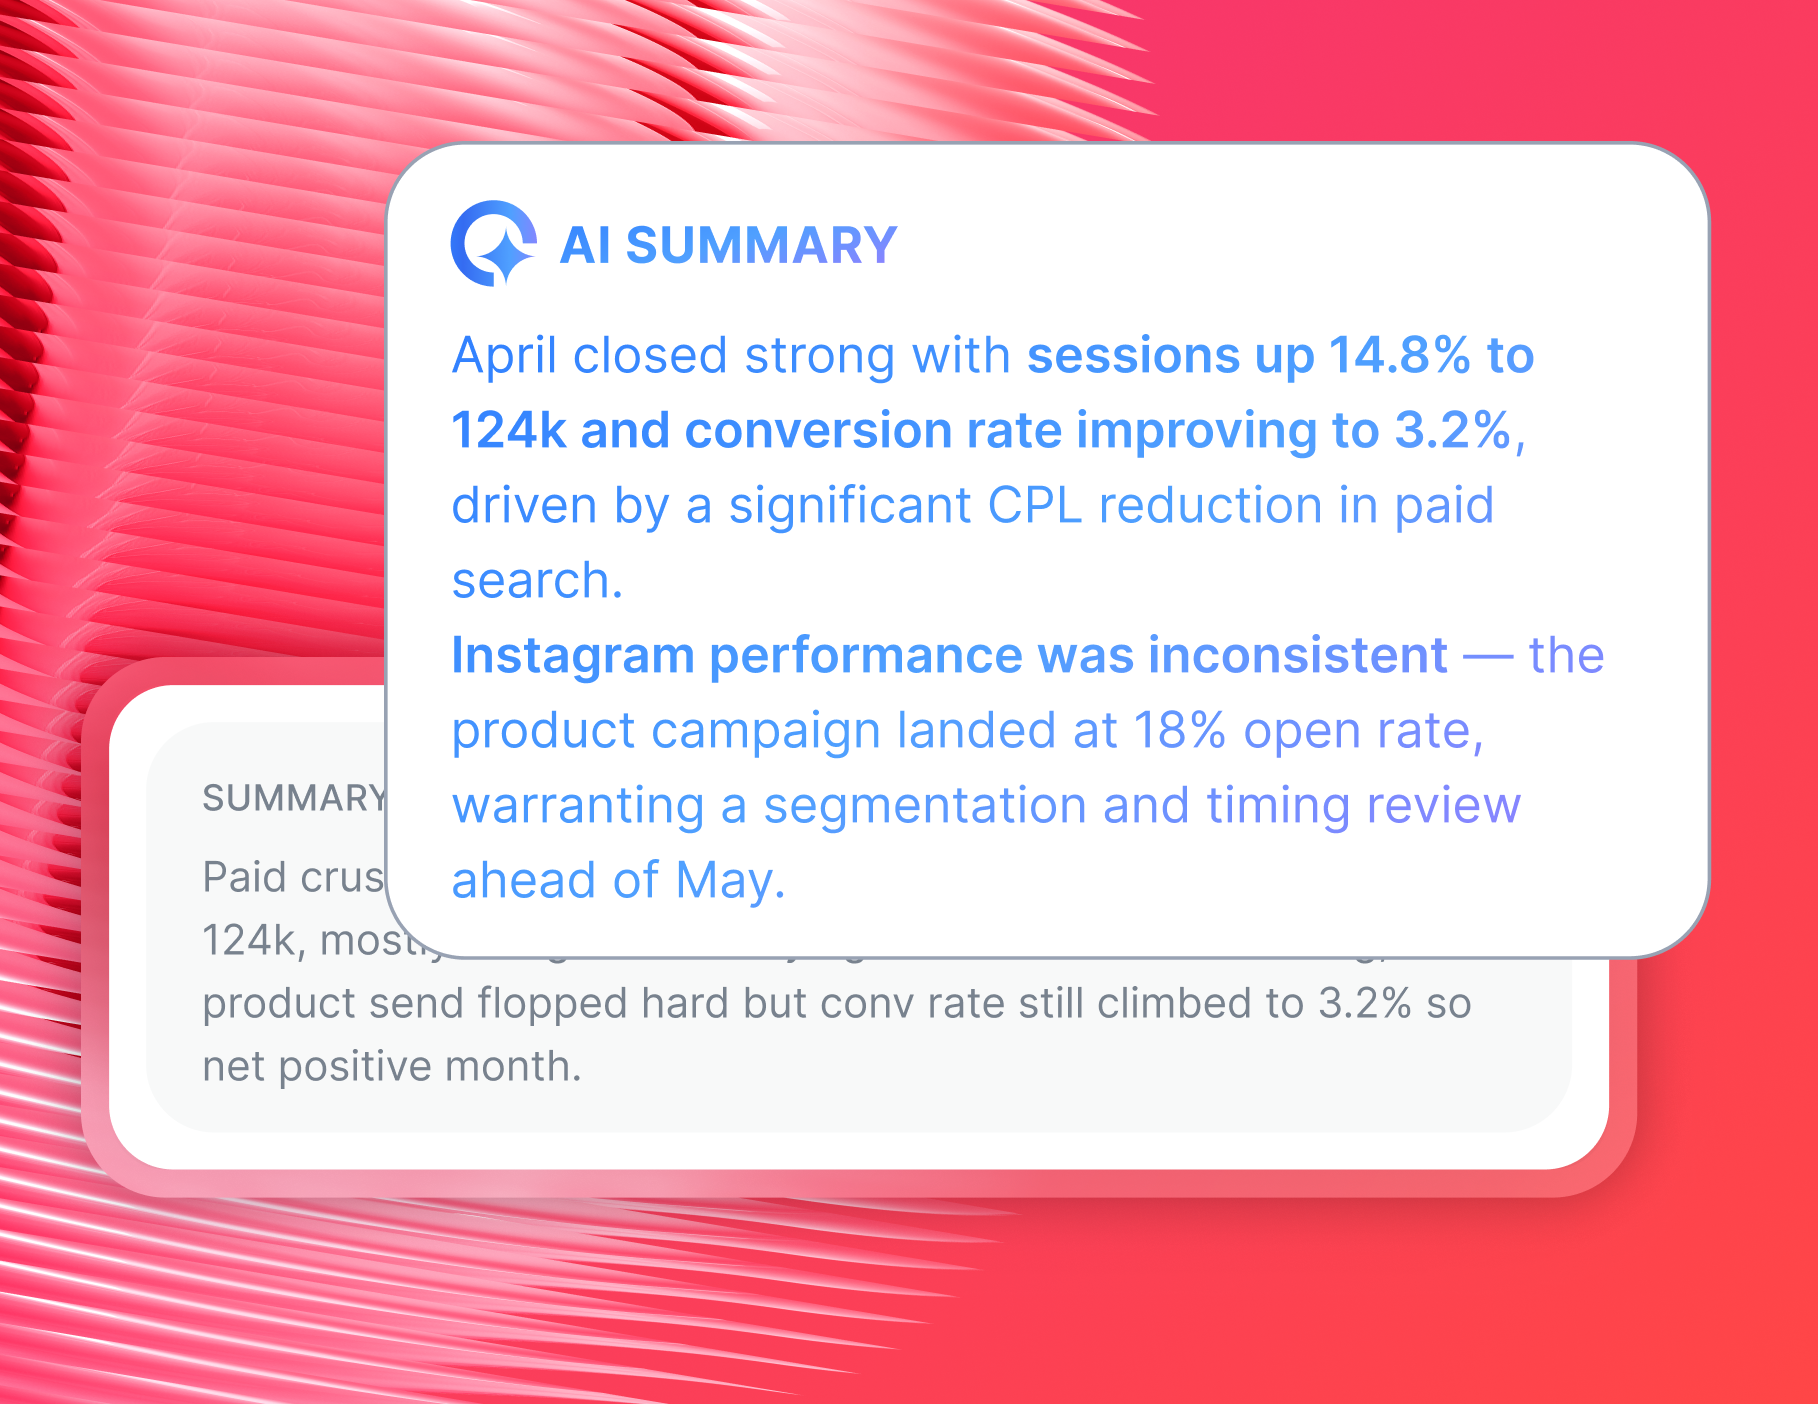
3. Generate written summaries from live data. IQ reads the actual data on your report and writes performance commentary you can send as-is or edit for your own voice. No hallucinations, no copy-pasting numbers into a text doc.
As Chris Coussons, the founder of Visionary Marketing, says:
A report is only useful if it answers the question: is this marketing actually working?
Performance summaries do exactly that - they give clients a clear, written answer without leaving them to figure out the numbers themselves.
4. Get instant answers from IQ Chat. Ask things like "Which ActiveCampaign campaign had the highest open rate this quarter?" and get a direct answer without opening a single dashboard.
The results speak for themselves. After switching to Whatagraph, Maatwerk Online, an agency managing 100 clients, is now saving 100 hours per month on reporting.
The hours that we’re saving with Whatagraph are just pure profit. We now have time to focus on an actual marketing strategy that helps both our agency and our clients grow. - Lars Maat, Co-Founder at Maatwerk Online
Start free with Whatagraph today.
2. Looker Studio - best for teams already working in the Google ecosystem
Looker Studio (formerly Google Data Studio) is a free dashboarding tool that works well when your data lives primarily in Google's platforms. If your client's email marketing is in ActiveCampaign but the rest of their stack is Google Ads and GA4, you can pull it all together here - with some caveats.
Key features:
- Free to use for standard reports and dashboards
- Native connections to Google Ads, GA4, YouTube, Google Sheets, and more
- Drag-and-drop report builder with a variety of chart types
Looker Studio has a real ceiling once you move beyond Google-native data. Pulling in ActiveCampaign requires a paid third-party connector, and those connectors are known to break - often at the worst possible time.
3. AgencyAnalytics - best for smaller agencies focused on SEO reporting
AgencyAnalytics is a white-labeled reporting platform designed for digital agencies that want a simple, brandable way to show clients their performance across SEO, PPC, and social channels. Setup is straightforward, and the interface is easy to navigate.
Key features:
- White-labeled reports and dashboards with your agency's branding
- Integrations with Google Ads, Facebook Ads, TikTok, and other common channels
- Scheduled PDF and email report delivery
- Basic SEO-focused dashboard and report templates
AgencyAnalytics works best if email reporting is a secondary need and your primary focus is SEO or PPC. Plus, the limited customization and lack of data blending can become a real bottleneck.
4. Microsoft Power BI - best for large enterprises with a dedicated data team
Power BI is Microsoft's enterprise-grade business intelligence platform. It can connect to an enormous range of data sources, handle large data volumes, and produce highly detailed, interactive dashboards.
Key features:
- Wide range of data connectors, including marketing, CRM, and database sources
- Advanced visualization options and interactive report elements
- Native integration with the Microsoft 365 ecosystem
- Scheduled data refresh for near-live reporting
Power BI is genuinely powerful - but it's built for data teams, not marketing teams.
Setting up an ActiveCampaign integration, building a report from scratch, and maintaining it as your data changes all require a level of technical fluency that most account managers simply don't have time to develop.
5. Supermetrics - best for teams that already have a BI or visualization tool in place
Supermetrics is a data pipeline tool - think of it as the layer that moves your marketing data from platforms like ActiveCampaign into destinations like Google Sheets, BigQuery, or Looker Studio. It doesn't build reports or visualize anything on its own.
Key features:
- Data connectors for a wide range of marketing platforms
- Destinations include Google Sheets, BigQuery, Looker Studio, and Excel
- Scheduled data syncs to keep your destination tool refreshed
Supermetrics can work if you already have a visualization setup and just need a reliable data pipeline to feed it. But for marketing agencies that want one platform for data connection, visualization, and sharing, it falls short.
What email metrics should I include in an ActiveCampaign report?
ActiveCampaign surfaces a lot of data - but a good report isn't about showing all of it. The right metrics always tie back to what your client’s goals are.
There's a ton of metrics that we as marketers look at that would make no sense and probably overwhelm the customers. So we always try to be very specific about what the client's goal is and then just show the metrics for that. - Cheyenne Skye, Digital Marketing Analyst, Noise New Media
While every client is different, these are the metrics we recommend as a starting point.
1. Contact and pipeline metrics
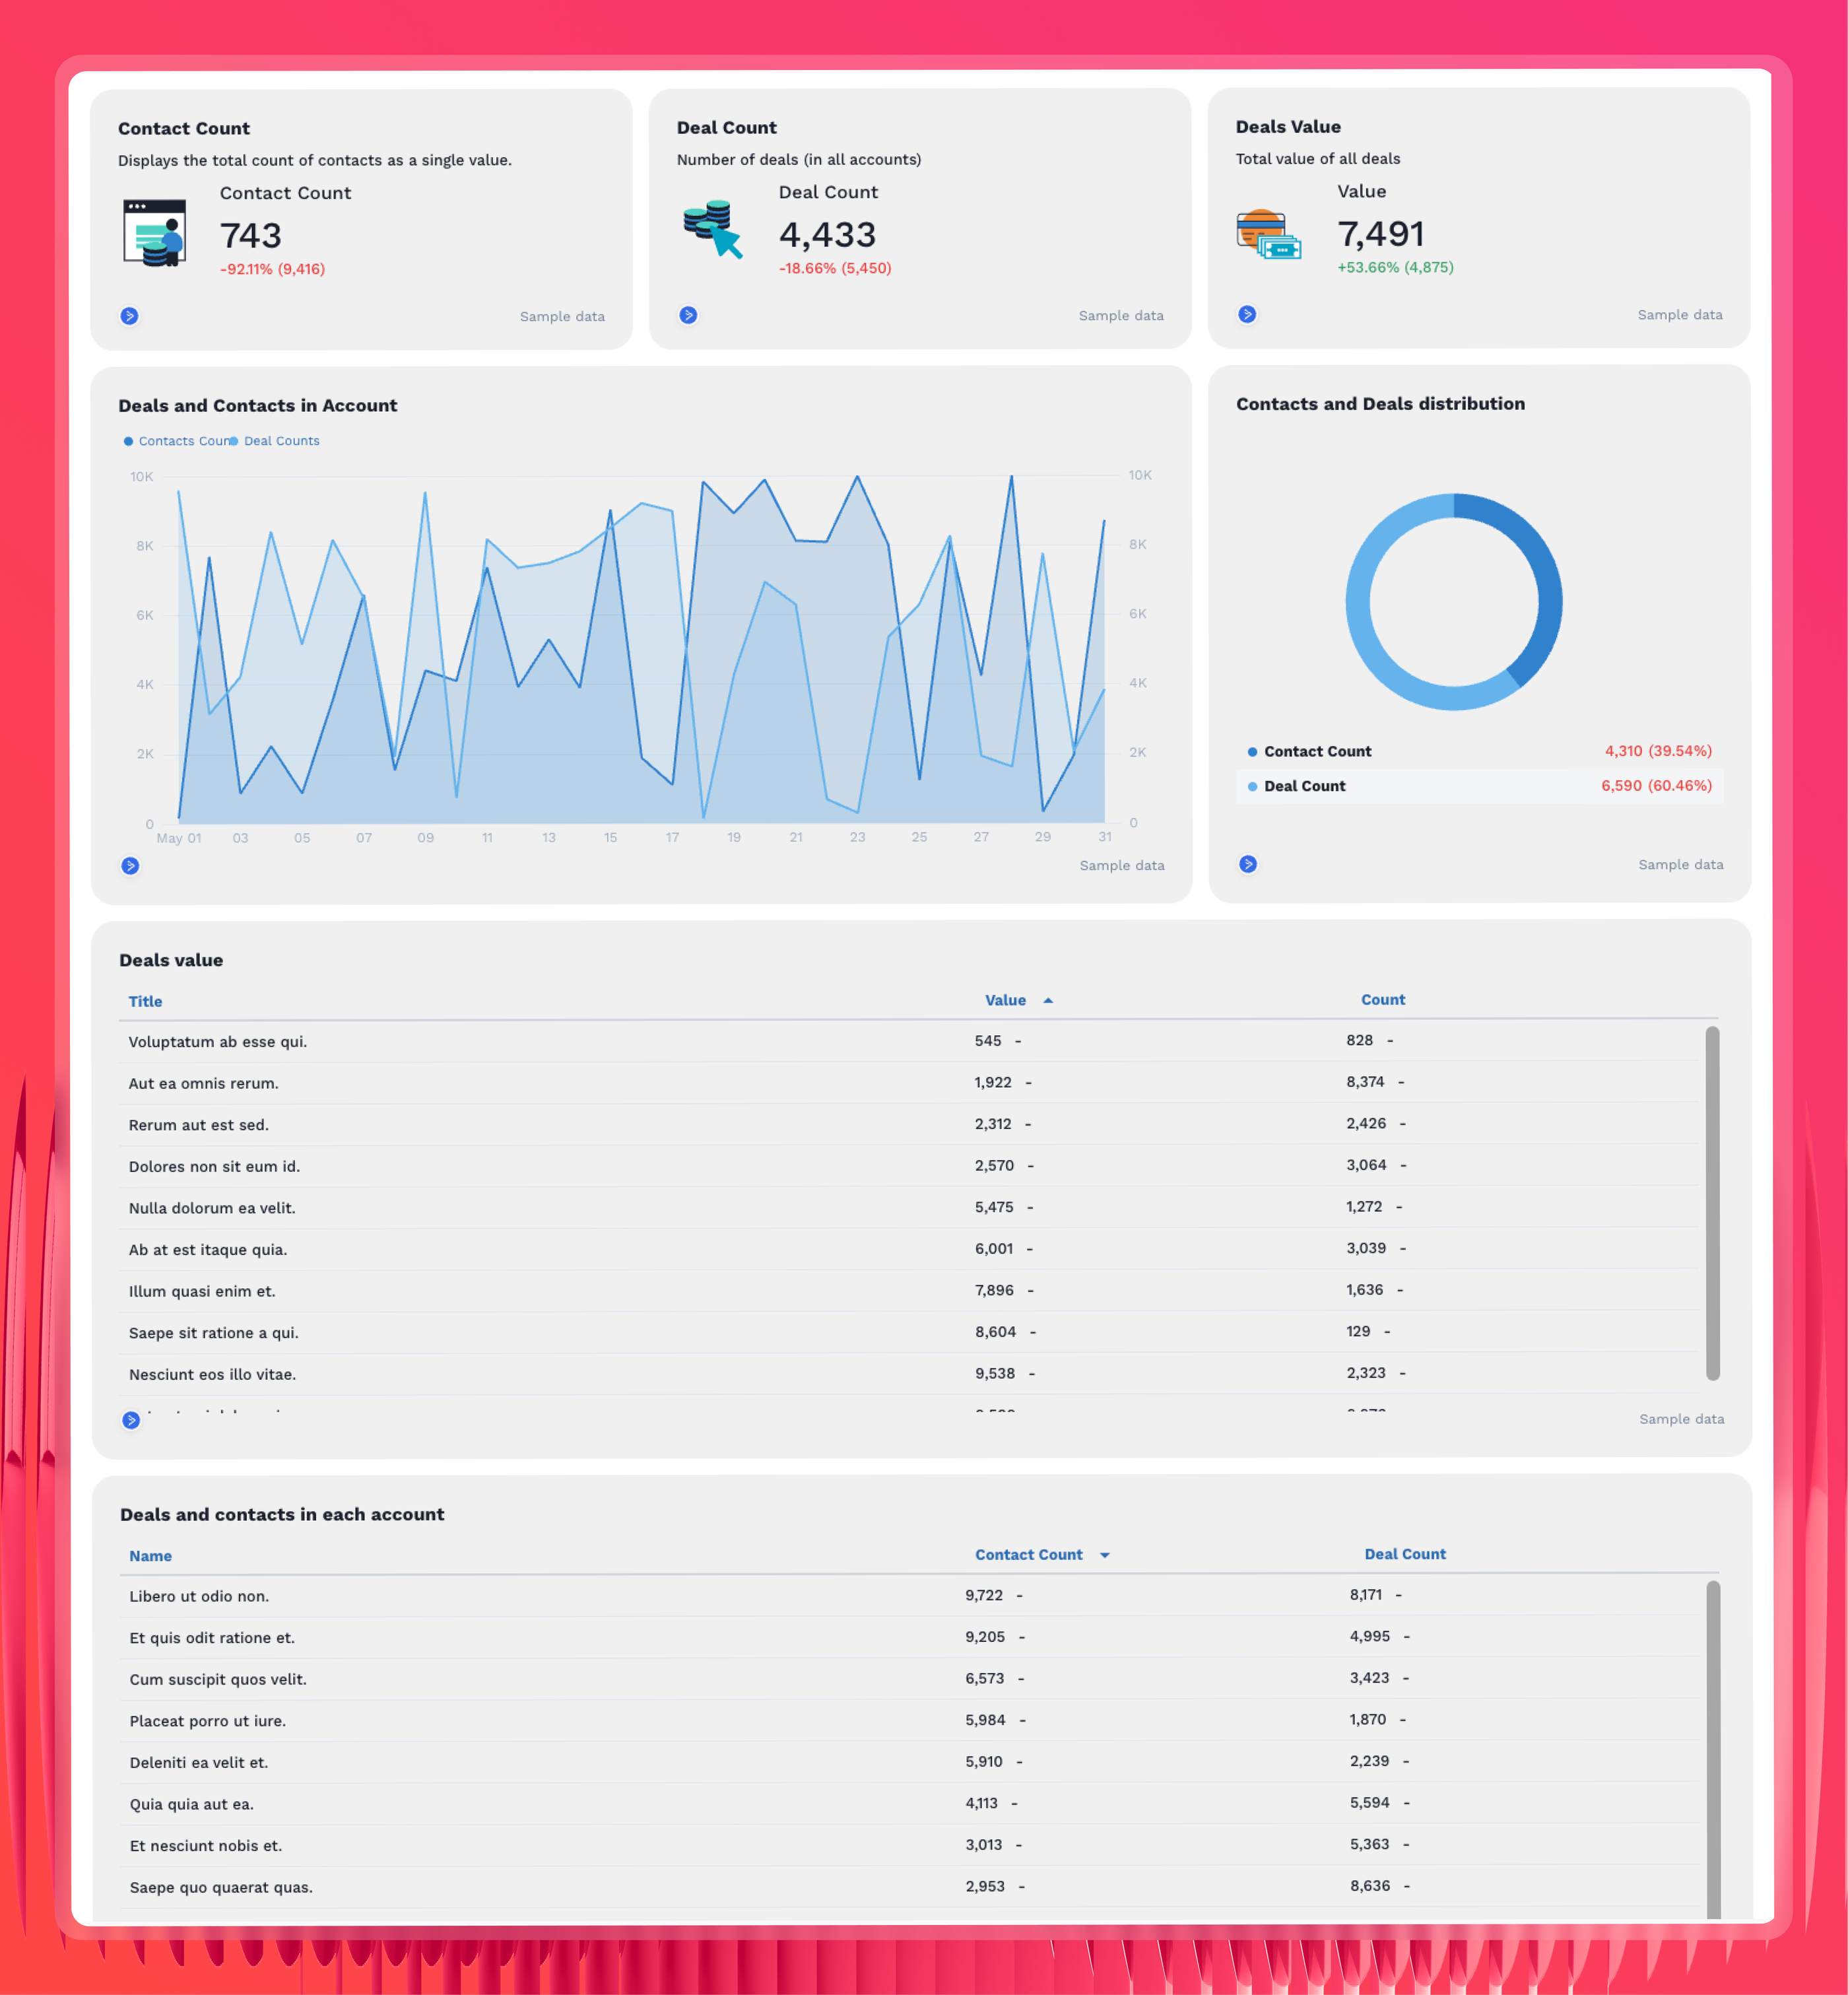
These metrics give you a baseline view of list health and CRM activity - essential for understanding the audience behind your campaigns.
- Contact count: The total number of contacts in your ActiveCampaign account - a foundational number for tracking list growth over time
- Deal count: How many active deals are in the pipeline - useful for connecting email activity to sales outcomes
- Deals value: The combined value of deals in your pipeline - helps tie email marketing efforts to revenue potential
- Deals and contacts in account: A breakdown of how deals and contacts are distributed across accounts
- List of deals and contacts: A granular view of individual deal and contact records - useful for drilling into specific accounts or segments
2. Email engagement metrics
These are the core indicators of how your audience is responding to your marketing campaigns.
Use these to optimize send frequency, subject lines, and content.
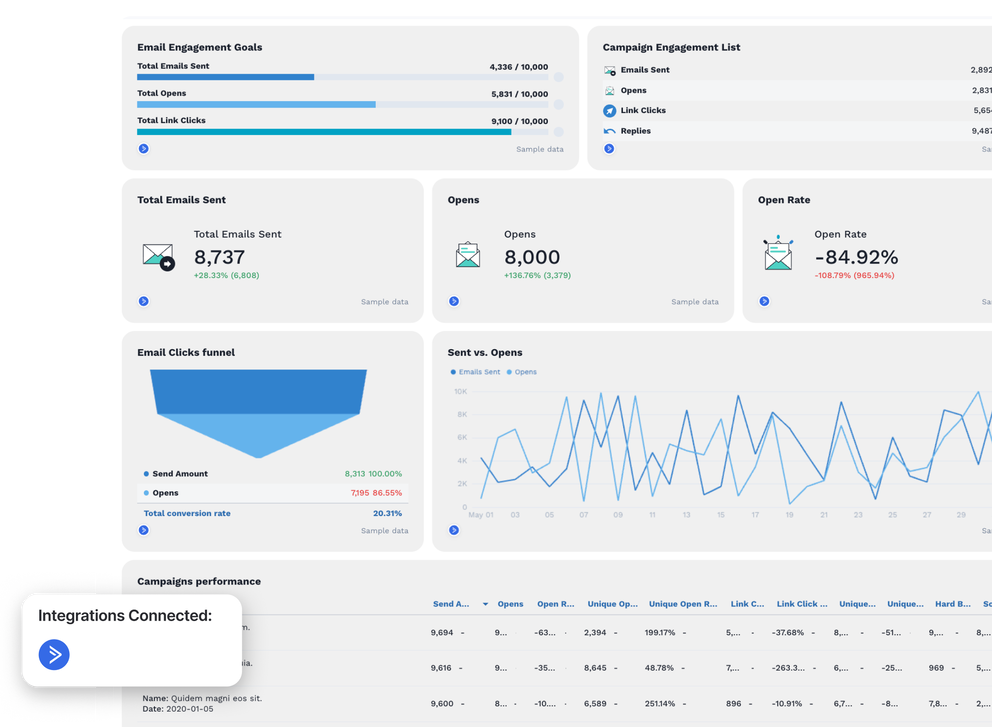
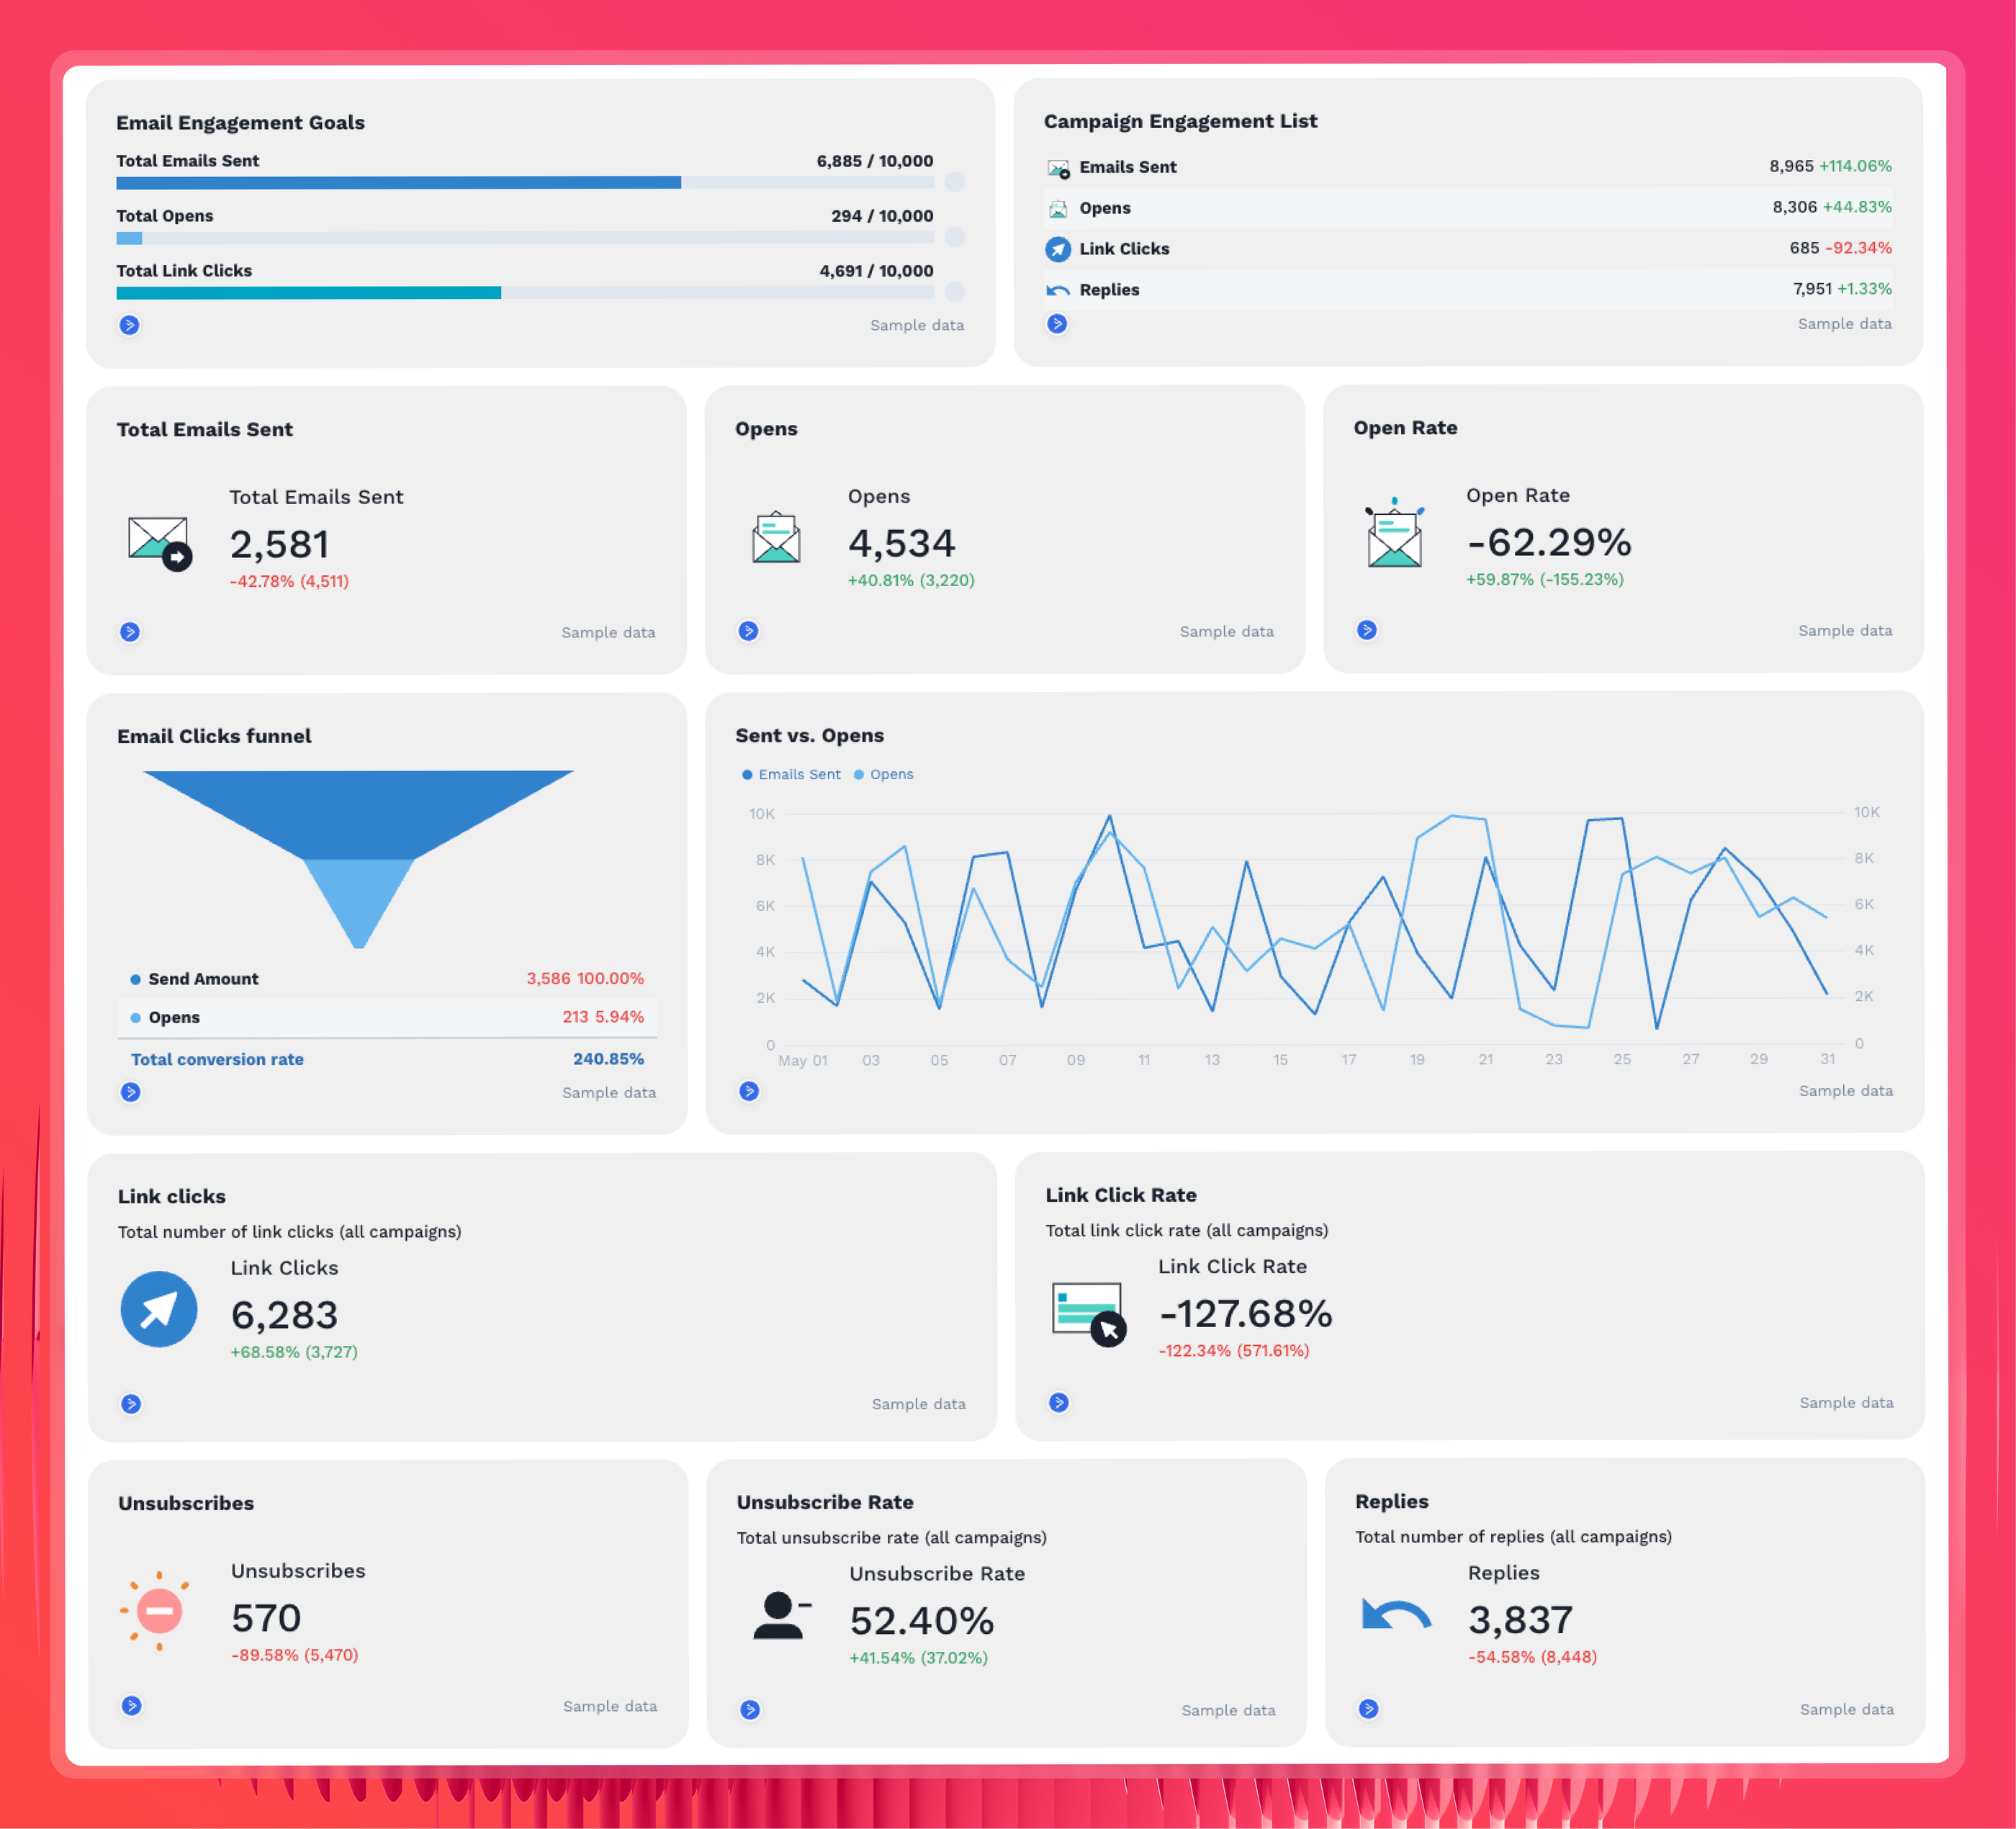
- Total emails sent: The volume of emails sent across all campaigns in a given period - your baseline for all engagement rate calculations
- Opens: The raw number of times emails were opened - a basic signal of subject line effectiveness
- Open rate: Opens as a percentage of emails sent - one of the most watched metrics in any ActiveCampaign engagement report
- Sent vs. opens: A visual comparison of send volume against open volume over time - useful for spotting trends and drops in engagement
- Link clicks: The number of times links inside your emails were clicked - indicates how compelling your content and CTAs are.
- Unsubscribes: The number of contacts who opted out during a given period - an important list health signal
- Replies: The number of direct replies to your email campaigns - a strong signal of audience engagement
3. Campaign performance metrics
These metrics help you evaluate individual campaigns and identify what's working across your email marketing program.
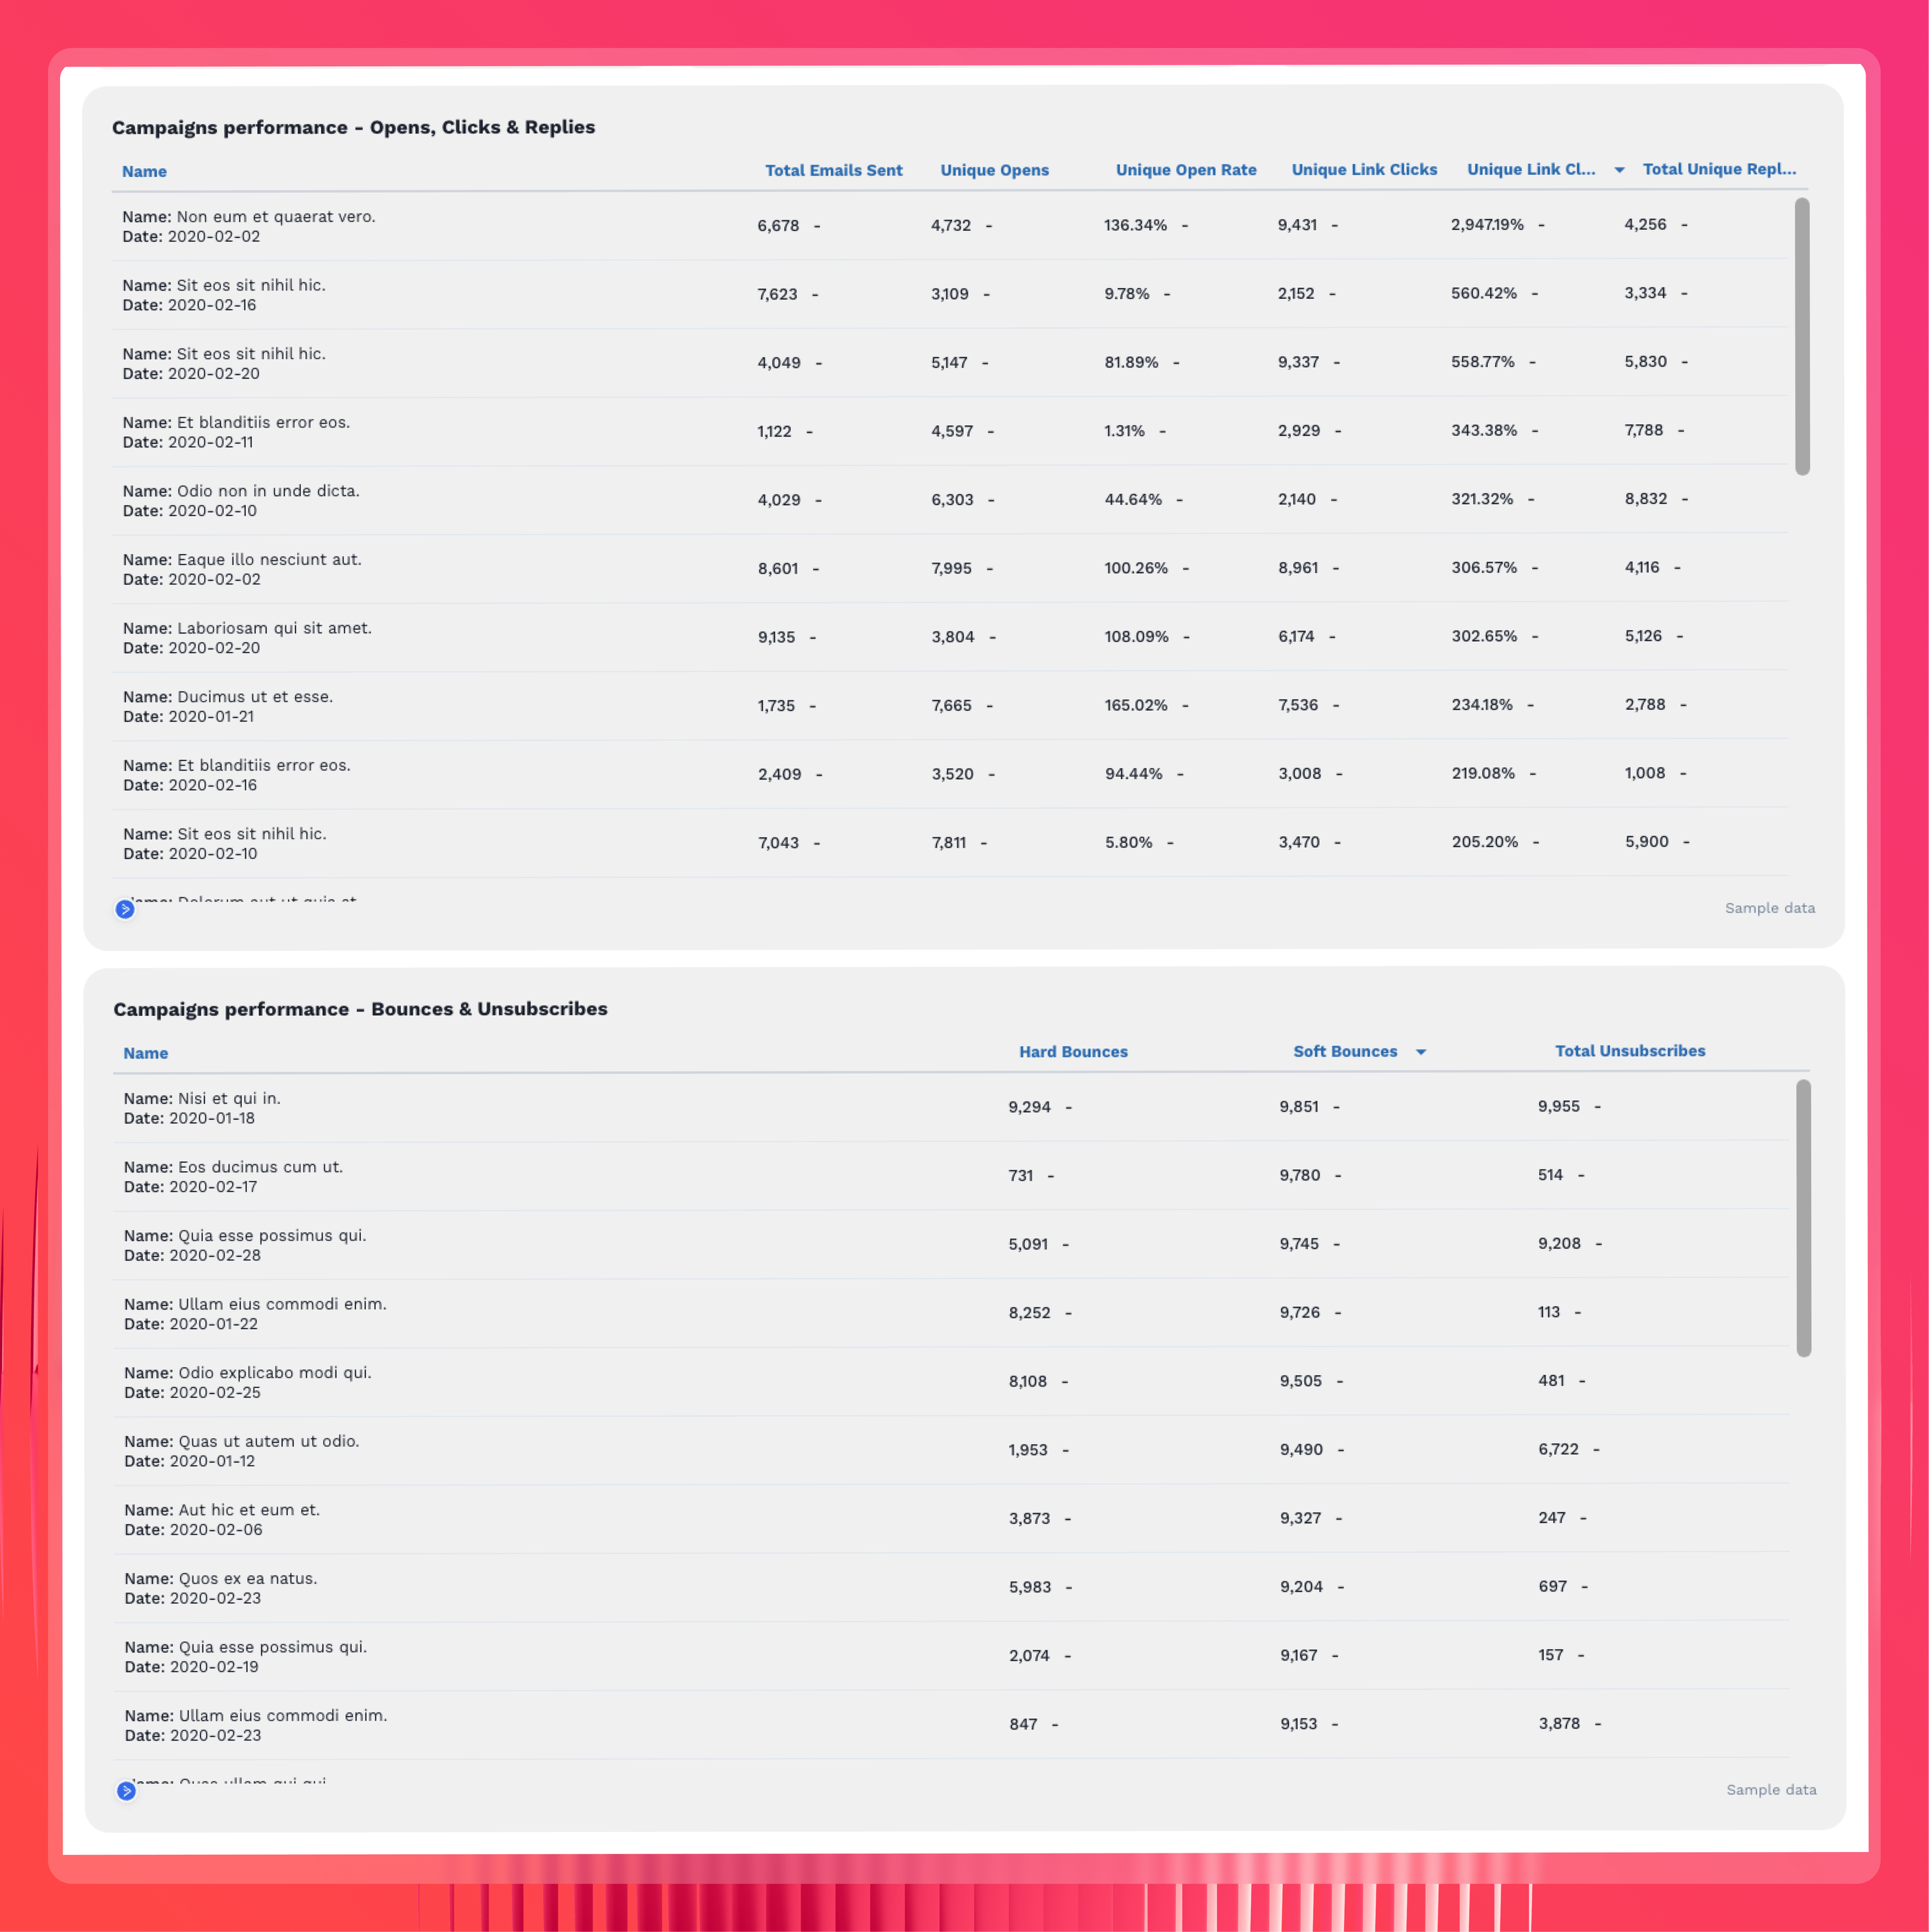
- Campaign performance breakdown: A detailed table showing key metrics - opens, clicks, unsubscribes, replies - across each campaign, so you can compare performance at a glance
- Email campaign goals: Tracks progress against the targets you've set for each campaign - keeps reporting tied to outcomes, not just activity
Clients care about one thing: growth. They want to know, 'Did this campaign move the needle?' Revenue, ROI, and progress toward their end goals matter most. - Tom Jauncey, CEO of Nautilus Marketing
4. Performance summary
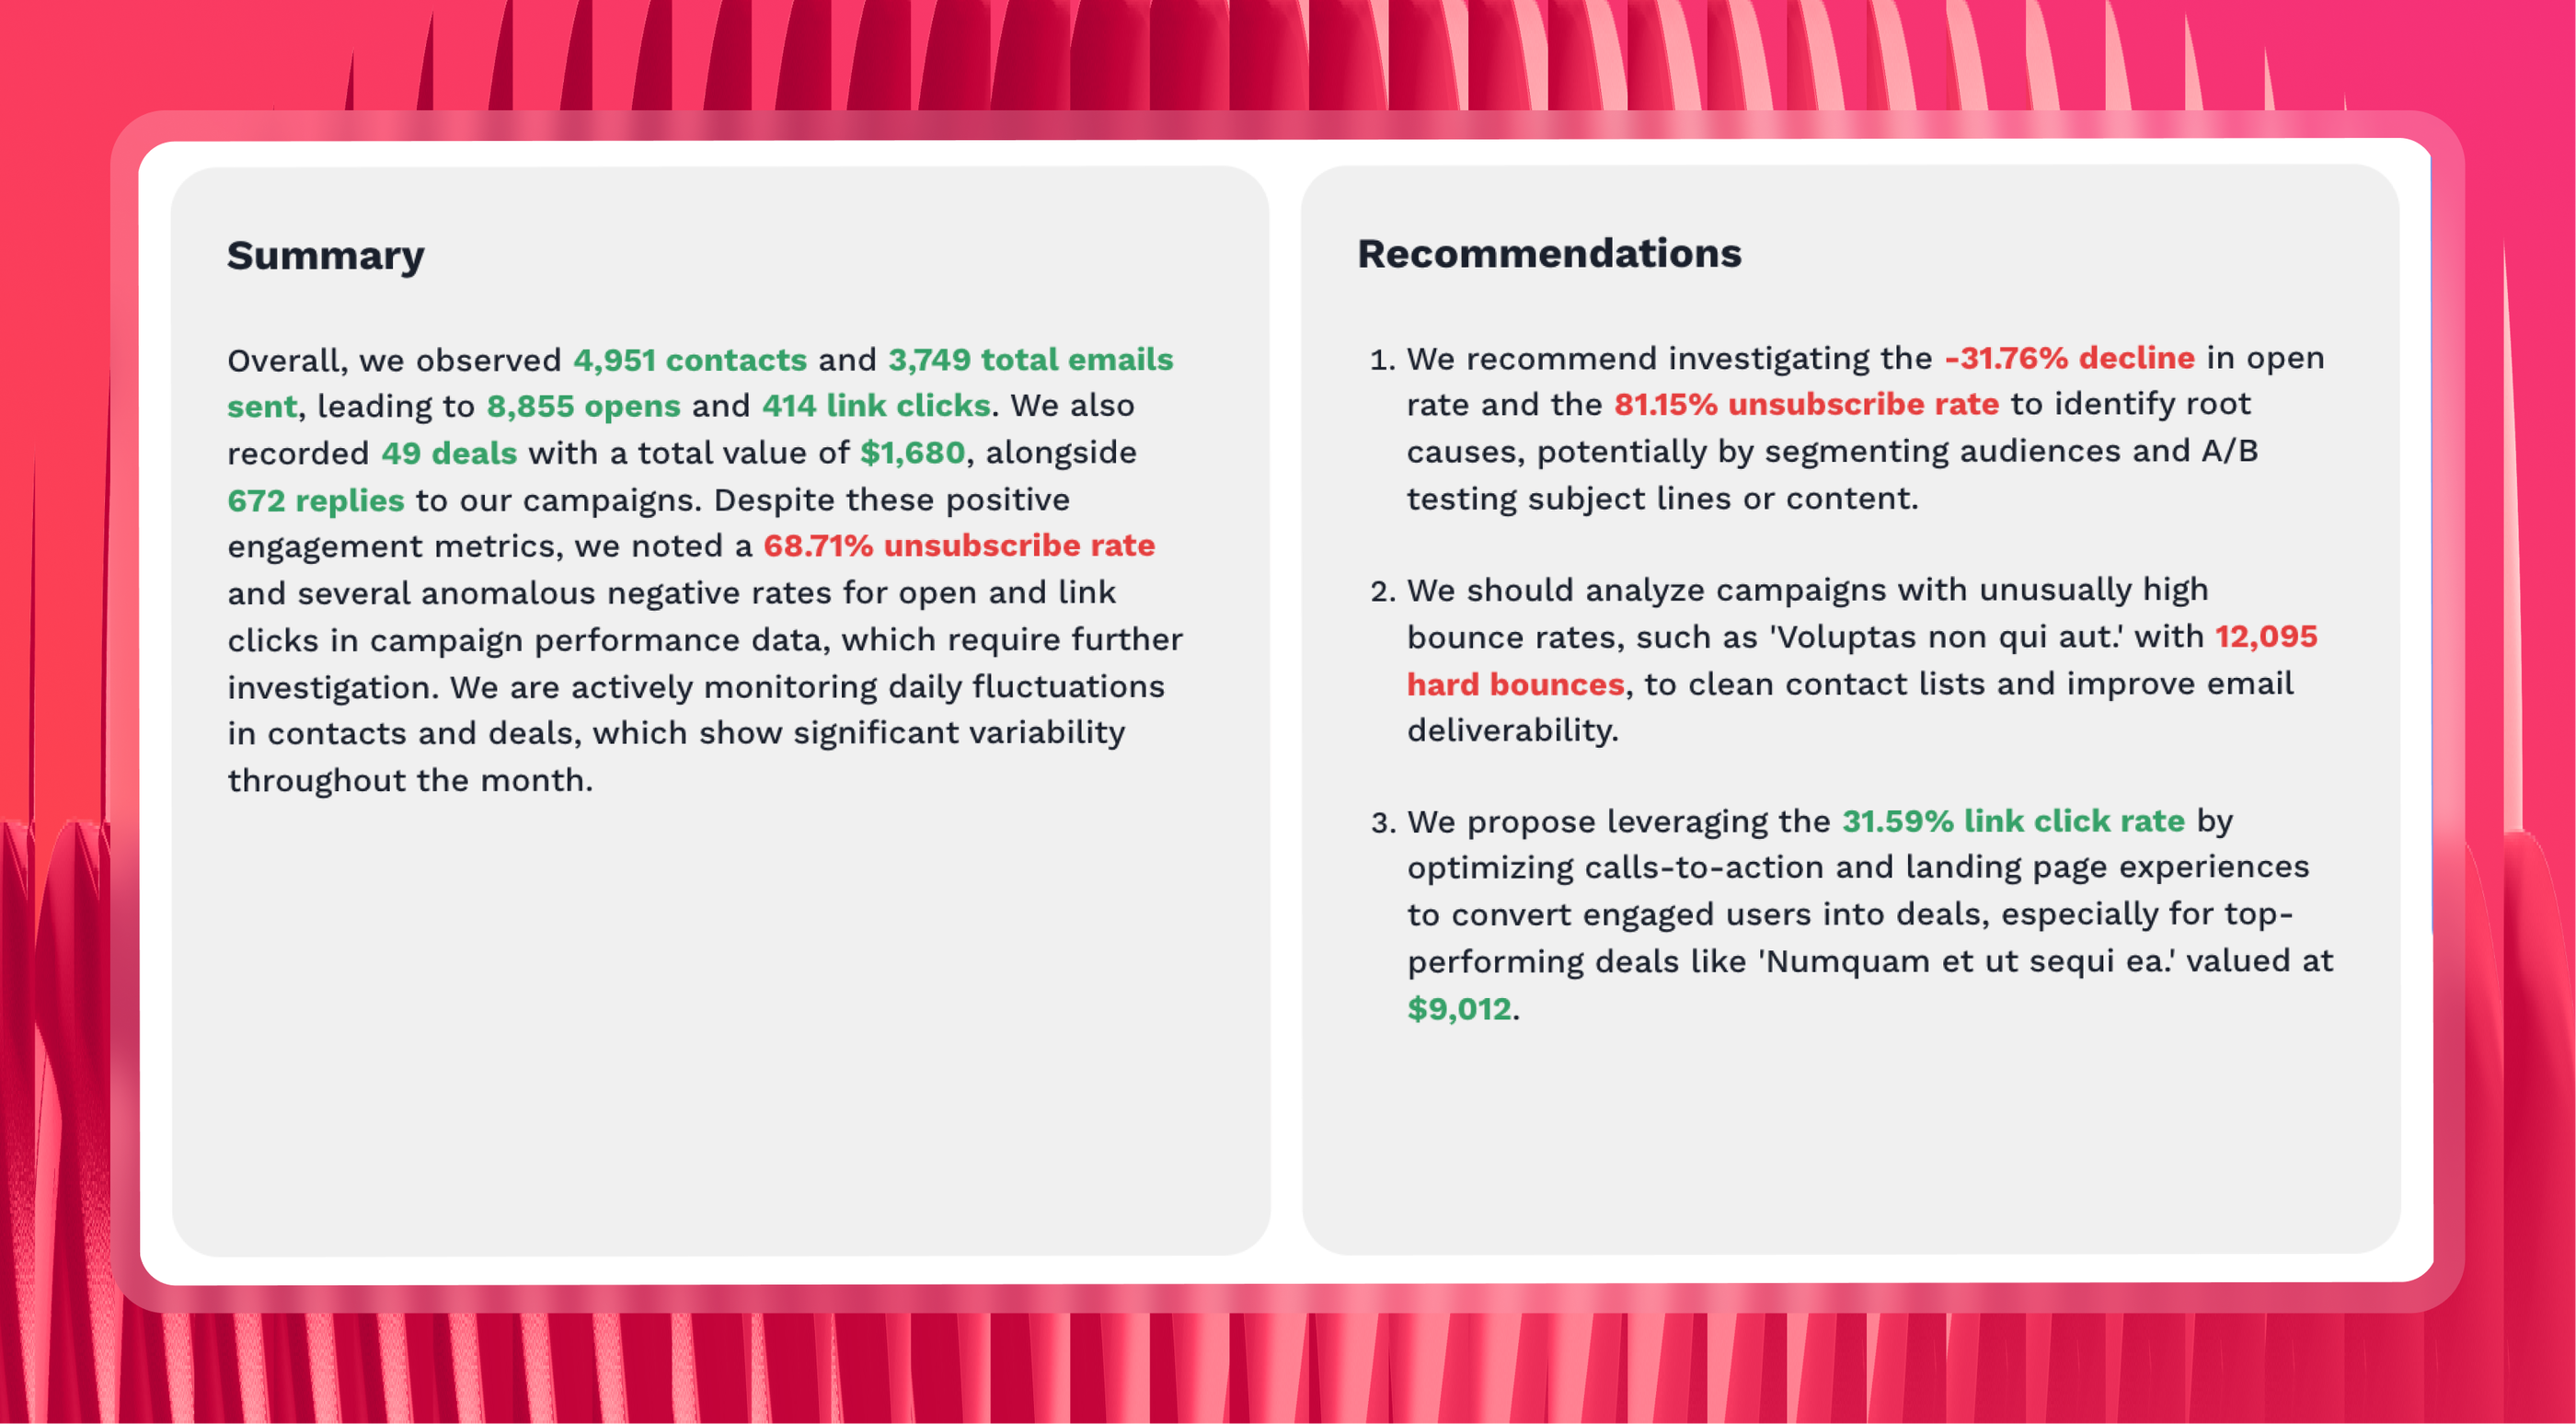
Numbers tell you what happened. A summary tells you what it means - and what to do next.
In addition to the key metrics, every ActiveCampaign report should start with a short written section that covers what performed well, what didn't, and where you're headed in the next cycle.
This is what turns a data dump into a report clients actually read.
Keep your reports clear, concise, and actionable. Start with the wins, explain what's driving results, and then outline the next steps. - Tom Jauncey, CEO of Nautilus Marketing
With Whatagraph IQ Summaries, you don't have to write this from scratch. AI pulls the insights directly from your report data and generates a ready-to-send summary you can edit, trim, or publish as-is.