Easily group, blend, unify, and aggregate data before it's visualized or shared
Uncover insights without the hassle. Group countries into tiers, aggregate campaign data, demonstrate cross-channel performance, and add custom calculations at scale.
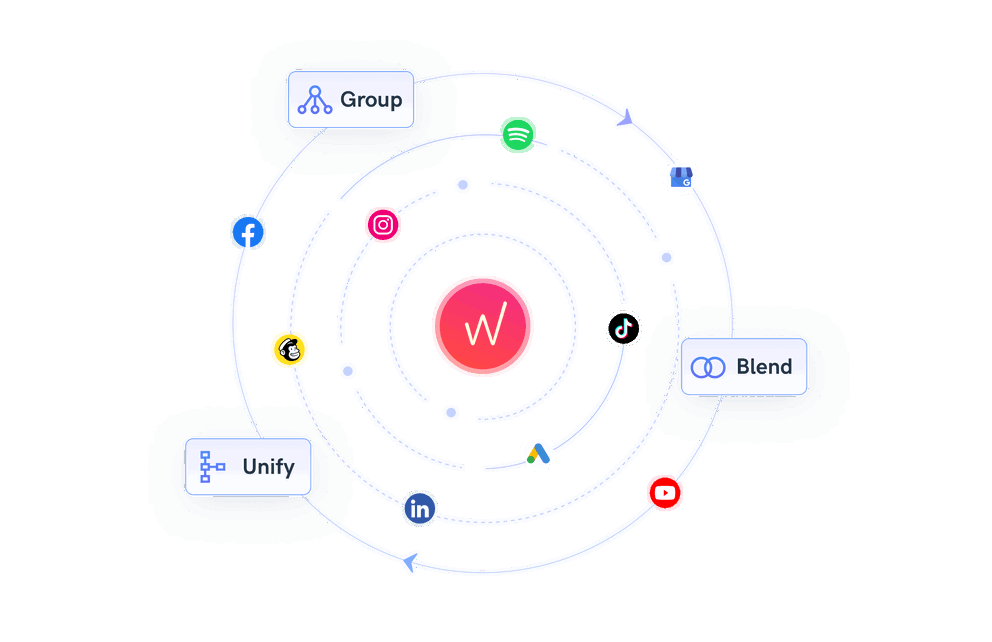


Organize your scattered cross-channel data to turn it into insights
From confusing tables to a clear campaign performance overview
Here's an example: When visualized, your internal campaign naming is confusing and makes it hard to see what's happening. By organizing data in Whatagraph, you go from scattered campaign metrics to clearly displayed insights to analyze or share.
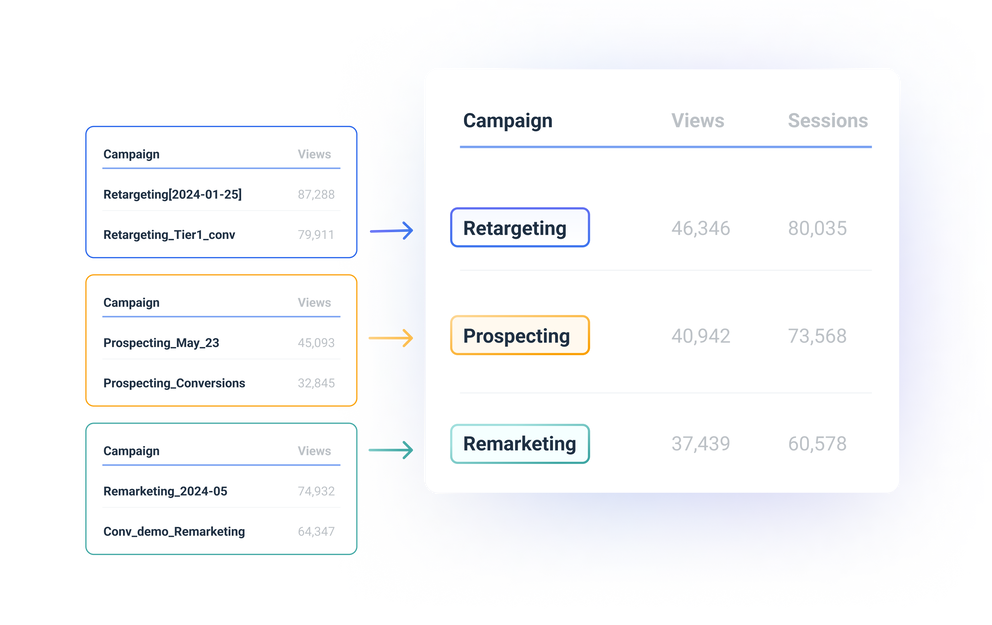


Organized data means more efficient performance monitoring and reporting

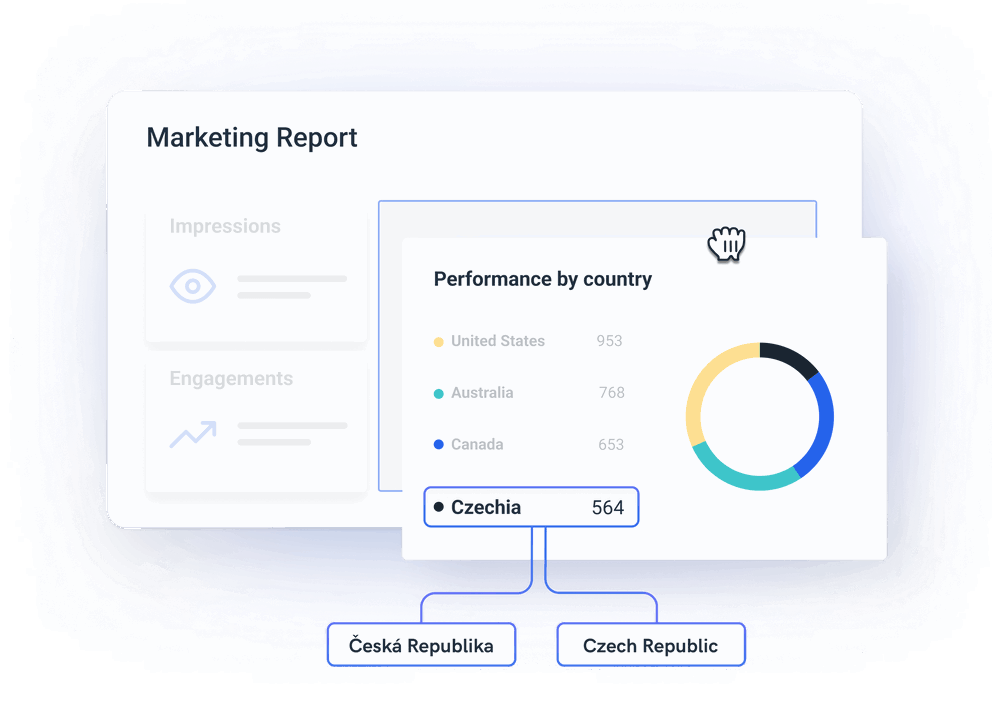
Rename, unify, or translate text and naming across all dashboards at once
Change how your internal naming conventions are displayed. Standardize country names, metrics, and dimensions to make reports more consistent. Add clarity from the first glance.
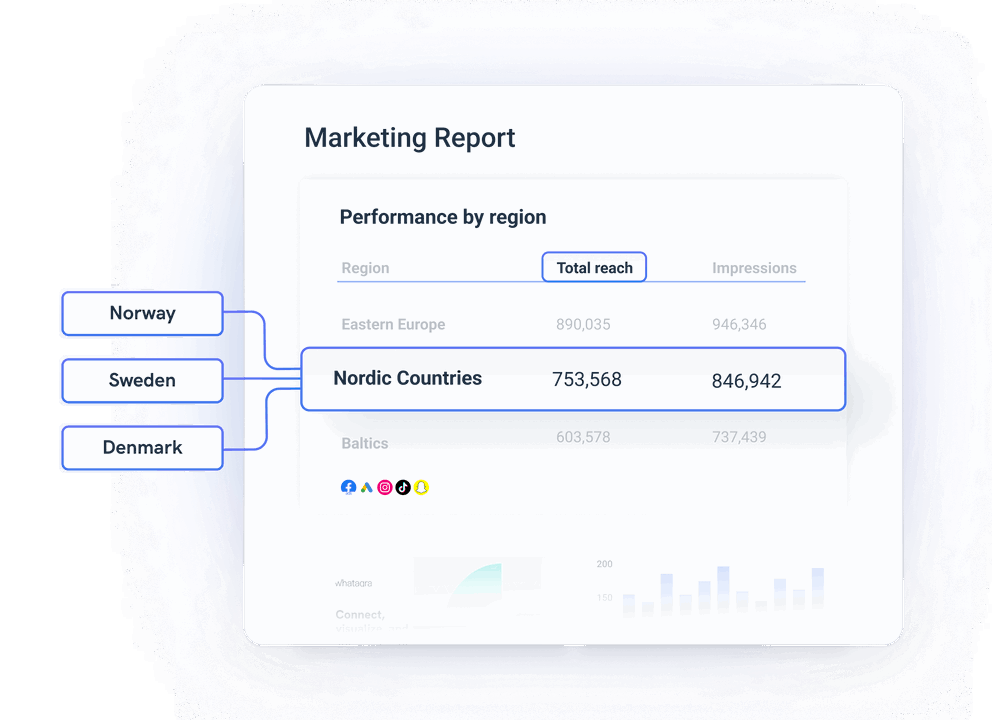
Easily group and aggregate data to gather high-level performance insights
Group data from multiple campaigns or countries into regions and tiers. Aggregate results from multiple websites or social media pages together.
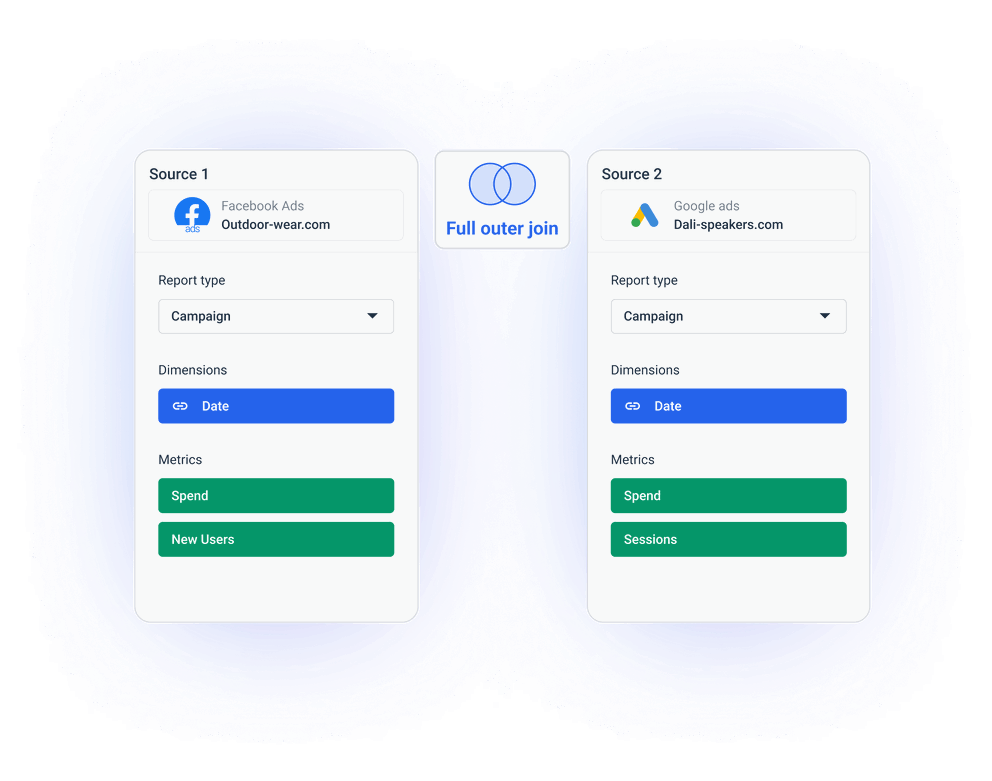
Blend data sources to visualize and get insights faster
You can blend any number of sources, like Facebook Ads and Google Ads, together. When done, it takes a few clicks to visualize results side by side, display combined total metrics, or add custom calculations.
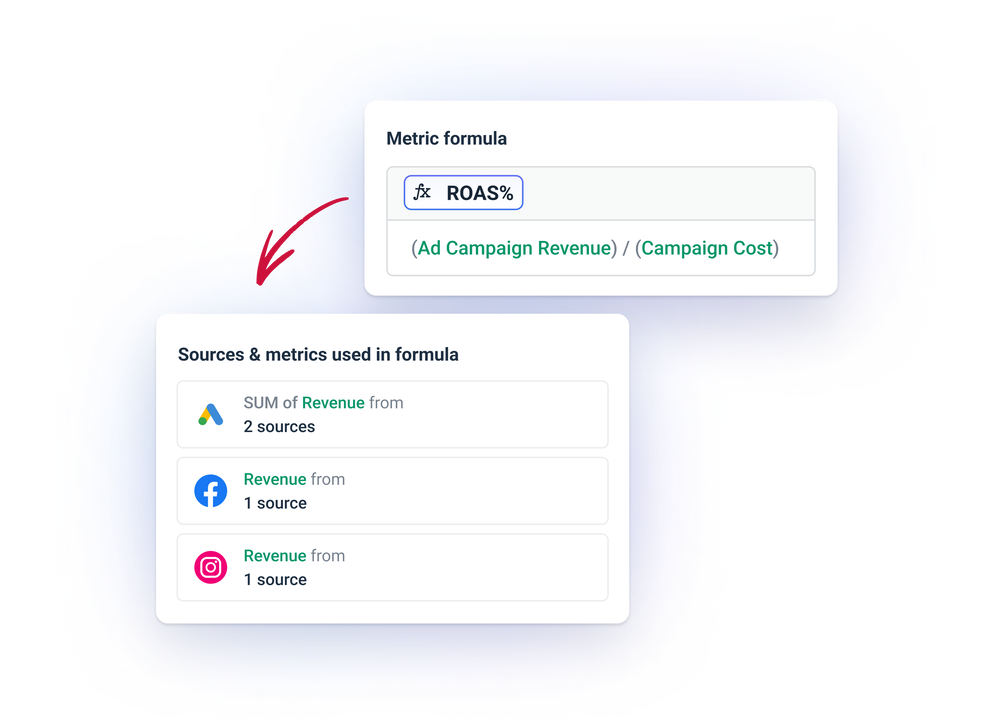
Intuitive builder for custom calculations and formulas
It is easy to create a new metric that you can access with one click. For example, you can show ROAS across multiple campaigns and platforms or add a markup to all the spend metrics for agencies.
What others say about Whatagraph
I made a switch from GDS and Sheets for reporting to Whatagraph, and I am saving literal hours each week on performance report creation. Our small firm actually managed to onboard 2 new clients as a result of all the time we saved on managing data and reporting. The customer service is also really helpful and easy to reach.

Capterra verified review by
Mindaugas S., Marketing Consultant
Having active customer support to help fix any issues was a big contributor, but we also really liked the ability to save templates and connect sources to multiple charts/widgets at once without having to edit them individually. And having the grid layout is much easier to stay consistent with than the free form setup that Data Studio has.

Capterra verified review by
Nico T., Media Planner
The system has standard templates that are easy and fast to use. Also you can build your own report with lightning speed. It is very easy to use, has a lot of integration, and let get started very fast.

Capterra verified review by
Rasmus Bernt K., External Senior Management Consultant
We love Whatagraph - we would definitely recommend and our account manager is great! I love how easy this tool is to use, everyone on the team finds it much more user-friendly than other dashboards. Integration was easy, we sent some example reports to the team who duplicated these for us. We literally had to log in and send it to our clients!

Capterra verified review by
Stephanie S., Digital Director
We are showing our clients the work that we're doing for them and this is incredibly important for our clients ROI. They want to see results and having a tool like Whatagraph that can show data from virtually every source we use is hugely important.

Capterra verified review by
John S., SEO Strategist
The tool is easy to use; you do not need to have development resources. Even my junior project managers are capable of making campaign reports in minutes. There are a lot of pre-made templates you can use as well as many pre-made widgets.

Capterra verified review by
Erman E., Marketing Specialist
Really easy to connect data sources within the tool. The library of report templates has been helpful. The customer support team has been responsive to all of our needs. Our team enjoys the simplicity of setting up the reports and how the data is presented.

Capterra verified review by
Brent N., Director of Operations
Easy to create really beautiful graphs and reports which can help other team members to understand the most important takeaways. I especially like the automated report function, so I don't have to check on the same thing repeatedly.

Capterra verified review by
Orsolya S., Online Marketing Manager
Read more reviews on:


