From scattered data to actionable insights, in minutes.
Sick of managing your data in spreadsheets or clunky tools?
With Performance Monitoring, you can now centralize all your data in one place—and get a clear view of performance, both for your clients and for your agency.


Scattered data is a thing of the past
Competition is fierce for agencies. You need to prove your value constantly to retain clients and onboard new ones.
But with so much data scattered across multiple sources, channels, and locations, it’s hard to understand what’s working and what isn’t.
You waste time in spreadsheets and clunky tools instead of strategizing or building relationships with clients.
We're here to help.

With Performance Monitoring, it’s now refreshingly easy to group, organize, and monitor data in one place.
Save hours of manual work per week
No more manually collecting data in spreadsheets. Bring all your data onto Whatagraph in minutes.
Know what's working and what's not
Analyze performance by client, location, Account Manager, or more. Compare insights, spot trends, and strategize better for clients.
Deliver clean, neat client reports
Clients understand the value you bring, rather than being stuck interpreting data.
How Whatagraph saves you time, money, and headaches
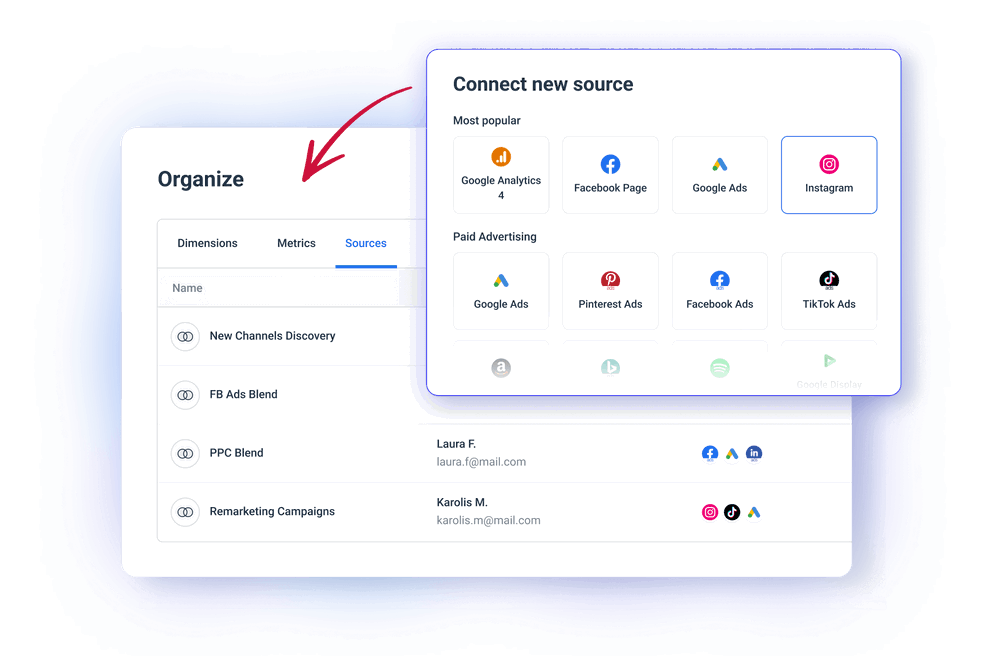
Group scattered data sources under one roof
Have 100s of data sources across different locations, channels, and more?
Combine similar data from different sources and channels into one unified Source Group, in seconds.
Report aggregated metrics in one go, rather than one by one.
Slice and dice data any way you want
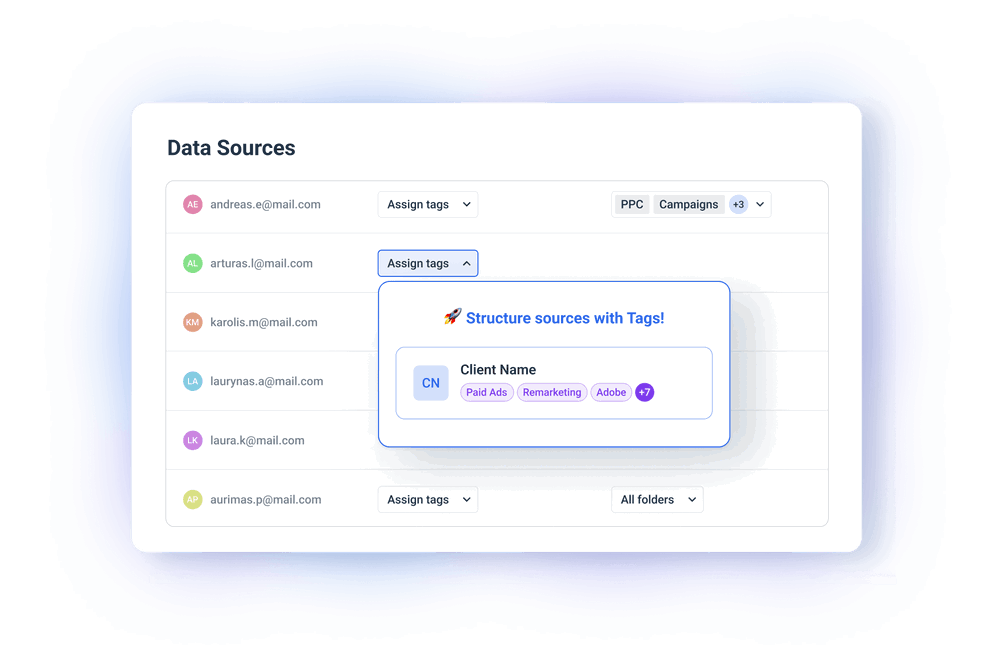
Organize your unified data sources any way you'd like through powerful custom tags.
Break it down by client, channel, Account Manager, or whatever makes sense for your business.
Custom tags reduce clutter and help you get insights faster.
Visualize data from multiple sources in one place
No need to switch from one platform to another.
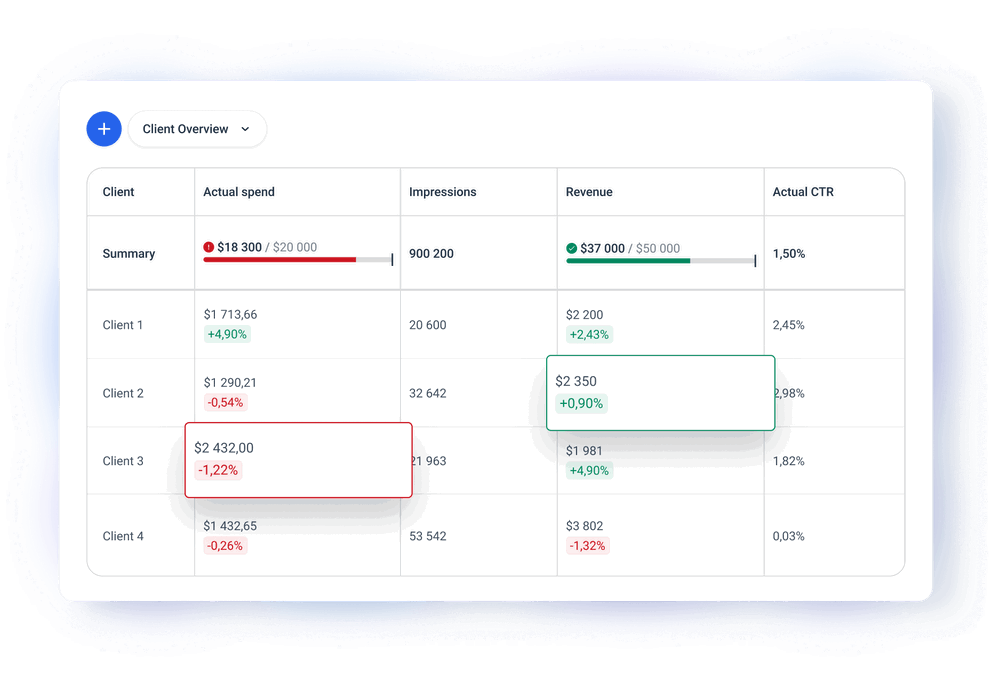
See one view of all of your clients, their spend, and their results on Whatagraph. Set performance targets, receive notifications and act timely.
Use these insights to lower costs and boost ROI for clients.
The Whatagraph Difference





We’re dedicated to your success
At Whatagraph, we believe that Customer Success is a must-have, not an add-on.
All our pricing plans come with a dedicated Customer Success Manager and live chat support.
Your CSM will help you maximize our platform and assist with data migration.
For urgent questions, our amazing Customer Support team is more than happy to help. We reply to chats within 4 minutes.
What others say about Whatagraph
I made a switch from GDS and Sheets for reporting to Whatagraph, and I am saving literal hours each week on performance report creation. Our small firm actually managed to onboard 2 new clients as a result of all the time we saved on managing data and reporting. The customer service is also really helpful and easy to reach.
Having active customer support to help fix any issues was a big contributor, but we also really liked the ability to save templates and connect sources to multiple charts/widgets at once without having to edit them individually. And having the grid layout is much easier to stay consistent with than the free form setup that Data Studio has.
The system has standard templates that are easy and fast to use. Also you can build your own report with lightning speed. It is very easy to use, has a lot of integration, and let get started very fast.
We love Whatagraph - we would definitely recommend and our account manager is great! I love how easy this tool is to use, everyone on the team finds it much more user-friendly than other dashboards. Integration was easy, we sent some example reports to the team who duplicated these for us. We literally had to log in and send it to our clients!
We are showing our clients the work that we're doing for them and this is incredibly important for our clients ROI. They want to see results and having a tool like Whatagraph that can show data from virtually every source we use is hugely important.
The tool is easy to use; you do not need to have development resources. Even my junior project managers are capable of making campaign reports in minutes. There are a lot of pre-made templates you can use as well as many pre-made widgets.
Really easy to connect data sources within the tool. The library of report templates has been helpful. The customer support team has been responsive to all of our needs. Our team enjoys the simplicity of setting up the reports and how the data is presented.


