Google Ads Integration
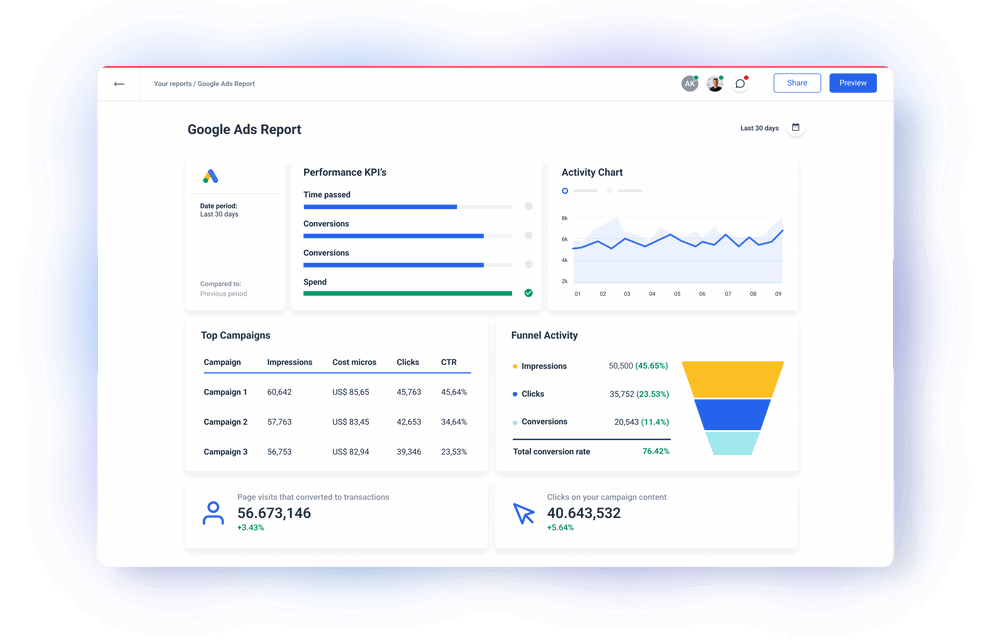
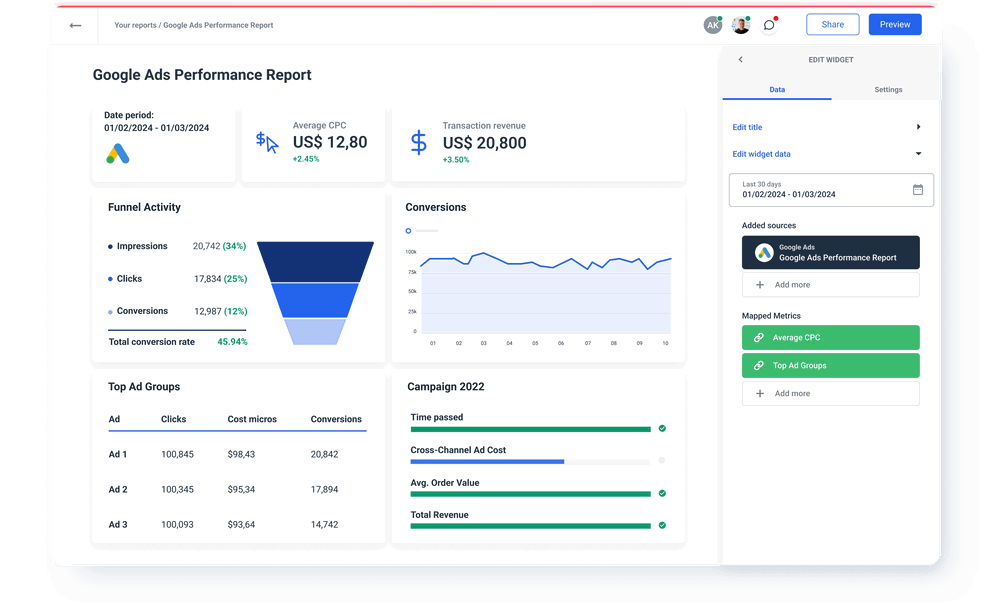
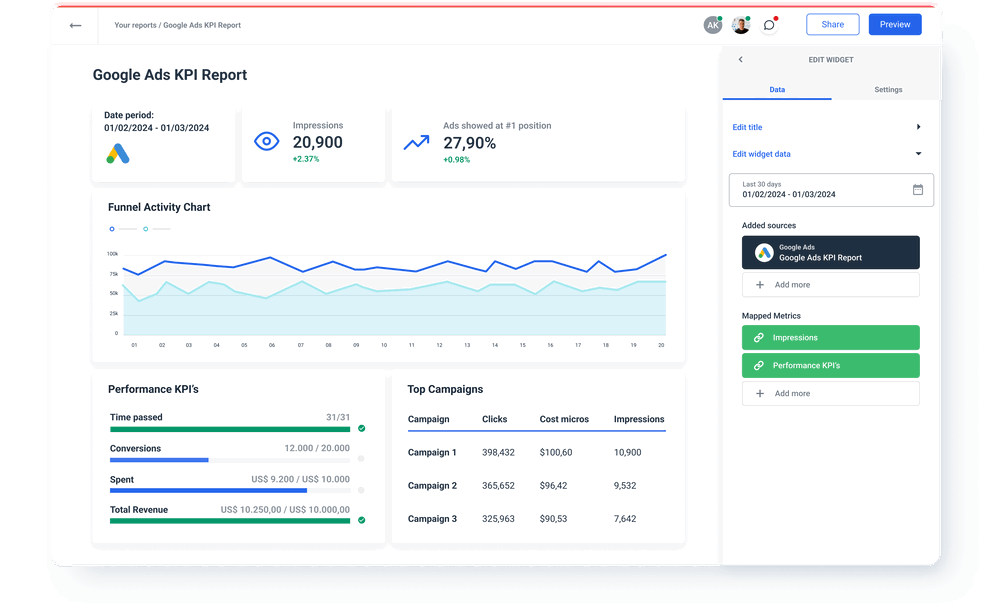
Connect your Google Ads data and use Whatagraph’s advanced visualization to analyze and share the performance of your Google Ads campaigns. A fully managed Google Ads integration pulls data directly from your Google Ads account to our stunning custom reports. In a few clicks, analyze the attribution and conversion data. Blend and organize Google Ads metrics before visualization to present only the most impactful data points. Share insights from your marketing data automatically as scheduled emails or live links.
Manage all your Google Ads metrics via a direct connection to Google Ads API

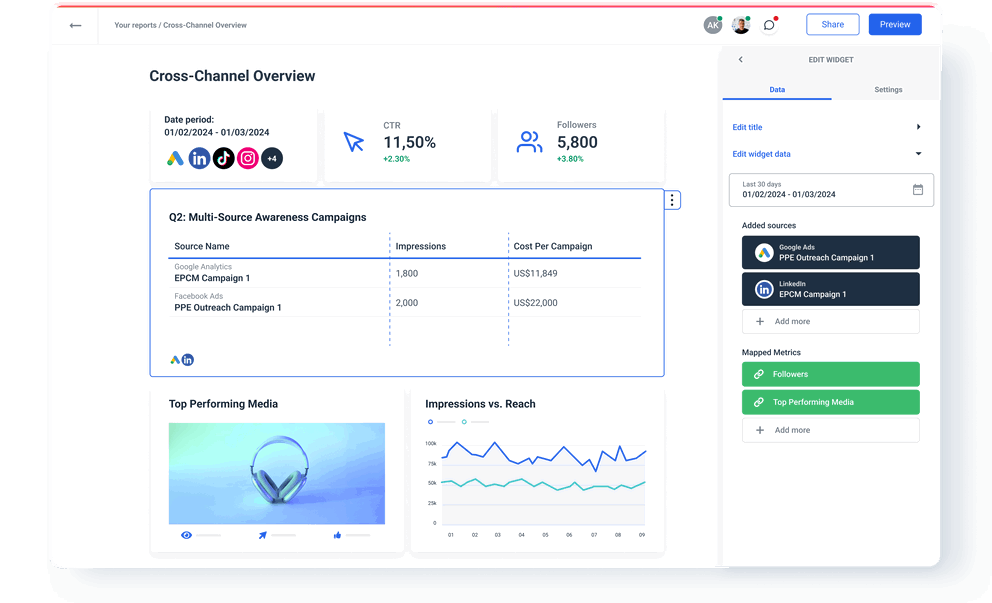
Blend & present your Google Ads campaign performance data with insights from other paid ads channels
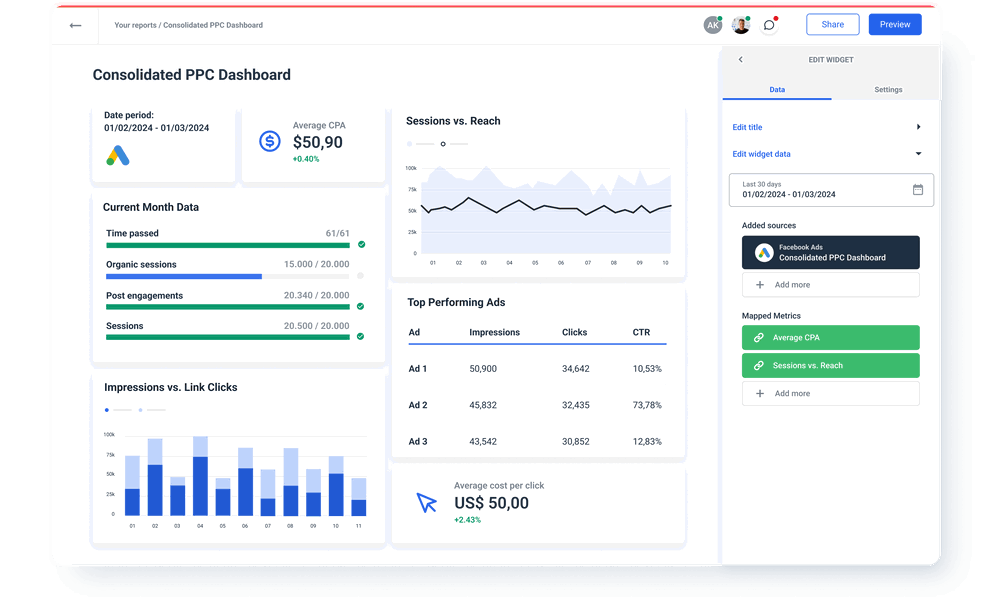
Google Ads data available instantly in Whatagraph
All
Report types
50Google Ads Campaign
173Search...

Customer
Campaign
Ad group
Ad group ad
Gender view
Geographic view
Ad group audience view
Ad group ad asset view
Ad schedule view
Age range view
Bidding strategy
Campaign audience view
Campaign bid modifier
Campaign budget
Click view
Conversion action
Detail placement view
Display keyword view
Distance view
Dynamic search ads search term view
Expanded landing page view
Extension feed item
Feed item
Feed placeholder view
Group placement view
Hotel group view
Hotel performance view
Income range view
Keyword view
Landing page view
Location view
Managed placement view
Paid organic search term view
Parental status view
Product group view
Search term view
Shopping performance view
Topic view
User location view
Video
Ad group asset
Asset field type view
Campaign asset
Customer asset
Smart campaign search term view
Webpage view
Asset group product group view
Hotel reconciliation
Ad group ad asset combination view
Campaign group
Absolute top impression percentage
Active view ctr
Clicks
Ctr
Impressions
Active view cpm
Active view impressions
All conversions
Average cost
Average cpc
Average cpe
Conversions
Cost
Cost per all conversions
Cost per conversion
All conversions from store visit
All conversions from store website
All conversions value
Average cpm
Conversions value
Cross device conversions
Value per all conversions
Value per conversion
Current model attributed conversions
Interaction rate
Interactions
Active view measurability
Current model attributed conversions value
Current model attributed conversions value per cost
Search click share
Search top impression share
Top impression percentage
Value per current model attributed conversion
Active view measurable cost
Active view measurable impressions
Active view viewability
All conversions from click to call
All conversions from directions
Bounce rate
All conversions from interactions rate
All conversions from menu
All conversions from order
All conversions from other engagement
Average cpv
Average page views
Average time on site
Content budget lost impression share
Content impression share
Content rank lost impression share
Conversion last conversion date
Conversion last received request date time
Conversions from interactions rate
Cost per current model attributed conversion
Current model attributed conversions from interactions rate
Current model attributed conversions from interactions value per interaction
All conversions by conversion date
All conversions value by conversion date
Conversions by conversion date
Conversions value by conversion date
Optimization score uplift
Optimization score url
Sk ad network conversions
Value per all conversions by conversion date
Value per conversions by conversion date
Auction insight search absolute top impression percentage
Auction insight search impression share
Auction insight search outranking share
Auction insight search overlap rate
Auction insight search position above rate
Auction insight search top impression percentage
Biddable app install conversions
Biddable app post install conversions
Commission commission rate
Maximize conversions target cpa
Percent cpc cpc bid ceiling
Target cpa cpc bid ceiling
Target cpa cpc bid floor
Target cpa target cpa
Target impression share cpc bid ceiling
Target impression share location fraction
Target roas cpc bid ceiling
Target roas cpc bid floor
Target spend cpc bid ceiling
Target spend target spend
Maximize conversion value cpc bid ceiling
Maximize conversion value cpc bid floor
Maximize conversions cpc bid ceiling
Maximize conversions cpc bid floor
Amount
Recommended budget amount
Recommended budget estimated change weekly cost
Total amount
All conversions from location asset click to call
All conversions from location asset directions
All conversions from location asset menu
All conversions from location asset order
All conversions from location asset other engagement
All conversions from location asset store visits
All conversions from location asset website
Eligible impressions from location asset store reach
View through conversions from location asset click to call
View through conversions from location asset directions
View through conversions from location asset menu
View through conversions from location asset order
View through conversions from location asset other engagement
View through conversions from location asset store visits
View through conversions from location asset website
Publisher organic clicks
Publisher purchased clicks
Publisher unknown clicks
Average target cpa micros
Average target roas
All new customer lifetime value
New customer lifetime value
Average cart size
Average order value
Cost of goods sold
Cross sell cost of goods sold
Cross sell gross profit
Cross sell revenue
Cross sell units sold
Gross profit margin
Gross profit
Lead cost of goods sold
Lead gross profit
Lead revenue
Lead units sold
Orders
Revenue
Sk ad network installs
Sk ad network total conversions
Units sold
Average impression frequency per user
Unique users
Engagement rate
Engagements
Gmail forwards
Gmail saves
Gmail secondary clicks
Interaction event types
Invalid click rate
Invalid clicks
Percent new visitors
Phone calls
Phone impressions
Phone through rate
Relative ctr
Search absolute top impression share
Search budget lost absolute top impression share
Search budget lost impression share
Search budget lost top impression share
Search exact match impression share
Search impression share
Search rank lost absolute top impression share
Search rank lost impression share
Search rank lost top impression share
Video quartile p100 rate
Video quartile p25 rate
Video quartile p50 rate
Video quartile p75 rate
Video view rate
Video views
View through conversions
Check out related integrations:


Explore marketing automation and custom report features


Frequently Asked Questions
Do I need Looker Studio to visualize Google Ads data?
No, you don’t need Looker Studio (Google Data Studio) or any other tool to visualize your Google Ads data. Whatagraph is an all-in-one marketing data platform to connect, organize, visualize, and share all your data. This makes Whatagraph a better choice than other data platforms that provide only the connection or ETL functionality, requiring users to use a separate visualization tool.
How to connect Google Ads data to Whatagraph?
Whatagraph has a pre-built Google Ads connector, so you don’t have to purchase and configure third-party data connectors. Adding a new Google Ads source is simple:
1. Go to the Data Sources menu and locate Google Ads among the channels.
2. Click Connect an account.
3. From there, you’ll be redirected to log in to your Google Ads manager account.
4. Once forwarded to Google, choose to trust Whatagraph to access your account.
5. The new Google Ads source will appear.
You have successfully created a connection to your Google Ads API. Create a custom report or dashboard and add your Google Ads account as a source.
When you connect Google Ads data to Whatagraph, you can organize datasets to get more granular insights by device, campaign ID, date, etc. You can visualize data in various widgets and share the insights via automated email attachments or live links for near real-time access.
Can I export data from Google Ads reports?
Yes, you can export data from both individual widgets and whole reports as Excel spreadsheets or CSV files.
What other marketing data sources can I connect with Whatagraph?
You can connect a variety of popular marketing platforms like Google Analytics 4, social media like Facebook and Instagram, online advertising platforms like Facebook Ads, Microsoft Advertising, Amazon Ads, and Criteo, CRMs like Salesforce and HubSpot, SEO tools like Ahrefs and Google Search Console, as well as email marketing and ecommerce platforms.
What is the difference between data connectors and fully managed Whatagraph integrations?
A data connector is a piece of software, typically built by a third party, to connect two different platforms.
On the other hand, Whatagraph’s integration directly connects to Google Ads API with no third-party software in the middle. As a result, the data flow is more stable and secure, and the connection performance doesn’t depend on the policies of third-party vendors.


What others think about Whatagraph
I made a switch from GDS and Sheets for reporting to Whatagraph, and I am saving literal hours each week on performance report creation. Our small firm actually managed to onboard 2 new clients as a result of all the time we saved on managing data and reporting. The customer service is also really helpful and easy to reach.

Capterra verified review by
Mindaugas S., Marketing Consultant
Having active customer support to help fix any issues was a big contributor, but we also really liked the ability to save templates and connect sources to multiple charts/widgets at once without having to edit them individually. And having the grid layout is much easier to stay consistent with than the free form setup that Data Studio has.

Capterra verified review by
Nico T., Media Planner
The system has standard templates that are easy and fast to use. Also you can build your own report with lightning speed. It is very easy to use, has a lot of integration, and let get started very fast.

Capterra verified review by
Rasmus Bernt K., External Senior Management Consultant
We love Whatagraph - we would definitely recommend and our account manager is great! I love how easy this tool is to use, everyone on the team finds it much more user-friendly than other dashboards. Integration was easy, we sent some example reports to the team who duplicated these for us. We literally had to log in and send it to our clients!

Capterra verified review by
Stephanie S., Digital Director
We are showing our clients the work that we're doing for them and this is incredibly important for our clients ROI. They want to see results and having a tool like Whatagraph that can show data from virtually every source we use is hugely important.

Capterra verified review by
John S., SEO Strategist
The tool is easy to use; you do not need to have development resources. Even my junior project managers are capable of making campaign reports in minutes. There are a lot of pre-made templates you can use as well as many pre-made widgets.

Capterra verified review by
Erman E., Marketing Specialist
Really easy to connect data sources within the tool. The library of report templates has been helpful. The customer support team has been responsive to all of our needs. Our team enjoys the simplicity of setting up the reports and how the data is presented.

Capterra verified review by
Brent N., Director of Operations
Easy to create really beautiful graphs and reports which can help other team members to understand the most important takeaways. I especially like the automated report function, so I don't have to check on the same thing repeatedly.

Capterra verified review by
Orsolya S., Online Marketing Manager