TikTok Ads Integration
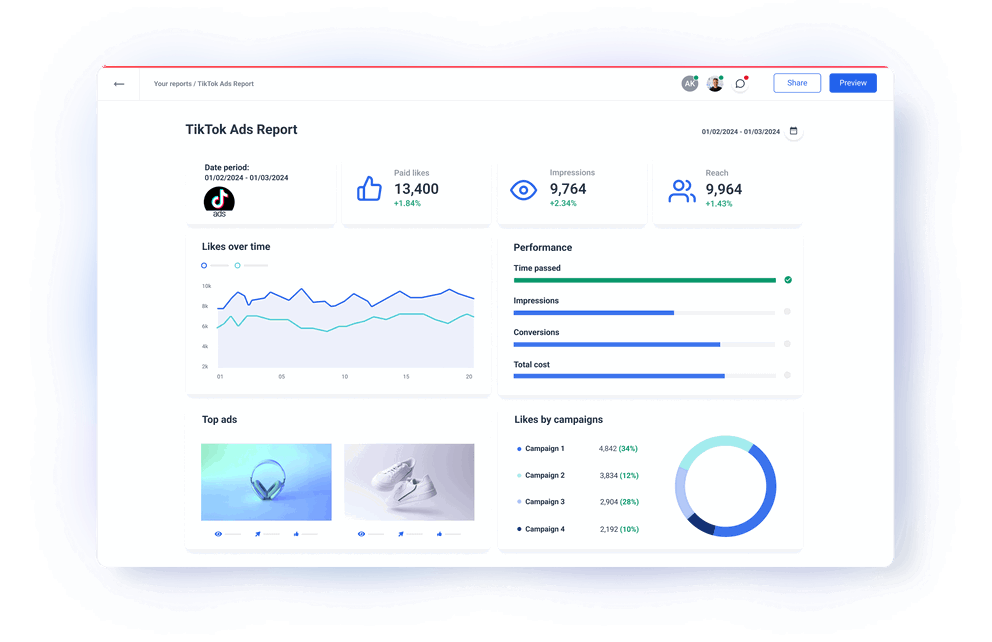
Connect your TikTok Ads data and use Whatagraph’s advanced visualization to analyze and share the performance of your TikTok Ads campaigns. A fully managed TikTok Ads integration pulls data directly from your TikTok Ads account to our stunning custom reports. Blend and organize TikTok Ads metrics before visualization to present only the most impactful data points. Share insights from your marketing data automatically as scheduled emails or live links.


Manage all your TikTok Ads metrics via a direct connector to TikTok Ads API

Pull your campaign performance data directly from your TikTok Ads account
TikTok Ads metrics available instantly in Whatagraph
All
TikTok Ads Universal
3TikTok Ads Basic Data
26TikTok Ads Engagement
22TikTok Ads Video Play
8TikTok Ads Attribution
13Search...

Impressions
Clicks
Spend
Total Cost
CPC
CPM
CTR (%)
Reach
Cost per 1,000 people reached
Conversion
CPA
CVR (%)
Real-time Conversions
Real-time CPA
Real-time CVR (%)
Result
Cost Per Result
Result Rate (%)
Real-time Result
Real-time Cost Per Result
Real-time Result Rate (%)
Secondary Goal Result
Cost per Secondary Goal Result
Secondary Goal Result Rate (%)
Frequency
Campaign Budget
Ad Group Budget
Gross Impressions (Includes Invalid Impressions)
Profile Visit
Profile Visit Rate
Paid Likes
Paid Comments
Paid Follows
Clicks on music
Total Engagement
Engagement Rate
Duet Clicks
Stitch Clicks
Sound Usage Clicks
Anchor Clicks
Anchor Click Rate
Clicks on hashtag challenge
Instant Experience Average View Time
Instant Experience Average View Percentage
Instant Experience Video Component Views
Instant Experience Video Component Views at 25%
Instant Experience Video Component Views at 50%
Instant Experience Video Component Views at 75%
Instant Experience Video Component Views at 100%
Average View Time per Instant Experience Video Component
Video Views
2-Second Video Views
6-Second Video Views
Video Average Watch Time Per Video View
Video Views at 25%
Video Views at 50%
Video Views at 75%
Video Views at 100%
VTA Conversions
Cost per VTA Conversion
VTA Registration
Cost per VTA Registration
Cost per VTA Purchase
CTA Conversions
Cost per CTA Conversion
CTA Registration
Cost per CTA Registration
CTA Purchase
Cost per CTA Purchase
Cost per VTA App Install
Cost per CTA App Install
Real-time App Install
Cost per Real-time App Install
App Install
Cost per App Install
Cost per Unique Registration
Registration Rate (%)
Unique Purchase
Cost per Unique Purchase
Purchase Rate (%)
Unique Add to Cart
Add to Cart Rate (%)
Unique Checkout
Cost per Unique Checkout
Checkout Rate (%)
Unique View Content
Cost per Unique View Content
View Content Rate (%)
Unique Day 2 Retention
Cost per Unique Day 2 Retention
Day 2 Retention Rate (%)
Unique Add Payment Info
Cost per Unique Add Payment Info
Add Payment Info Rate (%)
Unique Add to Wishlist
Cost per Unique Add to Wishlist
Add to Wishlist Rate (%)
Unique Launch App
Cost per Unique Launch App
Launch App Rate (%)
Unique Complete Tutorial
Cost per Unique Complete Tutorial
Complete Tutorial Rate (%)
Unique Create Group
Cost per Unique Create Group
Create Group Rate (%)
Unique Join Group
Cost per Unique Join Group
Join Group Rate (%)
Unique Create Role
Cost per Unique Create Role
Create Role Rate (%)
Unique Spend Credit
Cost per Unique Spend Credit
Spend Credit Rate (%)
Unique Achieve Level
Cost per Unique Achieve Level
Achieve Level Rate (%)
Unique Unlock Achievement
Cost per Unique Unlock Achievement
Unlock Achievement Rate (%)
Unique Generate Lead
Cost per Unique Generate Lead
Generate Lead Rate (%)
Unique In App Ad Click
Cost per Unique In App Ad Click
In App Ad Click Rate (%)
Unique In App Ad Impr
Cost per Unique In App Ad Impr
In App Ad Impr Rate (%)
Unique Loan Apply
Cost per Unique Loan Apply
Loan Apply Rate (%)
Unique Loan Approval
Cost per Unique Loan Approval
Loan Approval Rate (%)
Unique Loan Disbursement
Cost per Unique Loan Disbursement
Loan Disbursement Rate (%)
Unique Login
Cost per Unique Login
Login Rate (%)
Unique Rate
Cost per Unique Rate
Rate Rate (%)
Unique Search
Cost per Unique Search
Search Rate (%)
Unique Start Trial
Cost per Unique Start Trial
Start Trial Rate (%)
Unique Subscribe
Cost per Unique Subscribe
Subscribe Rate (%)
Registration (Total No.)
Cost per Registration
Purchase (Total No.)
Cost per Purchase
Total Purchase Value
Purchase ROAS
Add to Cart (Total No.)
Cost per Add to Cart
Value per Add to Cart
Total Add to Cart Value
Checkout (Total No.)
Cost per Checkout
Value per Checkout
Total Checkout Value
View Content (Total No.)
Cost per View Content
Value per View Content
Total View Content Value
Day 2 Retention (Total No.)
Cost per Day 2 Retention
Add Payment Info (Total No.)
Cost per Add Payment Info
Add to Wishlist (Total No.)
Cost per Add to Wishlist
Value per Add to Wishlist
Total Add to Wishlist Value
Launch App (Total No.)
Cost per Launch App
Complete Tutorial (Total No.)
Cost per Complete Tutorial
Value per Complete Tutorial
Total Complete Tutorial Value
Create Group (Total No.)
Cost per Create Group
Value per Create Group
Total Create Group Value
Join Group (Total No.)
Cost per Join Group
Value per Join Group
Total Join Group Value
Create Role (Total No.)
Cost per Create Role
Value per Create Role
Total Create Role Value
Spend Credit (Total No.)
Cost per Spend Credit
Value per Spend Credit
Total Spend Credit Value
Achieve Level (Total No.)
Cost per Achieve Level
Value per Achieve Level
Total Achieve Level Value
Unlock Achievement (Total No.)
Cost per Unlock Achievement
Value per Unlock Achievement
Total Unlock Achievement Value
Generate Lead (Total No.)
Cost per Generate Lead
Value per Generate Lead
Total Generate Lead Value
In App Ad Click (Total No.)
Cost per In App Ad Click
Value per In App Ad Click
Total In App Ad Click Value
In App Ad Impr (Total No.)
Cost per In App Ad Impr
Value per In App Ad Impr
Total In App Ad Impr Value
Loan Apply (Total No.)
Cost per Loan Apply
Loan Approval (Total No.)
Cost per Loan Approval
Loan Disbursement (Total No.)
Cost per Loan Disbursement
Login (Total No.)
Cost per Login
Rate (Total No.)
Value per Rate
Total Rate Value
Search (Total No.)
Cost per Search
Start Trial (Total No.)
Cost per Start Trial
Subscribe (Total No.)
Cost per Subscribe
Value per Subscribe
Total Subscribe Value
App Install (SKAN)
Cost per App Install (SKAN)
Unique Registration (SKAN)
Cost per Unique Registration (SKAN)
Unique Purchase (SKAN)
Cost per Unique Purchase (SKAN)
Purchase Rate (%) (SKAN)
Unique Add to Cart (SKAN)
Cost per Unique Add to Cart (SKAN)
Add to Cart Rate (%) (SKAN)
Unique Checkout (SKAN)
Cost per Unique Checkout (SKAN)
Checkout Rate (%) (SKAN)
Unique View Content (SKAN)
Cost per Unique View Content (SKAN)
View Content Rate (%) (SKAN)
Unique Add Payment Info (SKAN)
Cost per Unique Add Payment Info (SKAN)
Add Payment Info Rate (%) (SKAN)
Unique Add to Wishlist (SKAN)
Cost per Unique Add to Wishlist (SKAN)
Add to Wishlist Rate (%) (SKAN)
Unique Launch App (SKAN)
Cost per Unique Launch App (SKAN)
Launch App Rate (%) (SKAN)
Unique Complete Tutorial (SKAN)
Cost per Unique Complete Tutorial (SKAN)
Complete Tutorial Rate (%) (SKAN)
Unique Create Group (SKAN)
Cost per Unique Create Group (SKAN)
Create Group Rate (%) (SKAN)
Unique Join Group (SKAN)
Cost per Unique Join Group (SKAN)
Join Group Rate (%) (SKAN)
Unique Create Role (SKAN)
Cost per Unique Create Role (SKAN)
Create Role Rate (%) (SKAN)
Unique Spend Credit (SKAN)
Cost per Unique Spend Credit (SKAN)
Spend Credit Rate (%) (SKAN)
Unique Achieve Level (SKAN)
Cost per Unique Achieve Level (SKAN)
Achieve Level Rate (%) (SKAN)
Unique Unlock Achievement (SKAN)
Cost per Unique Unlock Achievement (SKAN)
Unlock Achievement Rate (%) (SKAN)
Unique Generate Lead (SKAN)
Cost per Unique Generate Lead (SKAN)
Generate Lead Rate (%) (SKAN)
Unique In App Ad Click (SKAN)
Cost per Unique In App Ad Click (SKAN)
In App Ad Click Rate (%) (SKAN)
Unique In App Ad Impr (SKAN)
Cost per Unique In App Ad Impr (SKAN)
In App Ad Impr Rate (%) (SKAN)
Unique Loan Apply (SKAN)
Cost per Unique Loan Apply (SKAN)
Loan Apply Rate (%) (SKAN)
Unique Loan Approval (SKAN)
Cost per Unique Loan Approval (SKAN)
Loan Approval Rate (%) (SKAN)
Unique Loan Disbursement (SKAN)
Cost per Unique Loan Disbursement (SKAN)
Loan Disbursement Rate (%) (SKAN)
Unique Login (SKAN)
Cost per Unique Login (SKAN)
Login Rate (%) (SKAN)
Unique Rate (SKAN)
Cost per Unique Rate (SKAN)
Rate Rate (%) (SKAN)
Unique Search (SKAN)
Cost per Unique Search (SKAN)
Search Rate (%) (SKAN)
Unique Start Trial (SKAN)
Cost per Unique Start Trial (SKAN)
Start Trial Rate (%) (SKAN)
Unique Subscribe (SKAN)
Cost per Unique Subscribe (SKAN)
Subscribe Rate (%) (SKAN)
App Installs (SKAN Privacy Withheld)
Purchase ROAS (SKAN)
Total Registration (SKAN)
Cost per Registration (SKAN)
Total Purchase (SKAN)
Cost per Purchase (SKAN)
Total Add to Cart (SKAN)
Cost per Add to Cart (SKAN)
Total Add to Cart Value (SKAN)
Total Checkout (SKAN)
Cost per Checkout (SKAN)
Total Checkout Value (SKAN)
Total View Content (SKAN)
Cost per View Content (SKAN)
Total View Content Value (SKAN)
Total Add Payment Info (SKAN)
Cost per Add Payment Info (SKAN)
Total Add to Wishlist (SKAN)
Cost per Add to Wishlist (SKAN)
Total Add to Wishlist Value (SKAN)
Total Launch App (SKAN)
Cost per Launch App (SKAN)
Total Complete Tutorial (SKAN)
Cost per Complete Tutorial (SKAN)
Total Complete Tutorial Value (SKAN)
Total Create Group (SKAN)
Cost per Create Group (SKAN)
Total Create Group Value (SKAN)
Total Join Group (SKAN)
Cost per Join Group (SKAN)
Total Join Group Value (SKAN)
Total Create Role (SKAN)
Cost per Create Role (SKAN)
Total Create Role Value (SKAN)
Total Spend Credit (SKAN)
Cost per Spend Credit (SKAN)
Total Spend Credit Value (SKAN)
Total Achieve Level (SKAN)
Cost per Achieve Level (SKAN)
Total Achieve Level Value (SKAN)
Total Unlock Achievement (SKAN)
Cost per Unlock Achievement (SKAN)
Total Unlock Achievement Value (SKAN)
Total Generate Lead (SKAN)
Cost per Generate Lead (SKAN)
Total Generate Lead Value (SKAN)
Total In App Ad Click (SKAN)
Cost per In App Ad Click (SKAN)
Total In App Ad Click Value (SKAN)
Total In App Ad Impr (SKAN)
Cost per In App Ad Impr (SKAN)
Total In App Ad Impr Value (SKAN)
Total Loan Apply (SKAN)
Cost per Loan Apply (SKAN)
Total Loan Approval (SKAN)
Cost per Loan Approval (SKAN)
Total Loan Disbursement (SKAN)
Cost per Loan Disbursement (SKAN)
Total Login (SKAN)
Cost per Login (SKAN)
Total Rate (SKAN)
Cost per Rate (SKAN)
Total Rate Value (SKAN)
Total Search (SKAN)
Cost per Search (SKAN)
Total Start Trial (SKAN)
Cost per Start Trial (SKAN)
Total Subscribe (SKAN)
Cost per Subscribe (SKAN)
Total Subscribe Value (SKAN)
Unique Custom App Event
Cost per Unique Custom App Event
Custom App Event Rate (%)
Total Custom App Event
Value per Custom App Event
Total Custom App Event Value
Result (SKAN)
Cost Per Result (SKAN)
Result Rate (%) (SKAN)
Conversion (SKAN)
CVR (%) (SKAN)
Conversions (SKAN click time)
CPA (SKAN click time)
CVR (SKAN click time)
Complete Payment ROAS
Complete Payment
Complete Payment Cost
Complete Payment Rate (%)
Total Complete Payment Value
Page Browse
Page Browse Cost
Page Browse Rate (%)
Value per Page Browse
Total Page Browse Value
Button Click
Button Click Cost
Button Click Rate (%)
Value per Button Click
Total Button Click Value
Online Consultation
Online Consultation Cost
Online Consultation Rate (%)
Value per Online Consultation
Total Online Consultation Value
User Registration
User Registration Cost
User Registration Rate (%)
Value per User Registration
Total User Registration Value
Product Details Page Browse
Product Details Page Browse Cost
Product Details Page Browse Rate (%)
Value per Product Details Page Browse
Total Product Details Page Browse Value
Add to Cart
Add to Cart Cost
Place an Order
Place an Order Cost
Place an Order Rate (%)
Value per Place an Order
Total Place an Order Value
Details Page Browse (Form)
Details Page Browse (Form) Cost
Details Page Browse (Form) Rate (%)
Value per Details Page Browse (Form)
Total Details Page Browse (Form) Value
Button Click (Form)
Button Click (Form) Cost
Button Click (Form) Rate (%)
Value per Button Click (Form)
Total Button Click (Form) Value
Form Submission
Form Submission Cost
Form Submission Rate (%)
Value per Form Submission
Total Form Submission Value
Details Page Browse (Consultation)
Details Page Browse (Consultation) Cost
Details Page Browse (Consultation) Rate (%)
Value per Details Page Browse (Consultation)
Total Details Page Browse (Consultation) Value
Button Click (Consultation)
Button Click (Consultation) Cost
Button Click (Consultation) Rate (%)
Value per Button Click (Consultation)
Total Button Click (Consultation) Value
Consultation
Consultation Cost
Consultation Rate (%)
Value per Consultation
Total Consultation Value
Details Page Browse (App Download)
Details Page Browse (App Download) Cost
Details Page Browse (App Download) Rate (%)
Value per Details Page Browse (App Download)
Total Details Page Browse (App Download) Value
Button Click (App Download)
Button Click (App Download) Cost
Button Click (App Download) Rate (%)
Value per Button Click (App Download)
Total Button Click (App Download) Value
Download Button Click
Download Button Click Cost
Download Button Click Rate (%)
Value per Download Button Click
Total Download Button Click Value
Initiate Checkout
Initiate Checkout Cost
Initiate Checkout Rate (%)
Value per Initiate Checkout
Total Initiate Checkout Value
Add Billing
Add Billing Cost
Add Billing Rate (%)
Value per Add Billing
Total Add Billing Value
Search
Search Cost
Value per Search
Total Search Value
Total Page View
Cost per Page View
Page View Rate (%)
Value per Page View
Total Page View Value
Total Landing Page View
Cost per Landing Page View
Landing Page View Rate
Total Custom Page Event
Cost per Custom Page Event
Custom Page Event Rate (%)
Value per Custom Page Event
Total Custom Page Event Value
Cost per Call-To-Action Button Clicks (Onsite)
Cost per Page Views (Onsite)
Cost per Product Clicks (Onsite)
Cost per Add Billing (Onsite)
Cost per Add To Wishlist (Onsite)
Cost per App Store Click (Onsite)
Cost per Form Submission (Onsite)
Cost per Initiate Checkout (Onsite)
Cost per Add to Cart (Onsite)
Cost per Product Details Page View (Onsite)
Cost per Complete Payment (Onsite)
Call-to-Action Button Clicks (Instant Experience)
Call-to-Action Button Clicks Rate (Onsite) (%)
Page Views (Onsite)
Page Views Rate (Onsite) (%)
Product Clicks (Instant Experience)
Product Clicks Rate (Onsite) (%)
Total Add Billing (Onsite)
Add Billing Rate (Onsite) (%)
Total Add To Wishlist (Onsite)
Add To Wishlist Rate (Onsite) (%)
Total App Store Click (Onsite)
App Store Click Rate (Onsite) (%)
Total Form Submission (Onsite)
Form Submission Rate (Onsite) (%)
Total Initiate Checkout (Onsite)
Initiate Checkout Rate (Onsite) (%)
Total Add to Cart (Onsite)
Add to Cart Rate (Onsite) (%)
Total Product Details Page View (Onsite)
Product Details Page View Rate (Onsite) (%)
Total Complete Payment (Onsite)
Complete Payment Rate (Onsite) (%)
Complete Payment ROAS (Onsite)
Total Add Billing Value (Onsite)
Total Add To Wishlist Value (Onsite)
Total Form Submission Value (Onsite)
Total Initiate Checkout Value (Onsite)
Total Add to Cart Value (Onsite)
Total Product Details Page View Value (Onsite)
Total Complete Payment Value (Onsite)
Value per Add Billing (Onsite)
Value per Add To Wishlist (Onsite)
Value per Form Submission (Onsite)
Value per Initiate Checkout (Onsite)
Value per Add to Cart (Onsite)
Value per Product Details Page View (Onsite)
Value per Complete Payment (Onsite)
Check out related integrations:


Explore marketing automation and custom report features


Frequently Asked Questions
How to connect TikTok Ads data to Whatagraph?
Whatagraph has a pre-built TikTok Ads connector, so you don’t have to purchase and configure third-party data connectors. Adding a new TikTok Ads source is simple:
1. Go to the Data Sources menu and locate TikTok Ads among the channels.
2. Click Connect an account.
3. From there, you’ll be redirected to login to your TikTok Ads account.
4. Give your TikTok Ads account a name.
5. All done. Create a custom report or dashboard and add your TikTok Ads account as a source.
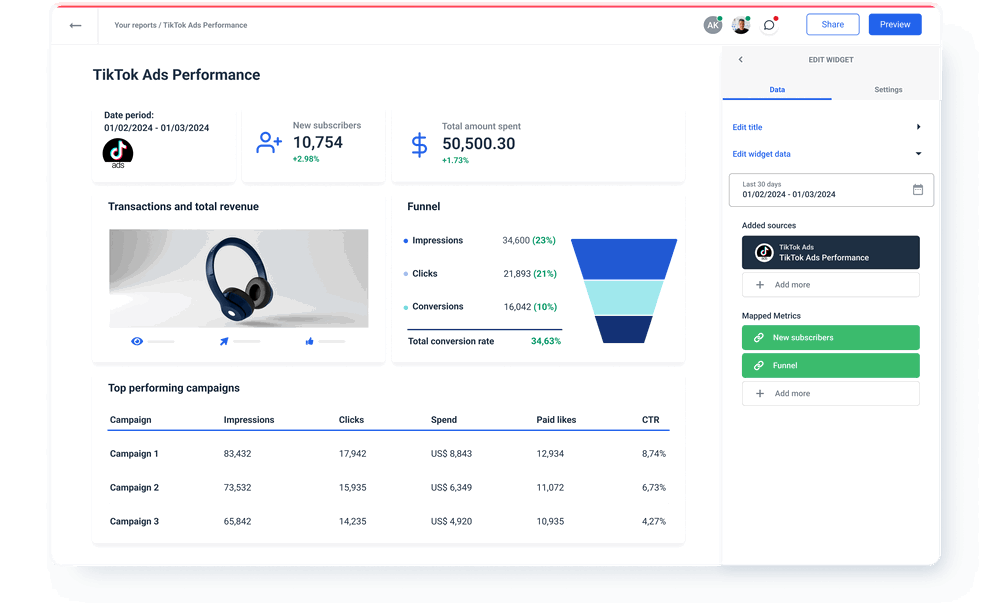
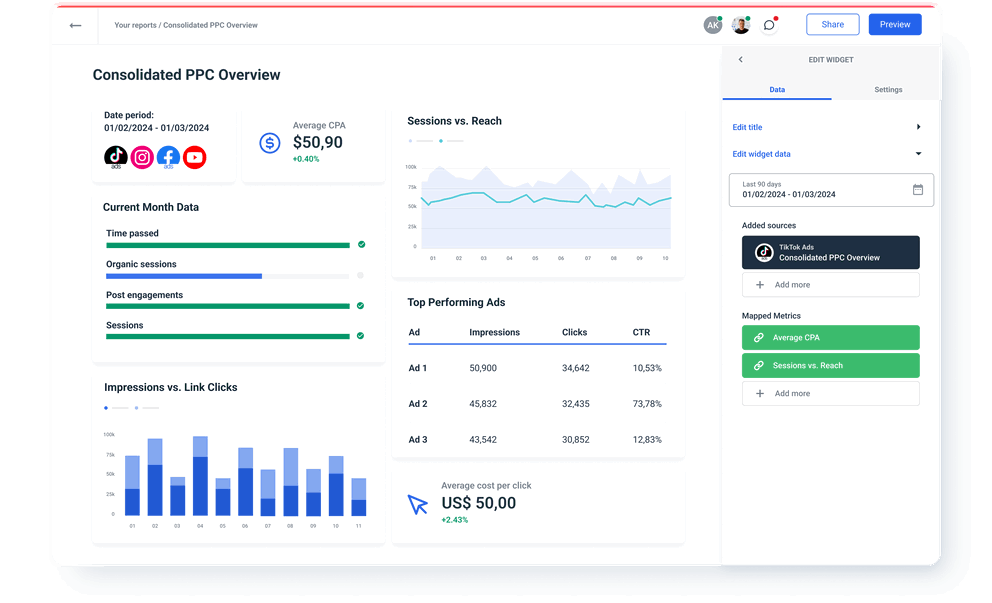
Once you connect TikTok Ads data to Whatagraph, you can organize datasets to get more granular insights by device, campaign ID, date, etc. You can visualize data in various widgets and share the insights via automated email attachments or live links for near real-time access.
Can I export data from TikTok Ads reports?
Yes, you can export data as Excel spreadsheets or CSV files. This way, you can easily move it to Tableau, Power BI, or another business intelligence tool for further analysis.
Do I need Looker Studio to visualize TikTok Ads data?
No, you don’t need Looker Studio (Google Data Studio) or any other tool to visualize your TikTok Ads data. Whatagraph is an all-in-one marketing data platform to connect, organize, visualize, and share all your data. This sets Whatagraph apart from competitors that provide only the connection or ETL functionality. In those cases, users need to use a separate visualization tool for marketing reporting.
Effortlessly create reports and dashboards


What others think about Whatagraph
I made a switch from GDS and Sheets for reporting to Whatagraph, and I am saving literal hours each week on performance report creation. Our small firm actually managed to onboard 2 new clients as a result of all the time we saved on managing data and reporting. The customer service is also really helpful and easy to reach.

Capterra verified review by
Mindaugas S., Marketing Consultant
Having active customer support to help fix any issues was a big contributor, but we also really liked the ability to save templates and connect sources to multiple charts/widgets at once without having to edit them individually. And having the grid layout is much easier to stay consistent with than the free form setup that Data Studio has.

Capterra verified review by
Nico T., Media Planner
The system has standard templates that are easy and fast to use. Also you can build your own report with lightning speed. It is very easy to use, has a lot of integration, and let get started very fast.

Capterra verified review by
Rasmus Bernt K., External Senior Management Consultant
We love Whatagraph - we would definitely recommend and our account manager is great! I love how easy this tool is to use, everyone on the team finds it much more user-friendly than other dashboards. Integration was easy, we sent some example reports to the team who duplicated these for us. We literally had to log in and send it to our clients!

Capterra verified review by
Stephanie S., Digital Director
We are showing our clients the work that we're doing for them and this is incredibly important for our clients ROI. They want to see results and having a tool like Whatagraph that can show data from virtually every source we use is hugely important.

Capterra verified review by
John S., SEO Strategist
The tool is easy to use; you do not need to have development resources. Even my junior project managers are capable of making campaign reports in minutes. There are a lot of pre-made templates you can use as well as many pre-made widgets.

Capterra verified review by
Erman E., Marketing Specialist
Really easy to connect data sources within the tool. The library of report templates has been helpful. The customer support team has been responsive to all of our needs. Our team enjoys the simplicity of setting up the reports and how the data is presented.

Capterra verified review by
Brent N., Director of Operations
Easy to create really beautiful graphs and reports which can help other team members to understand the most important takeaways. I especially like the automated report function, so I don't have to check on the same thing repeatedly.

Capterra verified review by
Orsolya S., Online Marketing Manager