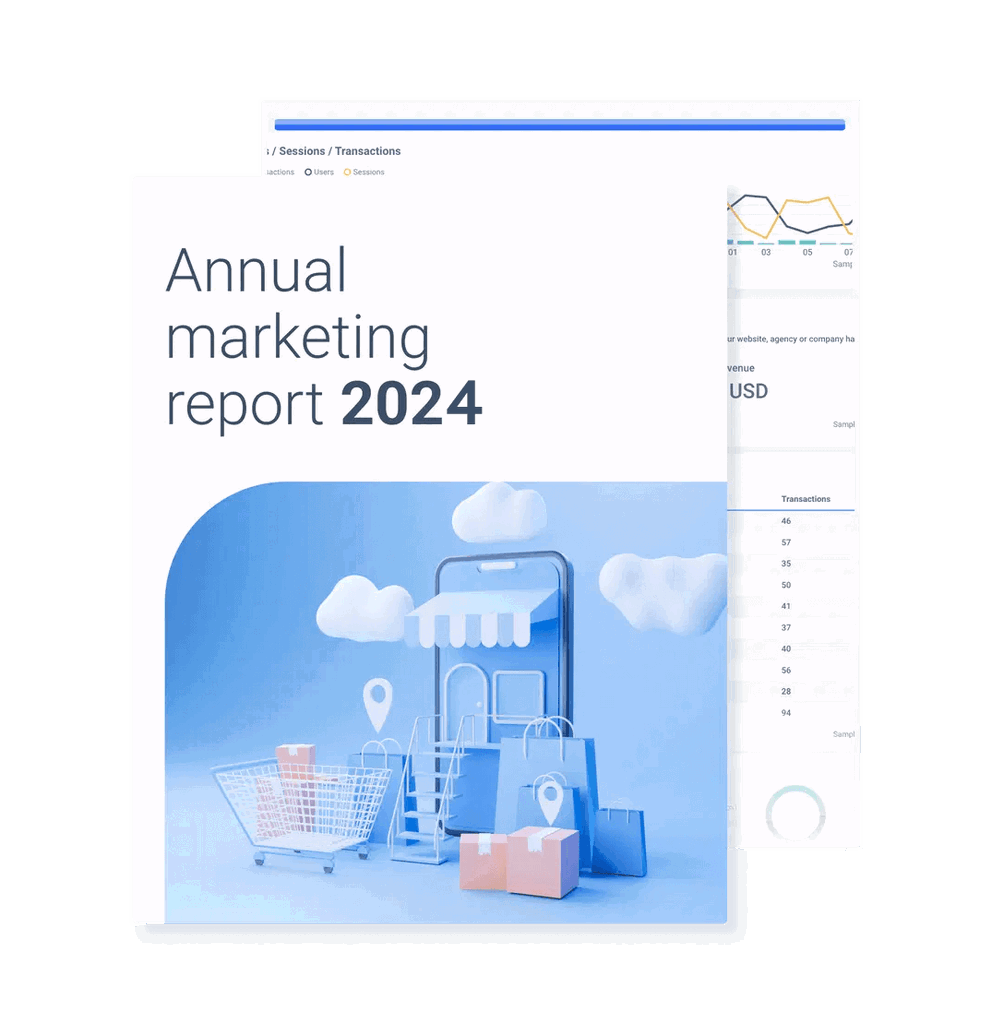
The year’s about to end, and your marketing team is left wondering what’s been accomplished. But rather than guess your way through your marketing goals, you can create an Annual Marketing Report to deliver the milestones and KPIs (key performance indicators) that people need to know.
End of year marketing report is a comprehensive document that organizations prepare at the end of the year to evaluate the performance of their marketing efforts over the past twelve months. This report reveals if they’re meeting their marketing goals, which campaigns worked, and which can be improved, etc.
The only question is: how?
How do you create a comprehensive annual marketing report, and what needs to go into it? Let’s look at the reasons to create your next marketing report, what it needs to include, and tips for making your report as clear as possible. No matter if you’re a CMO or a marketing manager, these guidelines will give you all the info you need.
The Purpose of an Annual Marketing Report
- Defining success. Getting clear about your desired outcomes is vital because it not only helps define the parameters for success but makes it more likely to achieve them. According to a marketing statistics report by CoSchedule, “Goal-setting marketers are 376% more likely to report success.”
- Evaluation. By defining your success, you create a barometer for your team. Did you meet your marketing goals this year? You can’t measure that unless you’ve first established the ground rules.
- Communication. The annual marketing report is fundamentally about communication. You use it to explain what your marketing team has done, what it wants to improve, and the value it created for an organization.
What to Include in an Annual Marketing Report
What you end up including in the report depends a lot on the strategies and platforms you use: social media, SEO and content marketing, email marketing, PPC or something else. However, there are some general items that every good digital marketing annual report needs to have.
1. The Summary of Your Marketing Goals & Strategy
The summary of your marketing strategy and goals should be at the forefront of your marketing report. Even if someone reading your annual marketing report doesn’t read through every detail, this is the page (or pages) that contains the most vital takeaways and explains your company’s direction.
One thing to bear in mind here is that you can’t summarize your marketing activities unless you cut some of the details out for later. The best way to do that is to employ “highlights” that hit at the key points and provide a bird’s-eye view of your actions.
Focus on outlining your yearly marketing goals, how they tie to the overarching business objective and explain the strategy that was employed to achieve them. Don’t forget to paint with a broad brush here – a more detailed look at tactics and KPIs will follow later. Here’s an example of what it could look like: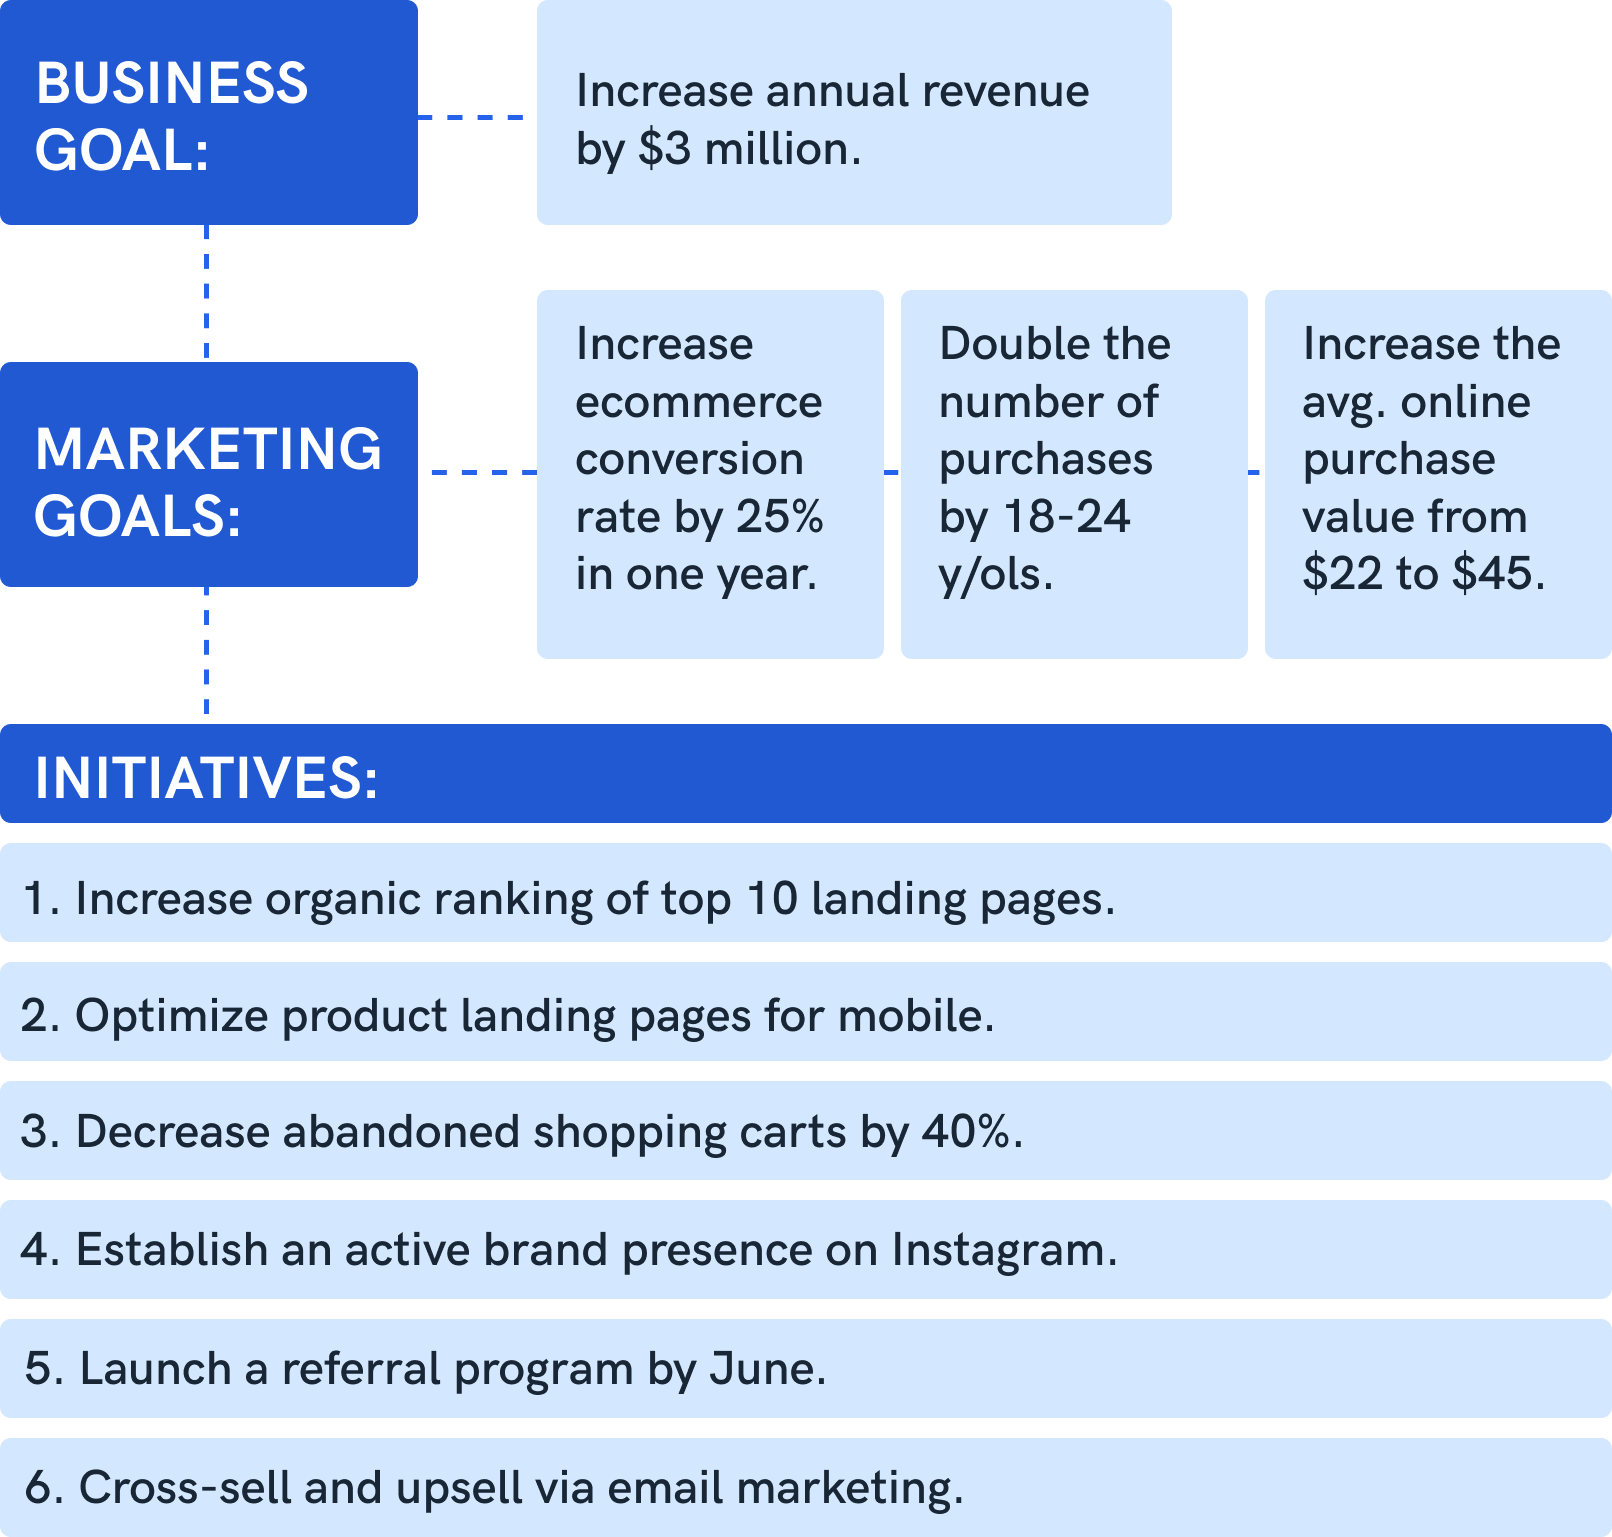
If you’re just getting into the swing of marketing performance reporting, you can also use quarterly goals to establish some baseline for where your marketing currently is if you can’t compare with your last year.
2. KPIs by Which Yearly Performance was Measured
This starts to get into the heart of what your annual marketing report is all about. Now’s the time to display the key numbers that demonstrate where your marketing was targeted all year—as well as the results it generated.
Please note that every business and channel is different. B2B business may focus their marketing efforts on lead generation, whereas ecommerce stores will go after transactions. That’s why when it comes down to metrics and KPIs, there’s no single template that would fit everyone.
Below, however, we’ve outlined some of the broad-level factors that are important to discuss in an annual marketing report, and provide a big-picture overview tailored for CMOs and CEOs:
- Website performance. Getting clear about your desired outcomes is vital because it not only helps define and benchmark the parameters for success but makes it more likely to achieve them. According to a marketing statistics report by CoSchedule, “Goal-setting marketers are 376% more likely to report success.”
KPIs to include: Users, Sessions, New vs Returning users, Page load time, search engine performance (organic traffic), bounce rate. - Audience demographics. How are you doing with particular target segments among your potential customers? Is there a high-performing segment you’re not targeting yet but should consider with your marketing channels? What’s the correlation between your audience demographics and other KPIs?
KPIs to include: Age, Gender, Location, Device category, Conversions. - Channel performance. One of the key things all stakeholders want to know is how all of this impacts the bottom line. Which channels are generating the best marketing results? Which ones could use some closer attention and more optimization? Which landing pages are driving revenue?
KPIs to include: Top acquisition channels, Budget attainment, Return on marketing investment (ROMI), Cost-per-acquisition (CPA), click through rate (CTR), return on investment (ROI). - Social media performance. How are you performing in different social media platforms in the year behind you? This can really set the tone for the coming year. The KPIs you include will depend on the platforms you’re using, e.g. LinkedIn, Instagram, Facebook and others.
KPIs to include: follower growth, return on ad spend (ROAS), audience growth rate, video views, among others.
3. Year-Over-Year Performance
Broaden the scope of your marketing report by comparing some of the most important KPIs to previous years and the marketing campaigns you ran. Make sure to display the percentage of change (when relevant), and color code these changes by category to create an instant impression of where your marketing has improved—and where it still needs to grow.