Performance Dashboard for Visual Analytics

Developing targeted strategies and trying to maximize ROI for your clients? Grab our performance dashboard. Dive deep into vital metrics, key performance indicators, and data analytics to gauge the effectiveness of your clients’ initiatives.

    Best Performance Dashboard for Your Agency
    Join marketing agencies and teams worldwide who use Whatagraph to work with marketing data!
    Ogilvy logo
    n365 logo
    House dentsu logo
    upstick logo
    thrive logo
    Power digital logo
    havas logo
    mc cann logo

    Effortless insights and performance monitoring across your campaigns

    Connect your data sources in a few clicks

    More than 45 fully-managed dashboard integrations with social, paid advertising, email SEO, CRM, and other marketing sources to bring all your data to one place. Connect any source in a few clicks and manage all the connected sources and channels in a single hub. 

    SVG image
    Connect your data sources in a few clicks

    Visualize the business performance metrics and KPIs

    Use Whatagraph’s data visualization functionality and display business performance metrics and KPIs. Use tables and graphs to immediately spot trends and patterns in clients’ performance management. Track revenue growth, profits, or client retention rate and determine areas for optimization. Identify the channels and campaigns that need extra work with our performance dashboard.

    SVG image
    Visualize the business performance metrics and KPIs

    Cross-channel insights from e-commerce and marketing platforms

    Present a high-level look at your client’s key e-commerce and marketing metrics. Whatagraph enables cross-platform reporting, that allows you to compare and track dashboard metrics from multiple different data sources. Track conversions, CTR, or other KPIs and learn which platforms perform the best. Connect your client’s data sources to Whatagraph and display your performance results with our stunning dashboards. 

    SVG image
    Cross-channel insights from e-commerce and marketing platforms

    All dashboard features your agency needs

    45+ data sources
    45+ data sources
    Create a true cross-channel digital marketing dashboard in Whatagraph. Over 45 integrations for your cross-channel marketing campaigns.
    Live dashboards
    Live dashboards
    Securely share interactive access to your dashboard at any time from anywhere.
    Cross-channel insights
    Cross-channel insights
    Include data from different sources into the same widgets or reports with a few clicks. Provide a full picture of your campaigns’ success.
    White-label dashboards
    White-label dashboards
    Customize colors and logos in each dashboard to align it with your agency’s or clients’ branding and style.
    Request Free 7-day Trial

    No credit card required

    Complete sharing automation

    Share the performance dashboard via a live link so clients or stakeholders can always check the latest developments. A live link for on-demand access adds a layer of transparency to the client-agency relationship and saves time on both ends, as the clients don’t have to request a report every time they need to see the data. Now, they can directly check the results of your hard work any time they want.

    SVG image
    Automate dashboard sharing in Whatagraph

    Protect each dashboard with a password

    The live dashboard sharing removes the barriers between clients or stakeholders and their data. However, an easy-to-share link shouldn’t fall into the wrong hands. Whatagraph allows you to protect every performance dashboard with a password, guaranteeing that only personnel with permission can access and analyze your data.

    SVG image
    Protect each Whatagraph dashboard with a password

    Fully customized dashboard design

    Customize your performance dashboard to match your or your client’s branding. Completely remove the Whatagraph name and logo from your dashboard and proudly present your agency’s name, logo, brand colors, and text style. Each Whatagraph dashboard is customizable to become a part of your overall user experience. On higher pricing plans, you can also host the dashboard on your custom domain.

    SVG image
    Fully customized dashboards in Whatagraph

    Other Dashboard Examples

    View all dashboard examples

    No credit card required

    Sales Performance Dashboard
    Sales Performance Dashboard
    Sales performance metrics that you can act on are always within reach with Whatagraph’s Sales Performance Dashboard. Bolster your business' processes using the latest data from your sales platforms.
    View template
    Metrics Dashboard
    Metrics Dashboard
    Use Whatagraph’s real-time Metrics Dashboard to show your clients’ performance across different platforms. Gather your most important KPIs in one place and analyze your overall campaign performance, conversion rate, revenue, and more.
    View template
    Advertising Dashboard
    Advertising Dashboard
    Easily connect and aggregate data from multiple advertising sources with our Advertising Dashboard. See all of your advertising performance in a single place, complete with ad spend and the ROAS generated.
    View template

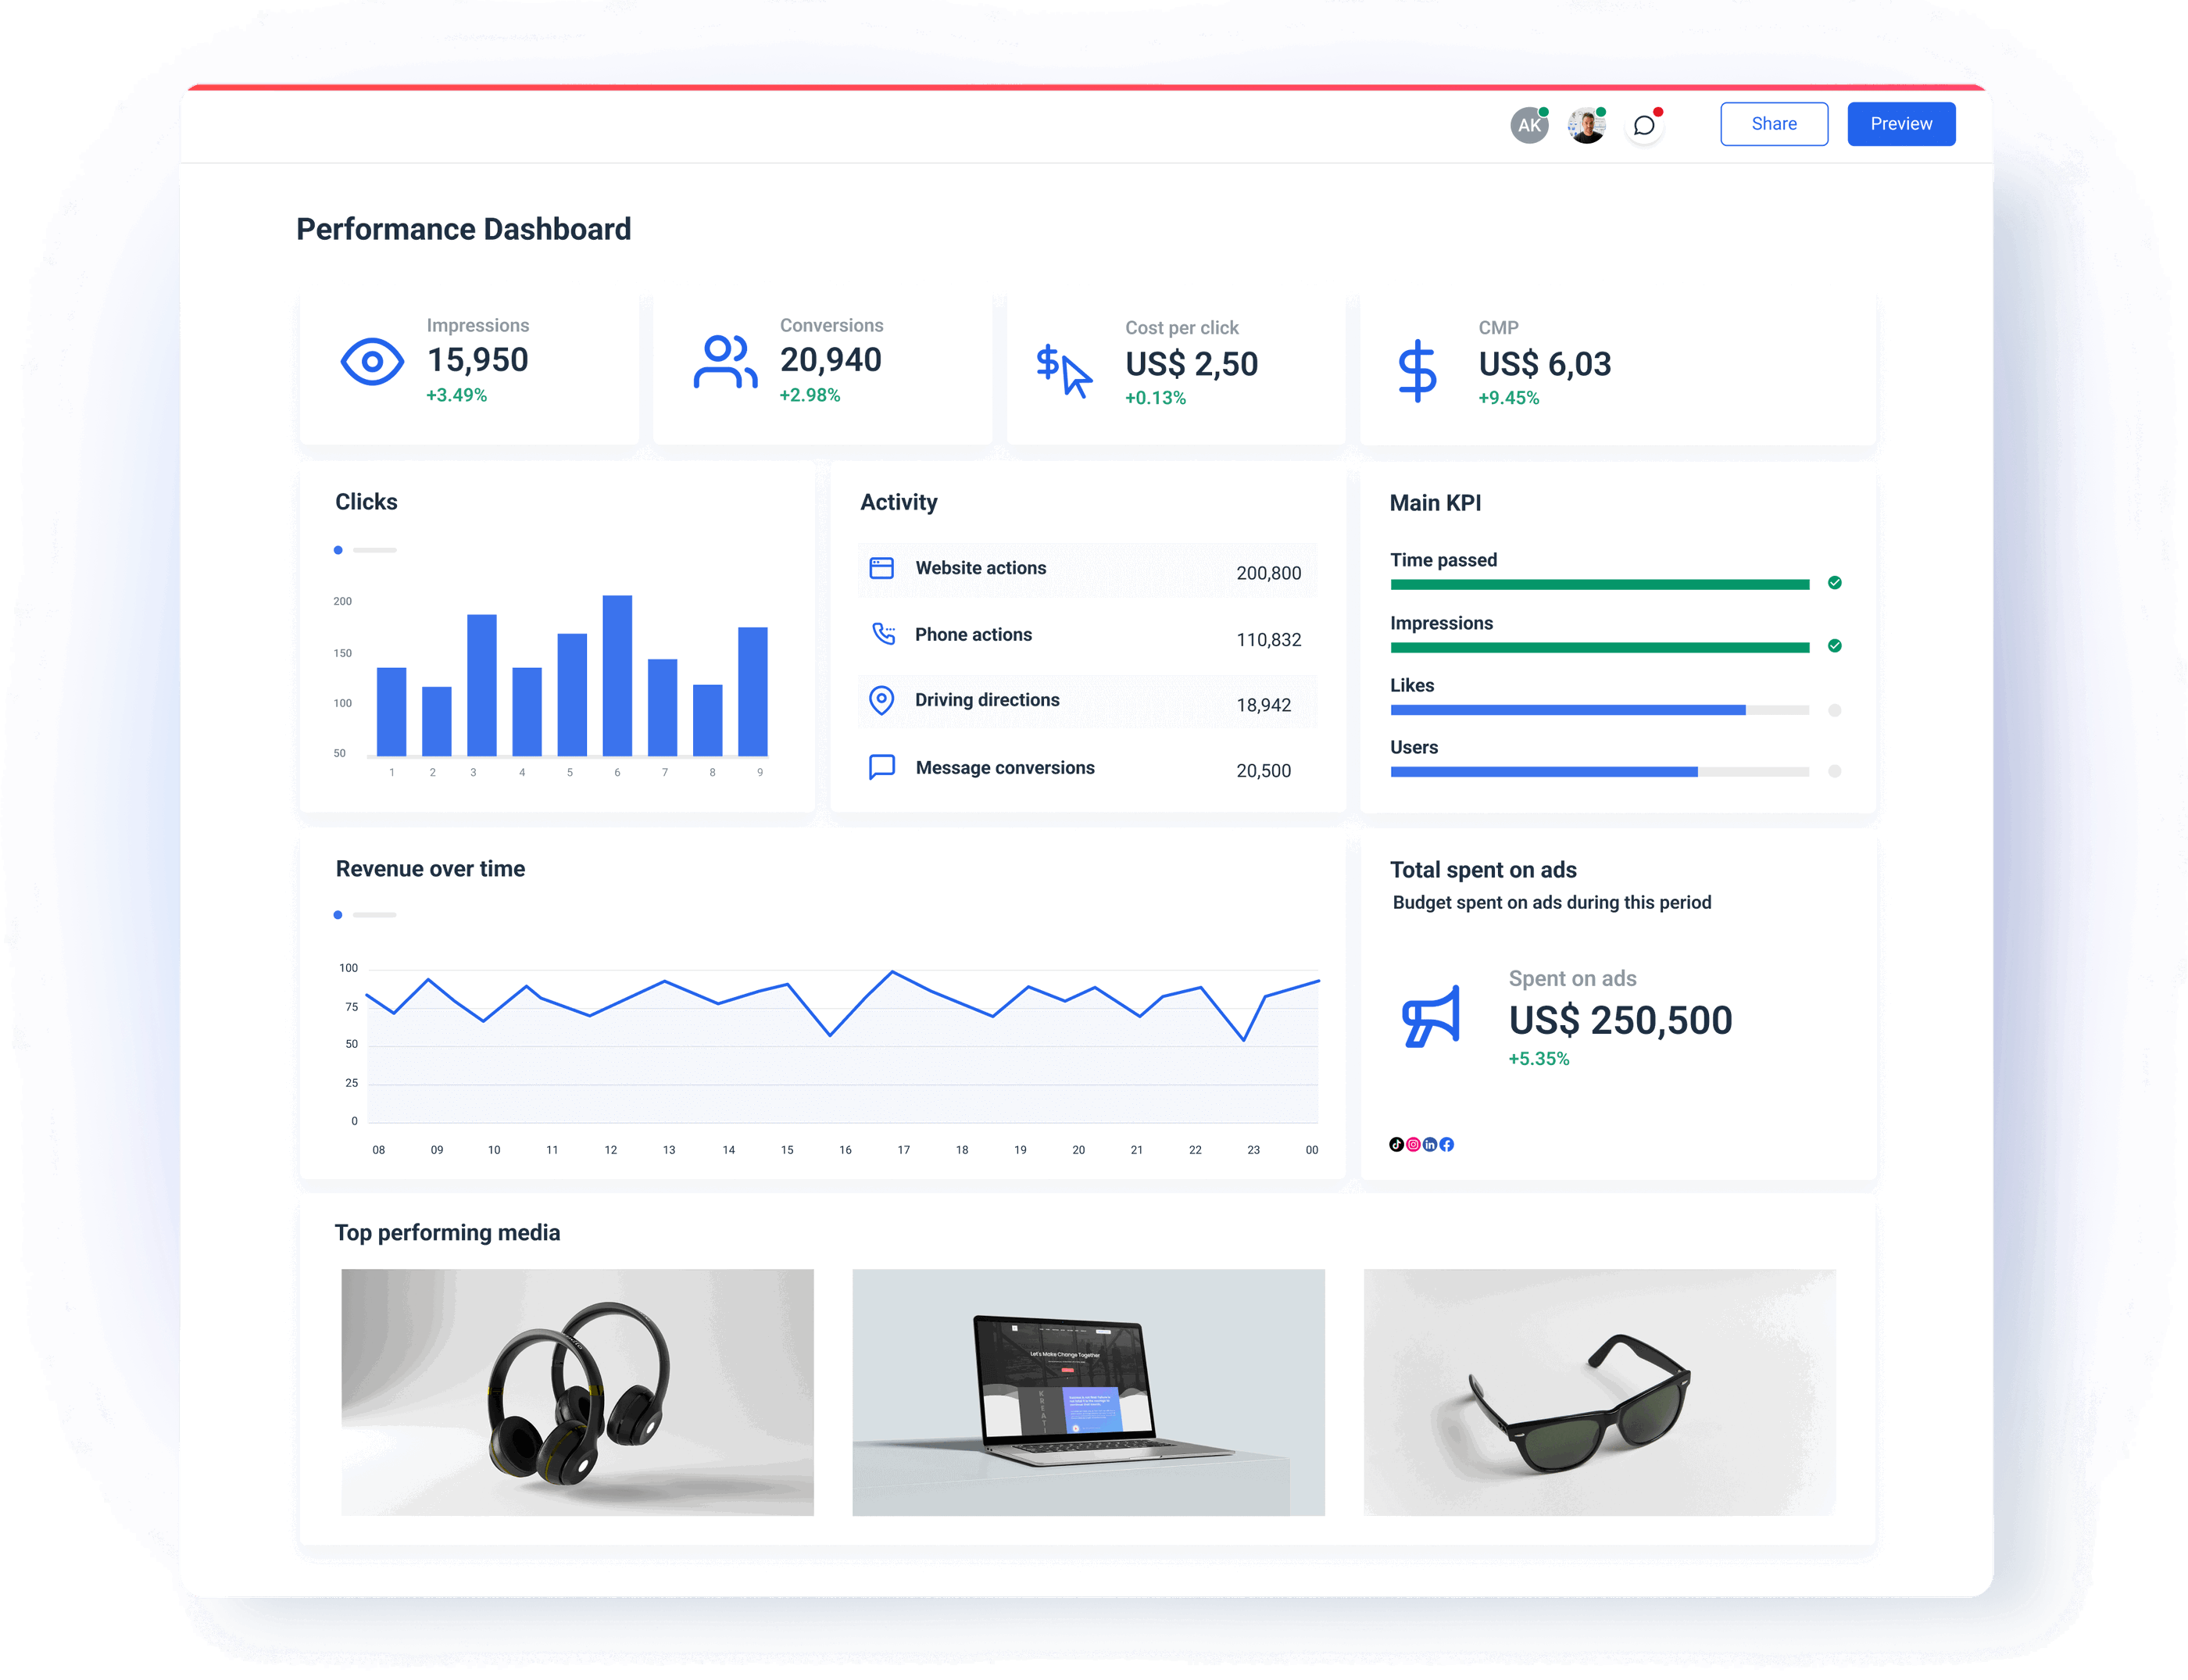
    What is a performance dashboard?

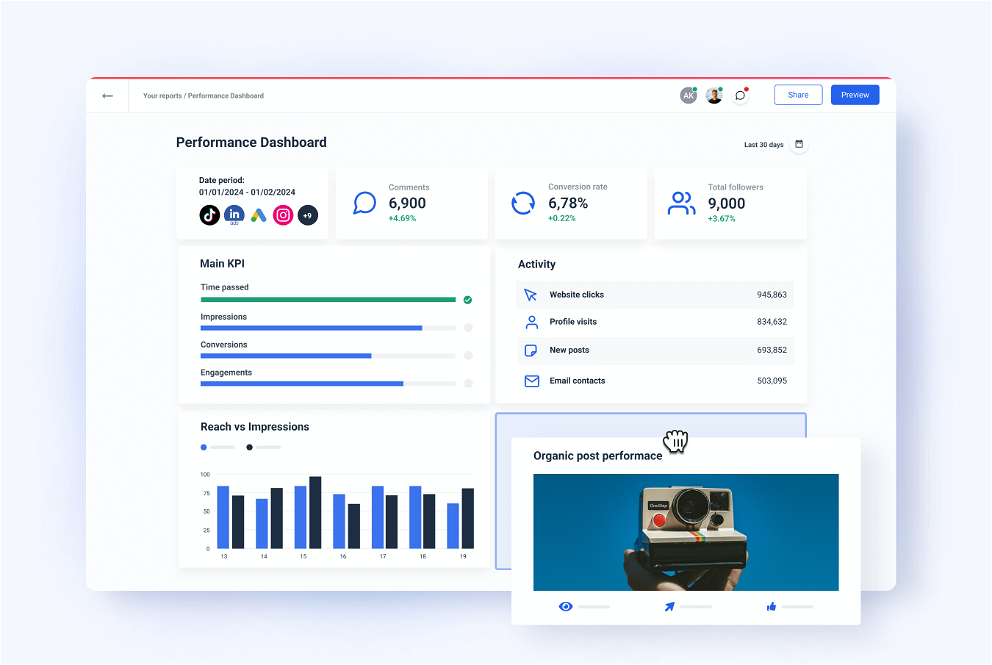
    A performance dashboard is a visual tool that displays the most important KPIs and metrics for your business in a way that is easy to understand. It can aggregate performance data from multiple marketing, sales, or related platforms, helping marketers and leaderships see the progress and make data-driven decisions based on the insights.

    Whatagraph performance dashboard

    What are the benefits of having a performance dashboard?

    A performance dashboard helps you navigate the extremely data-driven business and marketing waters with numerous channels, campaigns, and metrics to keep track of. A single dashboard that gives a unified view of all this data is important for making sound decisions but also has other benefits:


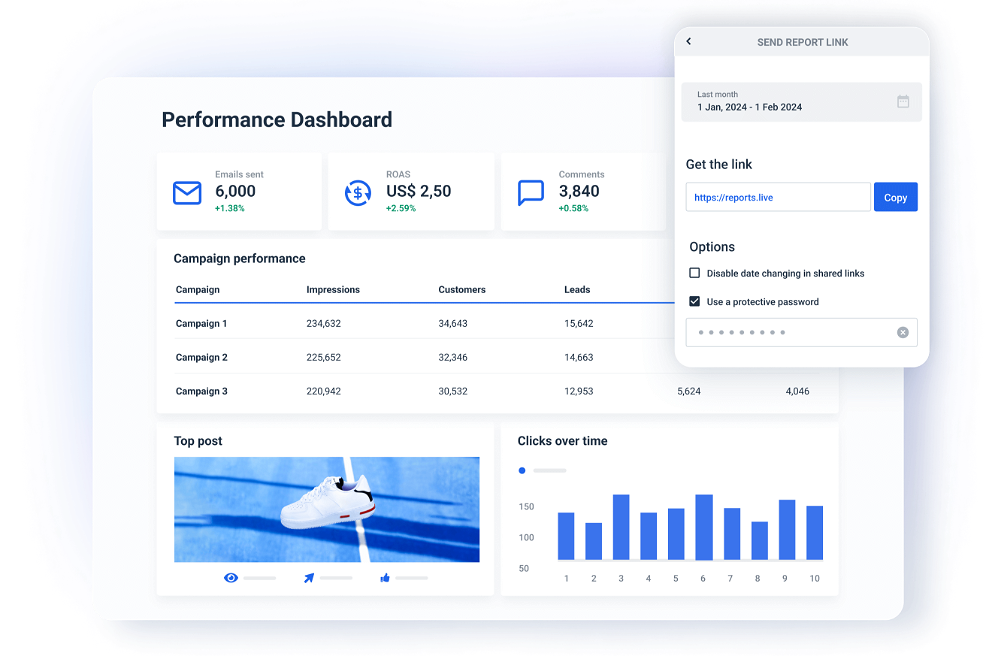
    Core marketing data stored in one place

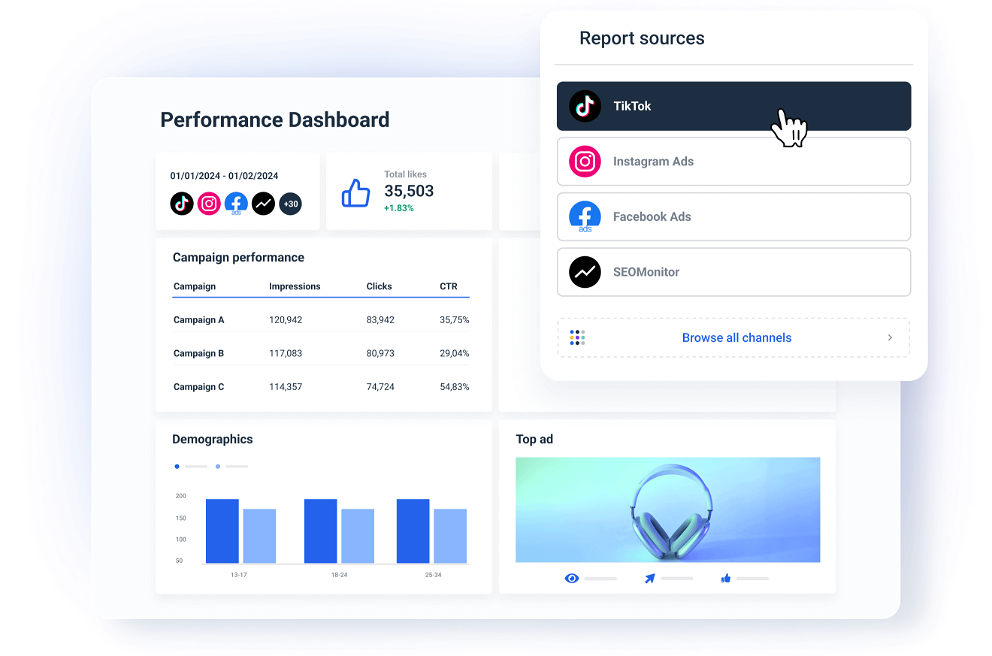
    A performance dashboard centralizes data from all your marketing platforms. Instead of manually pulling and stitching data from different ad accounts, social media, and email communications, you can quickly access all the data you need for decision-making in one place. This allows you to always stay on top of your marketing campaigns.


    Eliminate the risks of human error

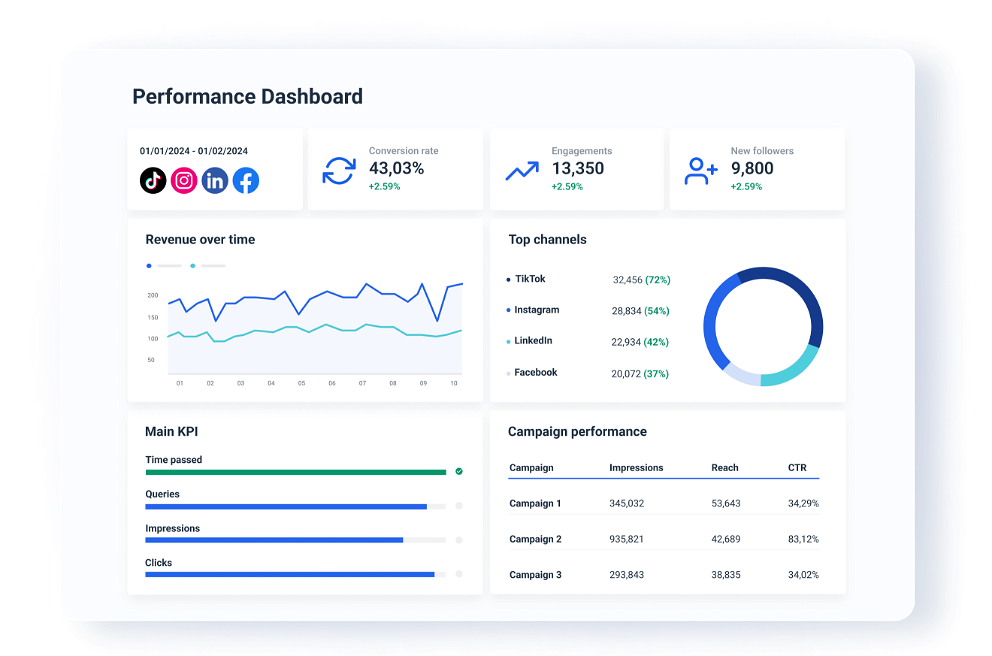
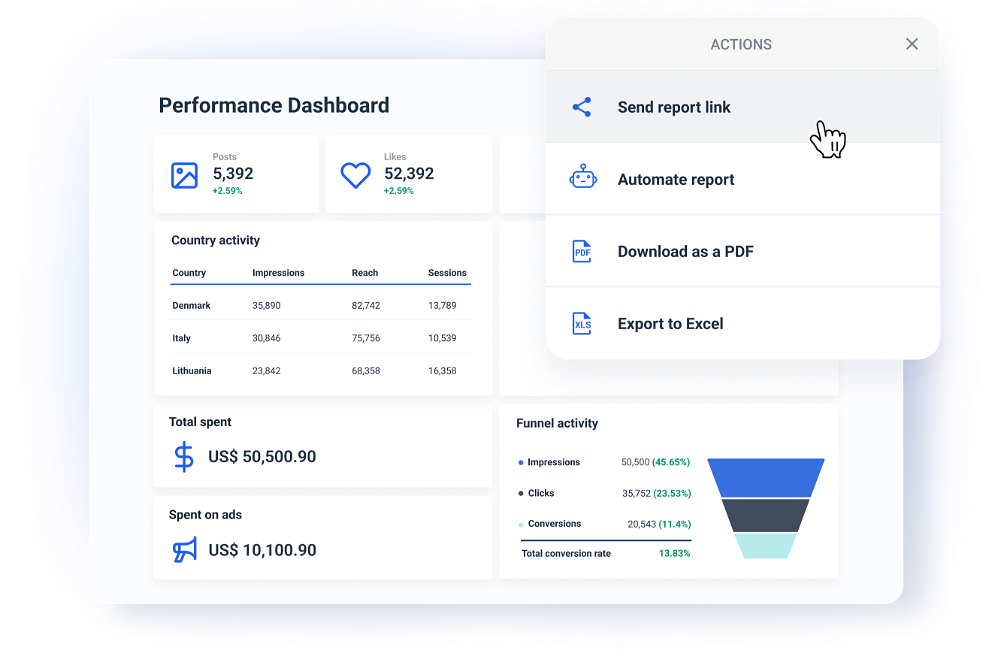
    Whatagraph dashboards automatically refresh data every 30 minutes, providing you with the most recent insights into your marketing efforts. This eliminates the need to manually update data in your performance dashboards each time you need to analyze changes in your campaign performance. An automated performance dashboard saves time and increases the accuracy of the metrics you are tracking.


    Transparency at all stages of the funnel

    A performance dashboard that includes cross-department data can reveal what happens when a lead goes from one stage of the funnel to the next. This improves cross-department alignment in multiple ways: Marketing teams can standardize the messaging and the lead qualification process, while the Sales can get more context on the lead so they can adjust their deck based on the channel, campaign, or message that brought the lead on a discovery call.


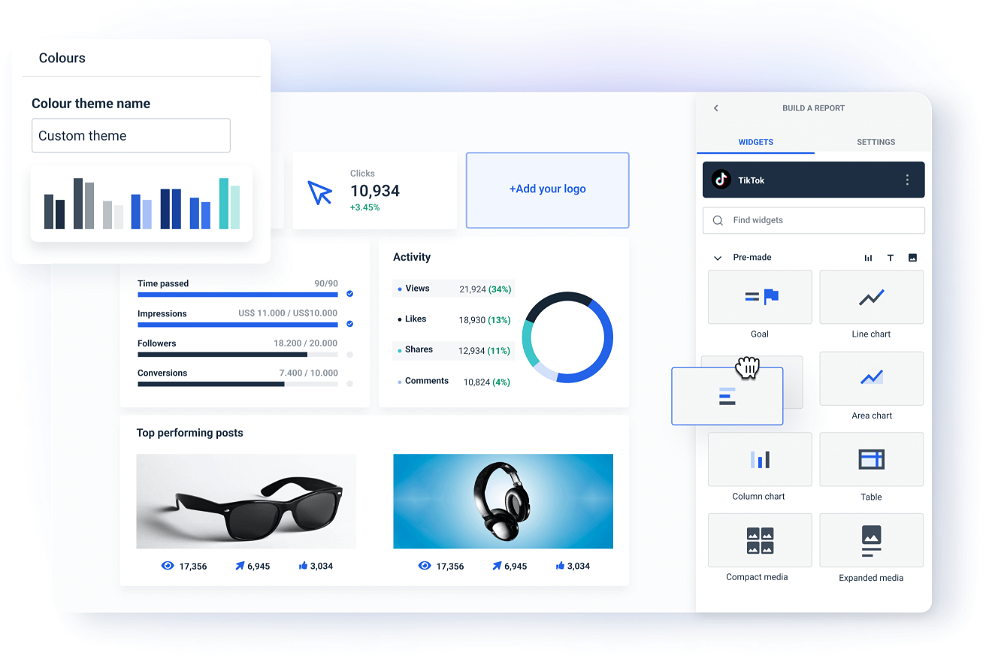
    Standardized view of all marketing metrics

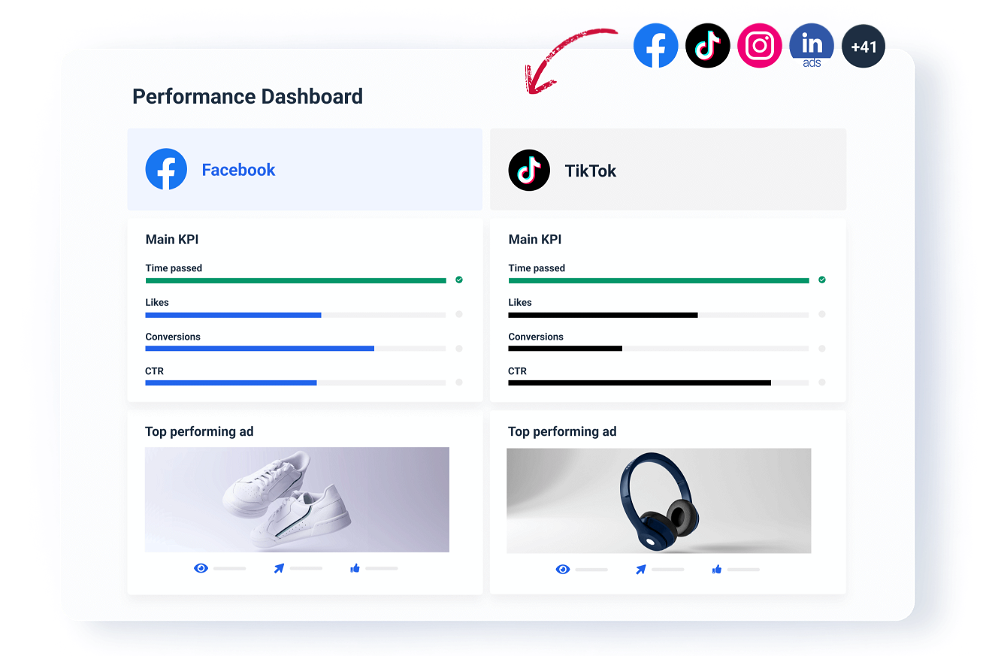
    Standardizing metrics and dimension names can be a hassle for marketers in large agencies or enterprise companies collecting data from different sources. Similar metrics are often called differently across platforms. Data is scattered across different ad accounts. Such and similar problems make it difficult to understand all marketing efforts clearly. Whatagraph has a user-friendly data transformation workflow that helps you standardize the naming across metrics and dimensions, aggregate, and blend data from different sources by your own rules.

    FAQs

    All your questions answered. And if you can’t find it here, chat to our friendly team.

    What should be included in a marketing performance dashboard?

    It depends on your business model and goals. While a B2B SaaS company will have a different set of metrics than a B2C business with an online store, these are the most important performance metrics you should consider including in your dashboard:


    1. Website Performance: Total Website Visits, Unique Visitors, New vs. Returning VisitorsBounce Rate, Average Time on Page, Pages per SessionConversion Rate, Goal Completions, Click-Through Rate (CTR) on Call-to-Action (CTA) buttons.


    2. Email Marketing Metrics: Open Rate, Click-Through Rate (CTR), Delivery Rate, Conversion Rate from Email Campaigns, Revenue from Email Campaigns, Subscriber Growth.


    3. E-commerce Metrics: Total Revenue, Average Order Value (AOV), Conversion Rate, Cart Abandonment Rate, Product Page Views, Product Purchase Patterns, Product Reviews and Ratings, Return Rate.


    4. Integrated Metrics: Track how different channels contribute to conversions. Understand the customer's journey across various touchpoints. Measure cross-channel interactions and conversions.


    5. Overall Business Metrics: Customer Lifetime Value (CLV), Customer Acquisition Cost (CAC), Return on Investment (ROI).


    Whatagraph can help you create a dynamic and easily understandable marketing performance dashboard where you can always adjust the metrics based on evolving business goals and objectives.

    What data sources can I connect with Whatagraph’s performance dashboard?

    You can connect over 45 popular data sources, including website analytics, social media, PPC, e-commerce, SEO, email marketing, and customer relationship management tools. We are constantly adding new sources as native integrations. You can connect any other source via custom APIs, or by exporting data to Spreadsheets or BigQuery and adding them as a source.

    Can you export data from a performance dashboard?

    Yes, you can export data from a performance dashboard, whether it’s the complete dashboard or individual data points as Excel or CSV files. This feature is handy if you want to analyze the aggregated data in another business intelligence tool.

    It’s good to be loved! Our clients are not shy about expressing it.

    I made a switch from GDS and Sheets for reporting to Whatagraph, and I am saving literal hours each week on performance report creation. Our small firm actually managed to onboard 2 new clients as a result of all the time we saved on managing data and reporting. The customer service is also really helpful and easy to reach.

    Mindaugas S., Marketing Consultant Capterra logo for Whatagraph review

    Capterra verified review by

    Mindaugas S., Marketing Consultant

    Having active customer support to help fix any issues was a big contributor, but we also really liked the ability to save templates and connect sources to multiple charts/widgets at once without having to edit them individually. And having the grid layout is much easier to stay consistent with than the free form setup that Data Studio has.

    Nico T., Media Planner Capterra logo for Whatagraph review

    Capterra verified review by

    Nico T., Media Planner

    The system has standard templates that are easy and fast to use. Also you can build your own report with lightning speed. It is very easy to use, has a lot of integration, and let get started very fast.

    Rasmus Bernt K., External Senior Management Consultant Capterra logo for Whatagraph review

    Capterra verified review by

    Rasmus Bernt K., External Senior Management Consultant

    We love Whatagraph - we would definitely recommend and our account manager is great! I love how easy this tool is to use, everyone on the team finds it much more user-friendly than other dashboards. Integration was easy, we sent some example reports to the team who duplicated these for us. We literally had to log in and send it to our clients!

    Stephanie S., Digital Director Capterra logo for Whatagraph review

    Capterra verified review by

    Stephanie S., Digital Director

    We are showing our clients the work that we're doing for them and this is incredibly important for our clients ROI. They want to see results and having a tool like Whatagraph that can show data from virtually every source we use is hugely important.

    John S., SEO Strategist Capterra logo for Whatagraph review

    Capterra verified review by

    John S., SEO Strategist

    The tool is easy to use; you do not need to have development resources. Even my junior project managers are capable of making campaign reports in minutes. There are a lot of pre-made templates you can use as well as many pre-made widgets.

    Erman E., Marketing Specialist Capterra logo for Whatagraph review

    Capterra verified review by

    Erman E., Marketing Specialist

    Really easy to connect data sources within the tool. The library of report templates has been helpful. The customer support team has been responsive to all of our needs. Our team enjoys the simplicity of setting up the reports and how the data is presented.

    Brent N., Director of Operations Capterra logo for Whatagraph review

    Capterra verified review by

    Brent N., Director of Operations

    Easy to create really beautiful graphs and reports which can help other team members to understand the most important takeaways. I especially like the automated report function, so I don't have to check on the same thing repeatedly.

    Orsolya S., Online Marketing Manager Capterra logo for Whatagraph review

    Capterra verified review by

    Orsolya S., Online Marketing Manager

    Need more help with getting started?

    An image of the Whatagraph dashboard, with a custom reporting template

    We can set up your report campaign for you!

    If you need help with setting up Whatagraph - our team can create your campaign reports!

    Ready for insights?

    It's time to focus your time on the tasks that really matter, and let us worry about your marketing analytics. Start your free 7-day trial.

    • Free for 7 days
    • No credit card required
    • Live chat support
    • Cancel anytime
    Start Reporting For Free

    No credit card required

    Cross channel reporting template with Whatagraph