Easily create both advanced internal dashboards and shiny, clear reports
Stop struggling with cross-channel data visualization. Gather insights for reports or campaign optimization more quickly with Whatagraph's intuitive visualization builder. Leverage drag-and-drop, templates, pre-made widgets, shortcuts, and easy-to-use advanced features.


Whatagraph strikes a perfect balance between ease of use and extensive customization
From quick templates to formulas, blends, custom charts and color themes
Create complex dashboards with data aggregation and custom calculations for performance monitoring. Or straightforward and engaging reports that your clients or stakeholders understand at a glance.
Whatagraph is excellent for handling any data visualization use case. It's also highly customizable both in terms of data display and design.
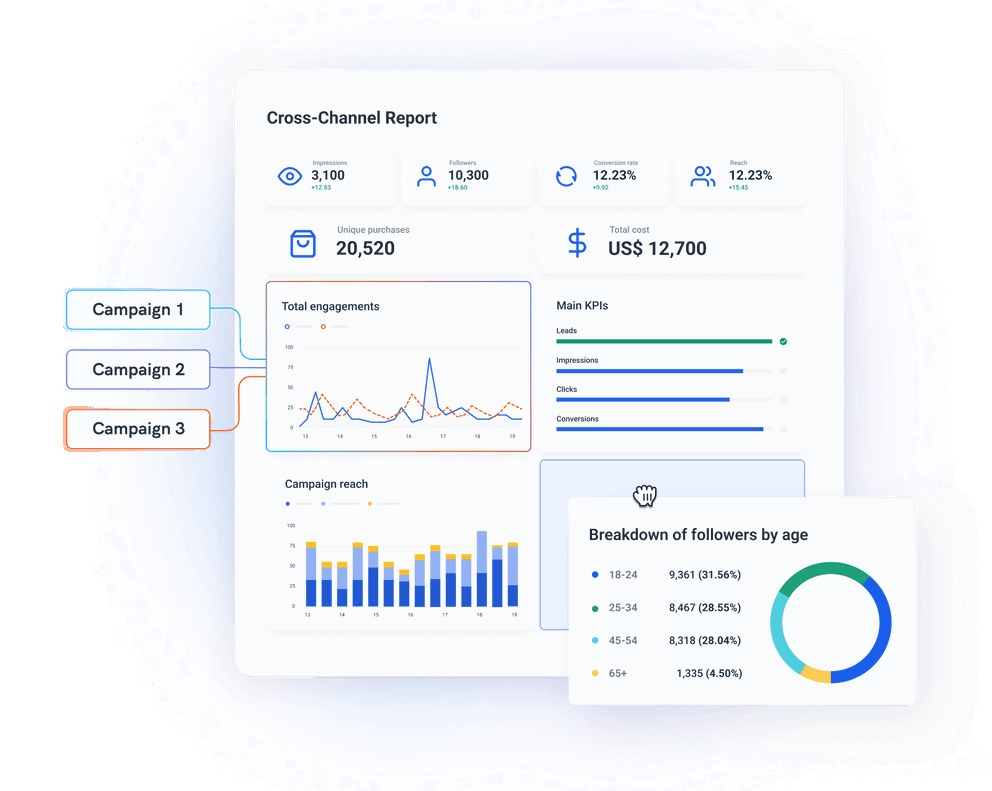


Cross-channel data visualization with no effort
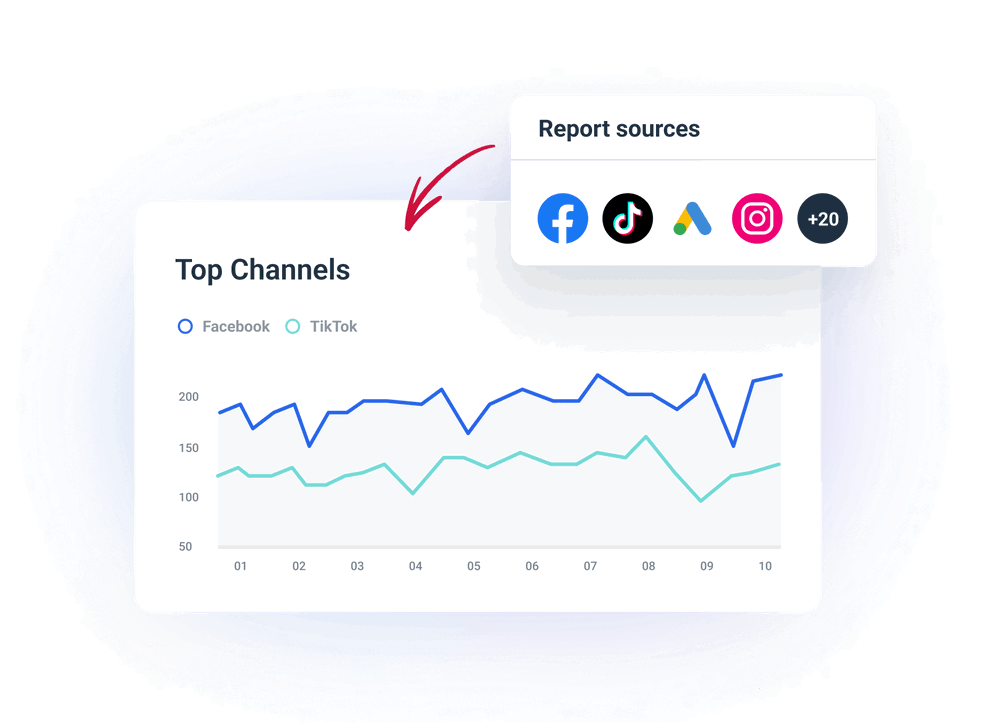
Combining multiple sources in one chart or table takes a couple of clicks. You don't need extensive configuration to find insights or demonstrate results. Easily bring cross-channel campaigns, multiple social media or ad platforms, and data from spreadsheets or a warehouse together.
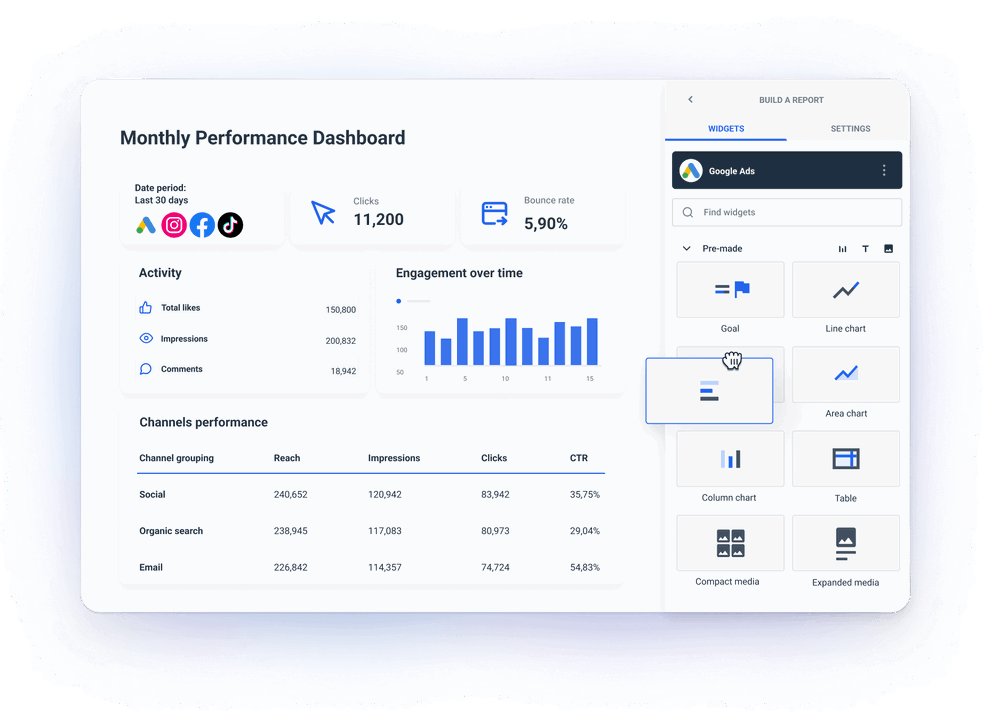
Pre-made templates: from whole dashboards to widgets
Leverage a set of pre-made report and dashboard templates to get started. Each integration also has ready-made widget templates to choose from. You can use them as is for quick insights or customize each one for your case.
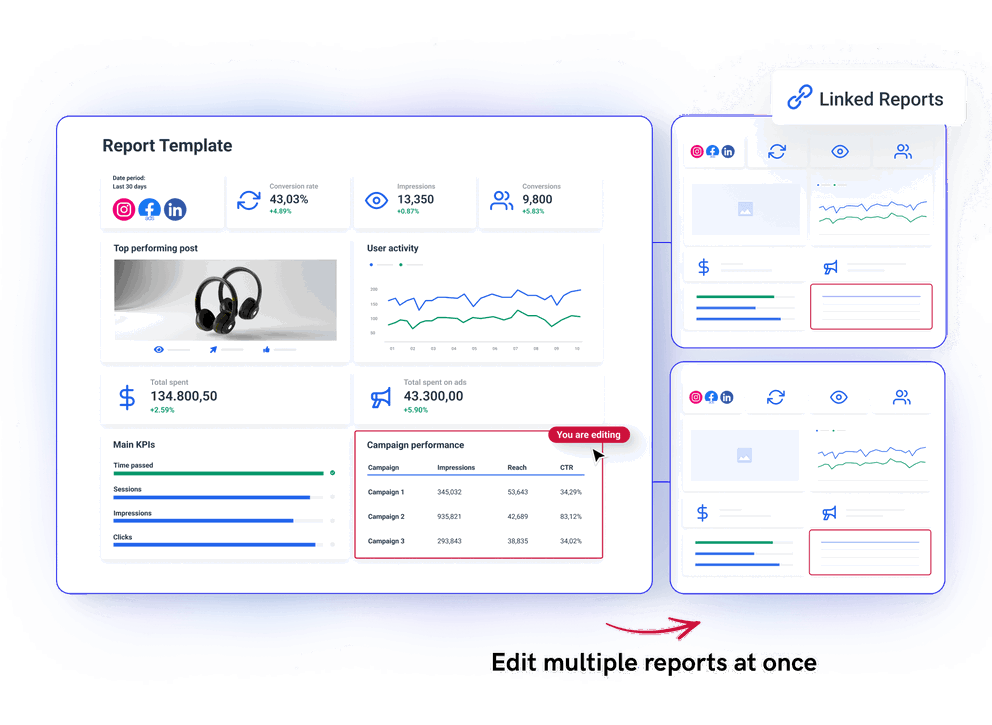
Save and reuse anything you create as a template
Whether it's just one calculation or filter, a widget, or a whole report, you can save it as a team template and use it again elsewhere. Moreover, you can link any number of reports to one template and edit them all at once.
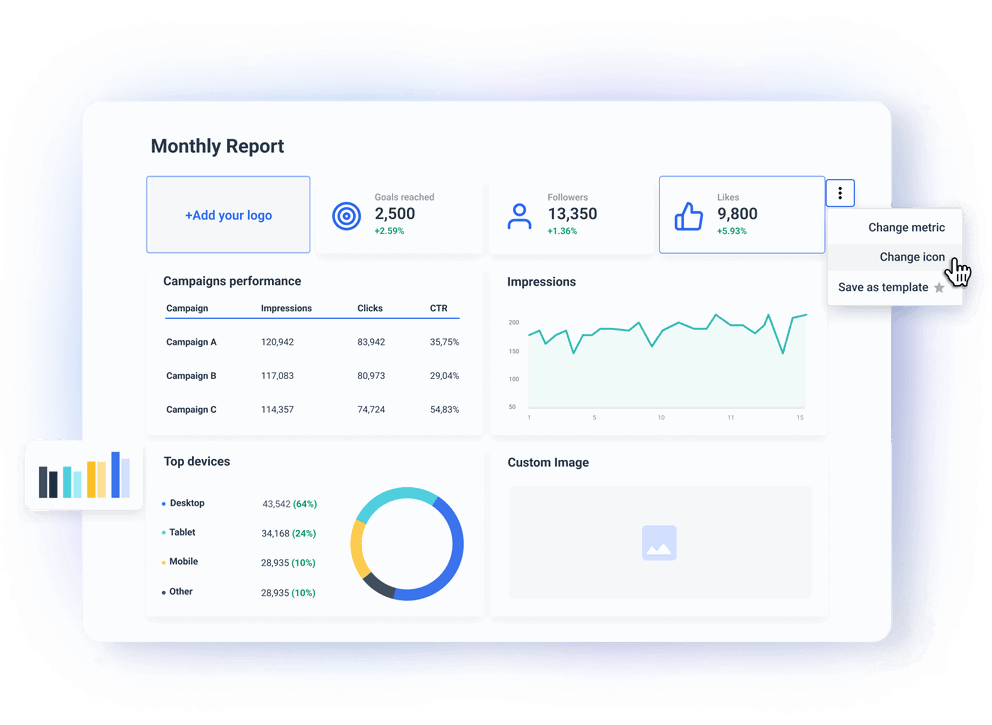
Customize everything visually to suit your use case
Choose page orientation and color schemes, add and remove icons, and add custom images. Whether you are looking for a text-heavy report, presentation-style PDF, or an insightful live dashboard. Everything is created swiftly in a single environment.
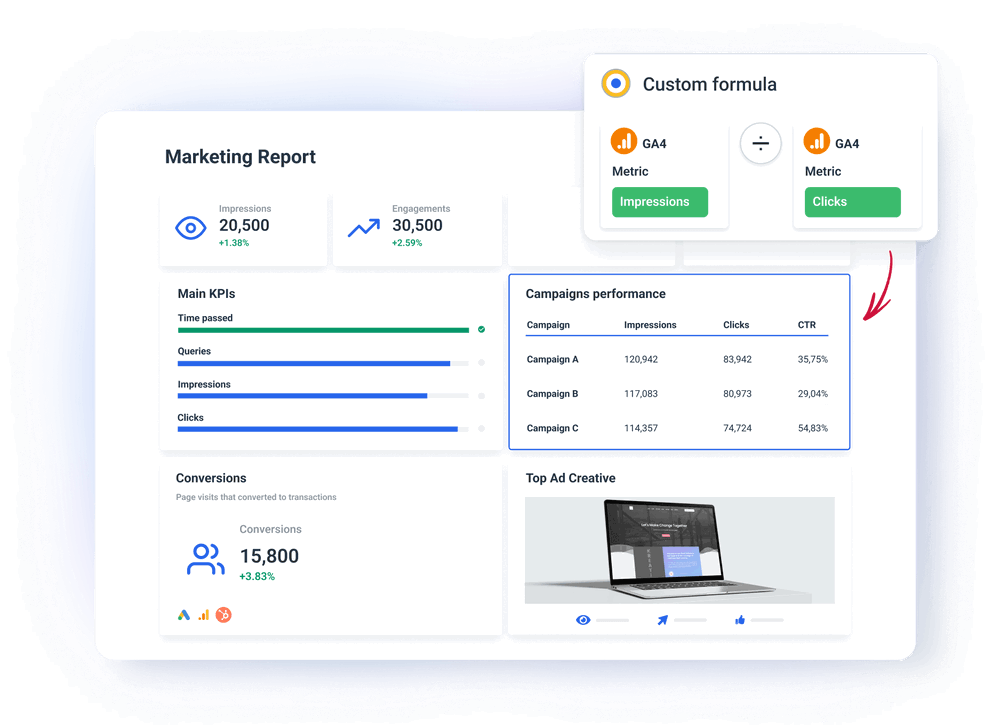
Easy-to-use advanced features to discover and share insights
In Whatagraph, you can apply custom calculations in an intuitive formula builder, aggregate data from multiple campaigns or locations. Also, track KPIs and goals, showcase ad creatives automatically, add markup, and custom cross-channel metrics. And all of it is fast and intuitive.
What others think about Whatagraph
I made a switch from GDS and Sheets for reporting to Whatagraph, and I am saving literal hours each week on performance report creation. Our small firm actually managed to onboard 2 new clients as a result of all the time we saved on managing data and reporting. The customer service is also really helpful and easy to reach.

Capterra verified review by
Mindaugas S., Marketing Consultant
Having active customer support to help fix any issues was a big contributor, but we also really liked the ability to save templates and connect sources to multiple charts/widgets at once without having to edit them individually. And having the grid layout is much easier to stay consistent with than the free form setup that Data Studio has.

Capterra verified review by
Nico T., Media Planner
The system has standard templates that are easy and fast to use. Also you can build your own report with lightning speed. It is very easy to use, has a lot of integration, and let get started very fast.

Capterra verified review by
Rasmus Bernt K., External Senior Management Consultant
We love Whatagraph - we would definitely recommend and our account manager is great! I love how easy this tool is to use, everyone on the team finds it much more user-friendly than other dashboards. Integration was easy, we sent some example reports to the team who duplicated these for us. We literally had to log in and send it to our clients!

Capterra verified review by
Stephanie S., Digital Director
We are showing our clients the work that we're doing for them and this is incredibly important for our clients ROI. They want to see results and having a tool like Whatagraph that can show data from virtually every source we use is hugely important.

Capterra verified review by
John S., SEO Strategist
The tool is easy to use; you do not need to have development resources. Even my junior project managers are capable of making campaign reports in minutes. There are a lot of pre-made templates you can use as well as many pre-made widgets.

Capterra verified review by
Erman E., Marketing Specialist
Really easy to connect data sources within the tool. The library of report templates has been helpful. The customer support team has been responsive to all of our needs. Our team enjoys the simplicity of setting up the reports and how the data is presented.

Capterra verified review by
Brent N., Director of Operations
Easy to create really beautiful graphs and reports which can help other team members to understand the most important takeaways. I especially like the automated report function, so I don't have to check on the same thing repeatedly.

Capterra verified review by
Orsolya S., Online Marketing Manager
Read more reviews on:


