


What is a Google Ads report generator?
A Google Ads report generator automatically pulls your campaign data and presents it in a visual, client-friendly format.
Instead of logging into Google Ads, exporting CSVs, and piecing everything together in Sheets, you get a single Google Ads reporting platform that shows all your key metrics: ad spend, CTR, conversions, ROAS, and more.
A good Google Ads report generator does the heavy lifting:
✅ Connects directly to Google Ads and syncs data automatically
✅ Standardizes metrics so you're comparing apples to apples
✅ Visualizes performance in a way clients actually understand
✅ Delivers reports on a schedule, without you lifting a finger
With Whatagraph IQ, you take this even further. Instead of building dashboards widget by widget, you can:
- Ask AI to generate a full report instantly, complete with charts, tabs, and layouts
- Use IQ Themes to automatically brand reports for each client
- Get plain-language summaries that explain performance without hours of writing
- Chat directly with IQ to get instant answers about campaign performance
What are the best Google Ads reporting tools?
There are plenty of Google Adwords reporting tools, but not all of them are built for agencies managing multiple clients and campaigns at scale. Here are five worth knowing:
1. Whatagraph: Best Google Ads reporting tool for agencies
Whatagraph is built for marketers, not data engineers.
You can connect your Google Ads accounts through a stable native integration, organize and blend your data across every paid channel, and deliver white-labeled client reports in minutes (not hours).
With Whatagraph IQ, you can even skip the manual setup entirely. Just describe the Google Ads report you need, and IQ builds it instantly. Ask it campaign performance questions in plain language. Get AI-written summaries ready to send straight to clients.
This is why agencies like Maatwerk Online are saving 100 hours a month on reporting with Whatagraph.
Hear from Lars Maat, Co-Founder of Maatwerk Online, in this video:
2. AgencyAnalytics: Best for SEO agencies that also run Google Ads
AgencyAnalytics connects to 80+ data sources and includes a solid built-in SEO toolset — rank tracking, site audits, and backlink monitoring — making it a strong fit for content and SEO agencies.
Google Ads reporting is available, but users report sources disconnecting frequently and dashboards that are rigid and limited when it comes to cross-channel data blending or custom metrics.
3. DashThis: Best for straightforward, template-driven reporting
DashThis is a clean, easy-to-use reporting tool with a good library of pre-built templates. It works well for small agencies that need to get Google Ads reports out quickly without much configuration.
The trade-off is limited customization and no advanced data blending, so if your clients need cross-channel views, you'll hit a ceiling fast.
4. Looker Studio: Best free option for Google-native reporting
Looker Studio is free and works well if your clients only run Google Ads and you have someone technical to set it up.
The Google Ads connector is native and reliable. But if you want to blend data from other PPC channels like Meta Ads or LinkedIn Ads, you’ll need to pay for third-party connectors like Supermetrics or Funnel, which are notorious for breaking frequently.
Plus, Looker Studio dashboards can take up to 30 minutes to load depending on your setup and data volume.
5. Databox: Best for goal tracking and KPI dashboards
Databox is a solid choice for teams that want to track goals and KPIs in real time across multiple sources. It connects to Google Ads and offers a clean dashboard interface with goal-pacing widgets.
It's less focused on client-facing reporting and white-labeling though, making it better suited for internal performance monitoring than agency deliverables.
3 success stories of agencies using Whatagraph’s Google Ads reporting tool
If you’re wondering how to get accurate and fast Google Ads reporting for your agency (while keeping clients and even onboarding new ones), here are three agencies who have achieved it through Whatagraph.
1. Maatwerk Online: 100 hours saved per month on reporting
Challenges
Maatwerk Online was running a Frankenstack of Supermetrics and Looker Studio to report on 100+ clients. Dashboards were slow to load, connectors broke without warning, and reports were bloated with metrics nobody looked at.
"Looker Studio was really slow. We used Supermetrics to connect our channels, but sometimes they would just break. Tables didn't load when you tried to refresh the dashboard. It was really annoying,” said Lars Maat, Co-Founder at Maatwerk Online.
Solution
The team switched to Whatagraph and built four pillar reporting templates covering eCommerce, Leadgen, Branding, and B2B.
Each client gets a fully branded live dashboard with goal bars showing targets and current performance. With Whatagraph IQ, specialists now build widgets by describing what they need in plain language instead of configuring them manually.
Results
- 100 hours saved per month on reporting
- €4,000 saved per year by eliminating Supermetrics
- 100% of reporting tool cost recovered through client licensing fees
Whatagraph saves time and energy, and the hours we're saving is just pure profit. We now have the time to focus on more strategic things that help both our agency and our clients grow. - Lars Maat, Co-Founder at Maatwerk Online
2. Dtch. Digitals: 50% decrease in client churn
Challenges
As Dtch. Digitals scaled past 250 clients, their legacy reporting tool became a bottleneck. Reports were static PDFs with tables of numbers, no live data, no white-labeling beyond a logo upload, and no cross-channel visibility.
They tried Looker Studio with Supermetrics but found the setup too complex and time-consuming.
“Clients get bored if the reports are just a bunch of numbers. And they're more likely to move to other agencies if they think the results aren't good,” said Stef Oosterik, Quality Manager at Dtch. Digitals
Solution
Dtch. Digitals migrated 250+ clients to Whatagraph in under a month. They built four reporting templates for their main client segments, gave every client a live dashboard link with always-fresh data, and fully white-labeled everything with custom colors, images, and email domains.
Results
- 50% decrease in client churn
- 340 active clients on the platform
- 10% reduction in reporting tool costs
- Reporting tool costs fully offset through client licensing fees
Whatagraph not only helps us to get clients on board, but also to keep them within the agency. Our churn rate is very, very low. - Stef Oosterik, Quality Manager at Dtch. Digitals
3. Peak Seven: 63 hours saved per month on reporting
Challenges
Peak Seven was using Looker Studio with Funnel and Supermetrics to report on 25 clients across 100+ ad campaigns.
Dashboards were slow and unreliable, data frequently failed to pull through correctly, and Kim spent hours triple-checking numbers against source platforms instead of analyzing performance. Building a single report from scratch took 40 hours.
"Looker Studio was slow and always breaking. The data wouldn't pull through, or it would pull through incorrectly. It was frustrating, time-consuming, and a constant guessing game,” said Kim Strickland, Digital Marketing Specialist at Peak Seven
Solution
Kim replaced Looker Studio with Whatagraph and migrated in a matter of hours. She built a master template for franchise clients that could be duplicated and swapped with new data sources, cutting report time from 4 hours to under 1.5 hours.
Custom formulas combined data from different platforms into a single high-level view, and Whatagraph became the single source of truth for both clients and internal teams.
Results
- 63 hours saved per month on reporting
- $9,450 saved per month for clients on reporting costs
- Report build time dropped from 4 hours to 1.5 hours
- Stronger client relationships and improved client retention
Whatagraph is now our Bible, both for our clients and internal teams. With Looker Studio, everything was muddled. But Whatagraph has opened up transparency and communication.” - Kim Strickland, Digital Marketing Specialist at Peak Seven
What are the 8 different Google Ads reporting sections?
We talked to Ameet Khabra, Founder of Hop Skip Media, and she breaks down the 8 different sections on a Google Ads client report template that she has meticulously created on Whatagraph.
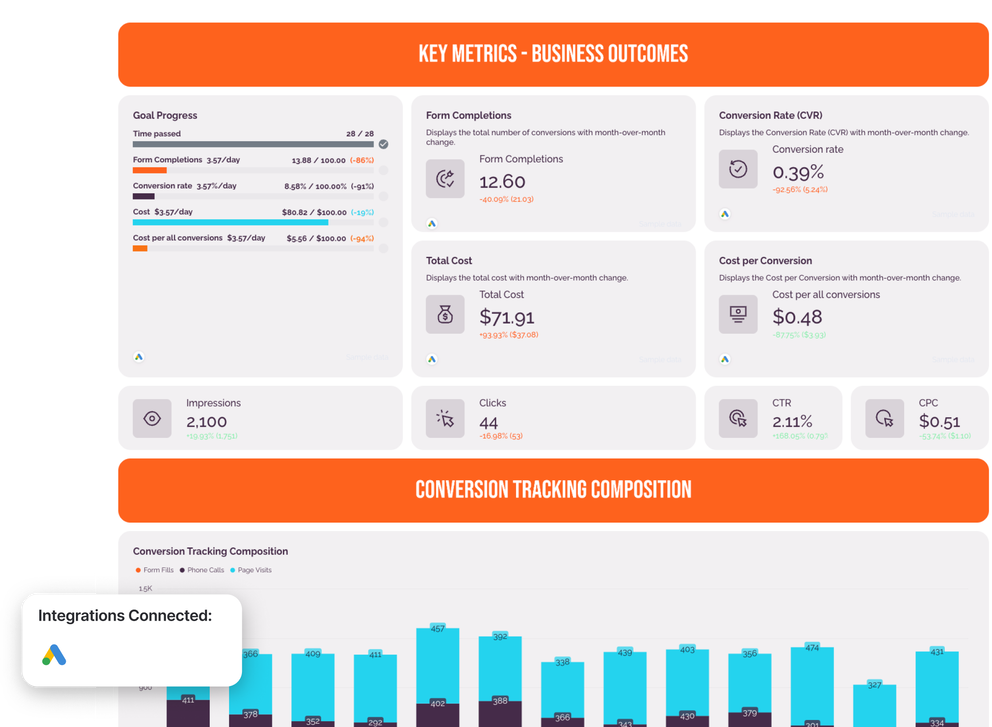
1. Key Metrics: Business Outcomes and Media Health
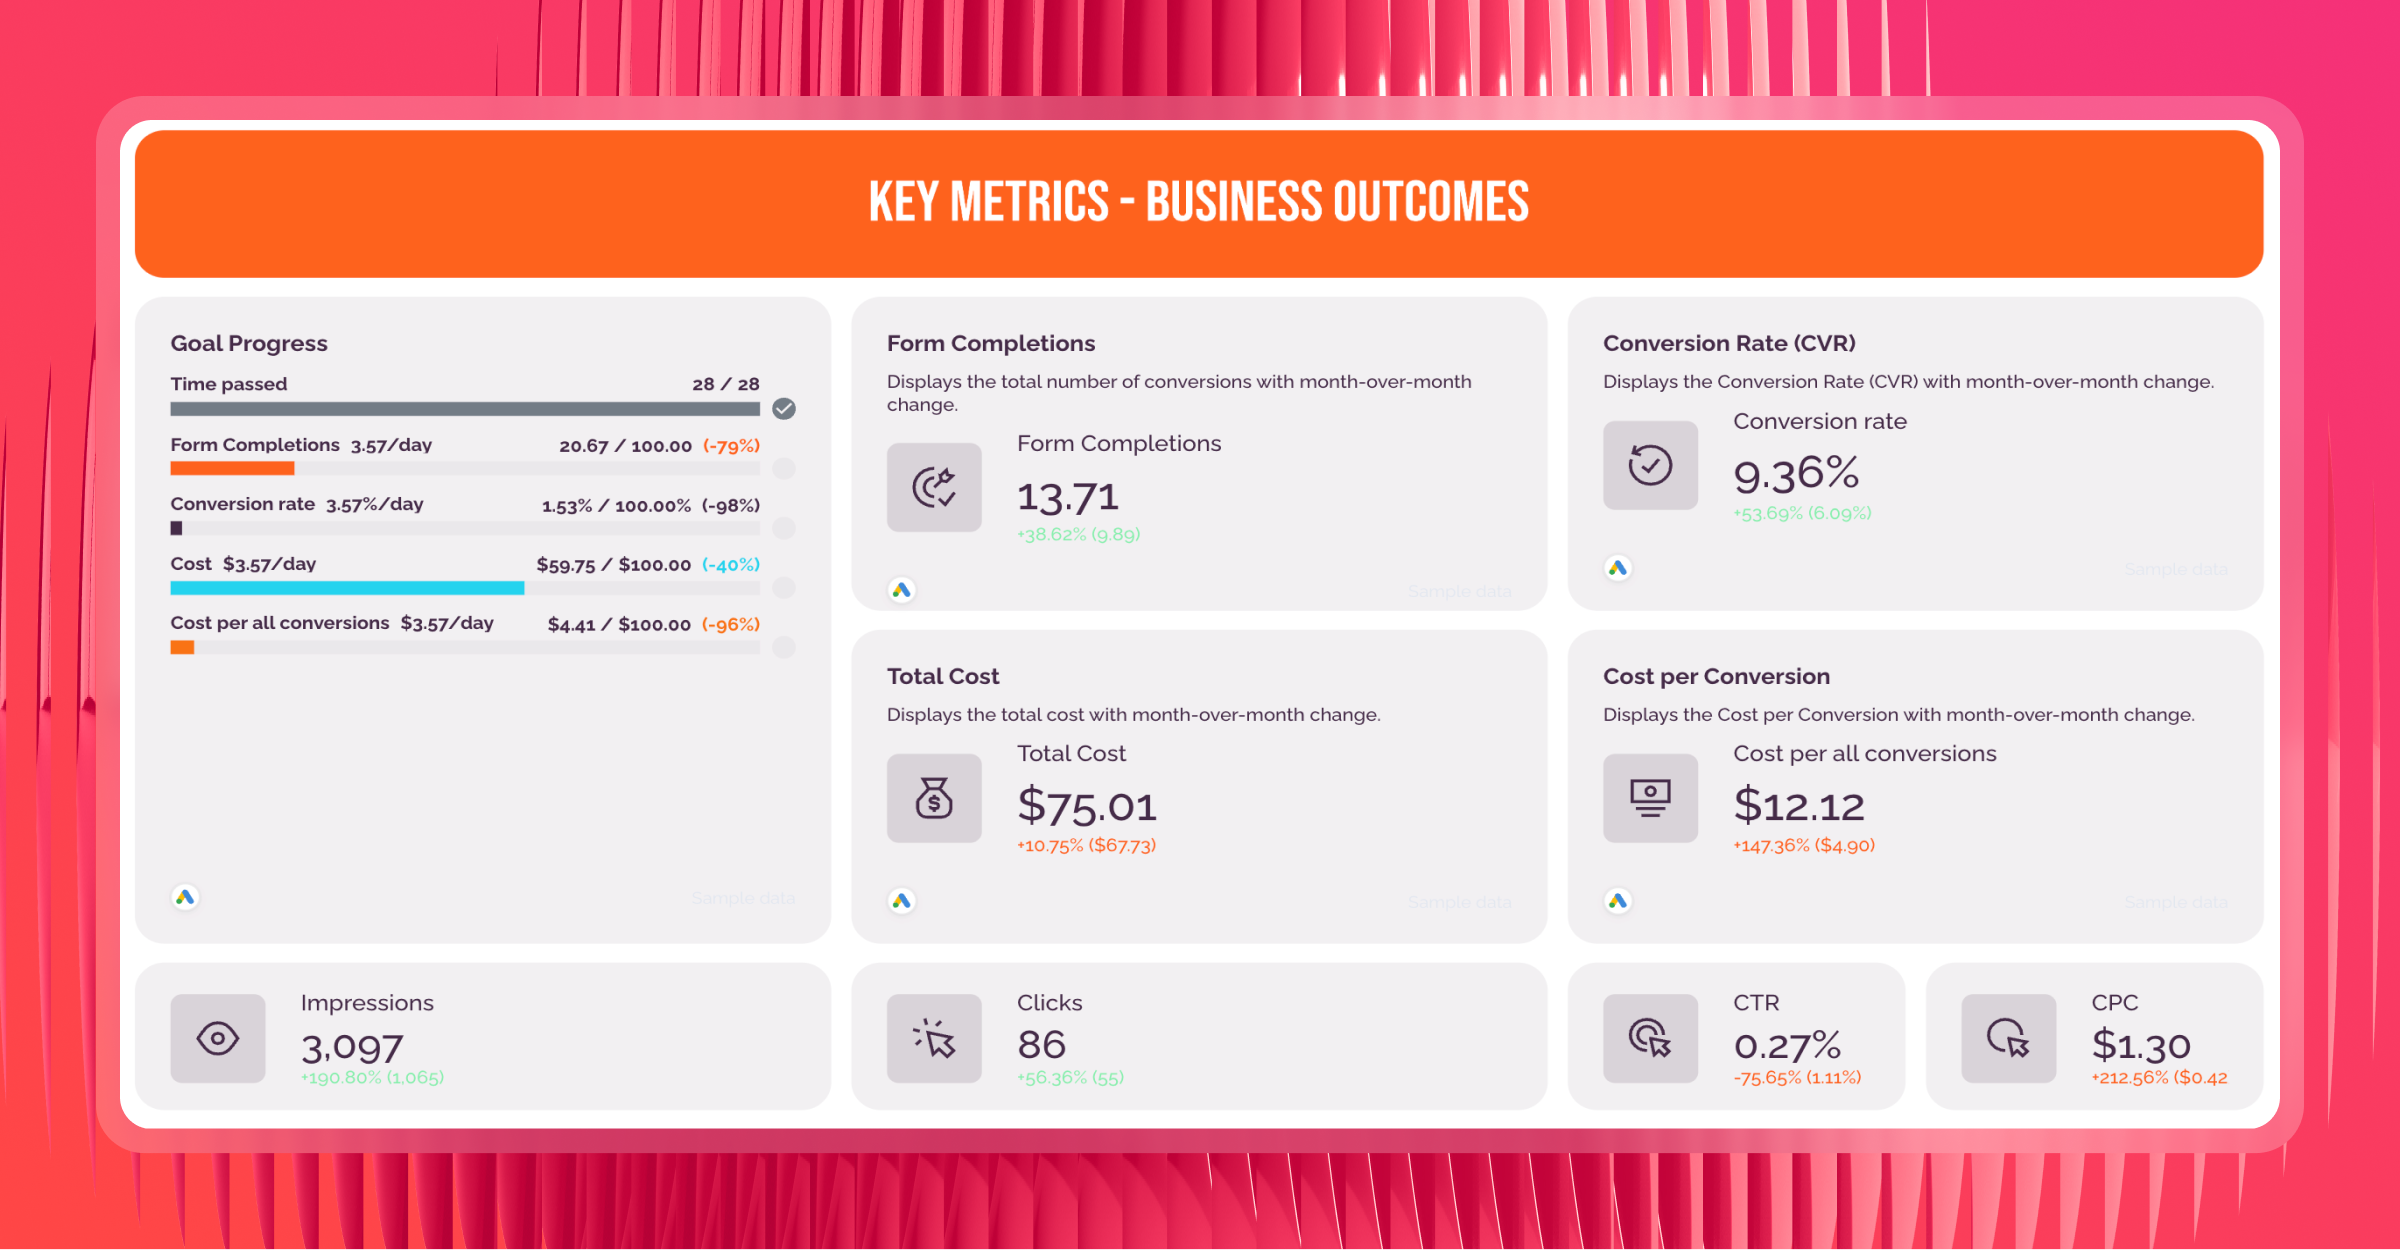
The first thing a client sees when they open the report should answer one question: are the campaigns generating results?
Ameet leads her Google Ads report for clients with Conversions, Conversion Rate, Cost per Conversion, and Total Cost as scorecards with month-over-month change and target tracking — because clients should know immediately whether they are on track before reading anything else.
Once clients understand the business outcomes, another strip of metrics explains how those results were delivered. Ameet presents Impressions, Clicks, CTR, and CPC at a smaller visual weight below the business outcomes section. Her reasoning: these are delivery mechanics, not outcomes. Presenting them separately stops clients from treating traffic metrics as a measure of success.
2. Conversion Tracking Composition
Before any campaign analysis, Ameet checks whether the data can actually be trusted. This section shows which conversion actions — form fills, phone calls, page visits — made up the total conversion count each month over the last 13 months.
According to Ameet, a drop in conversions might mean performance declined, or it might mean a tracking action was simply turned off. Making those changes visible before the client draws the wrong conclusion is essential.
3. Performance by Campaign
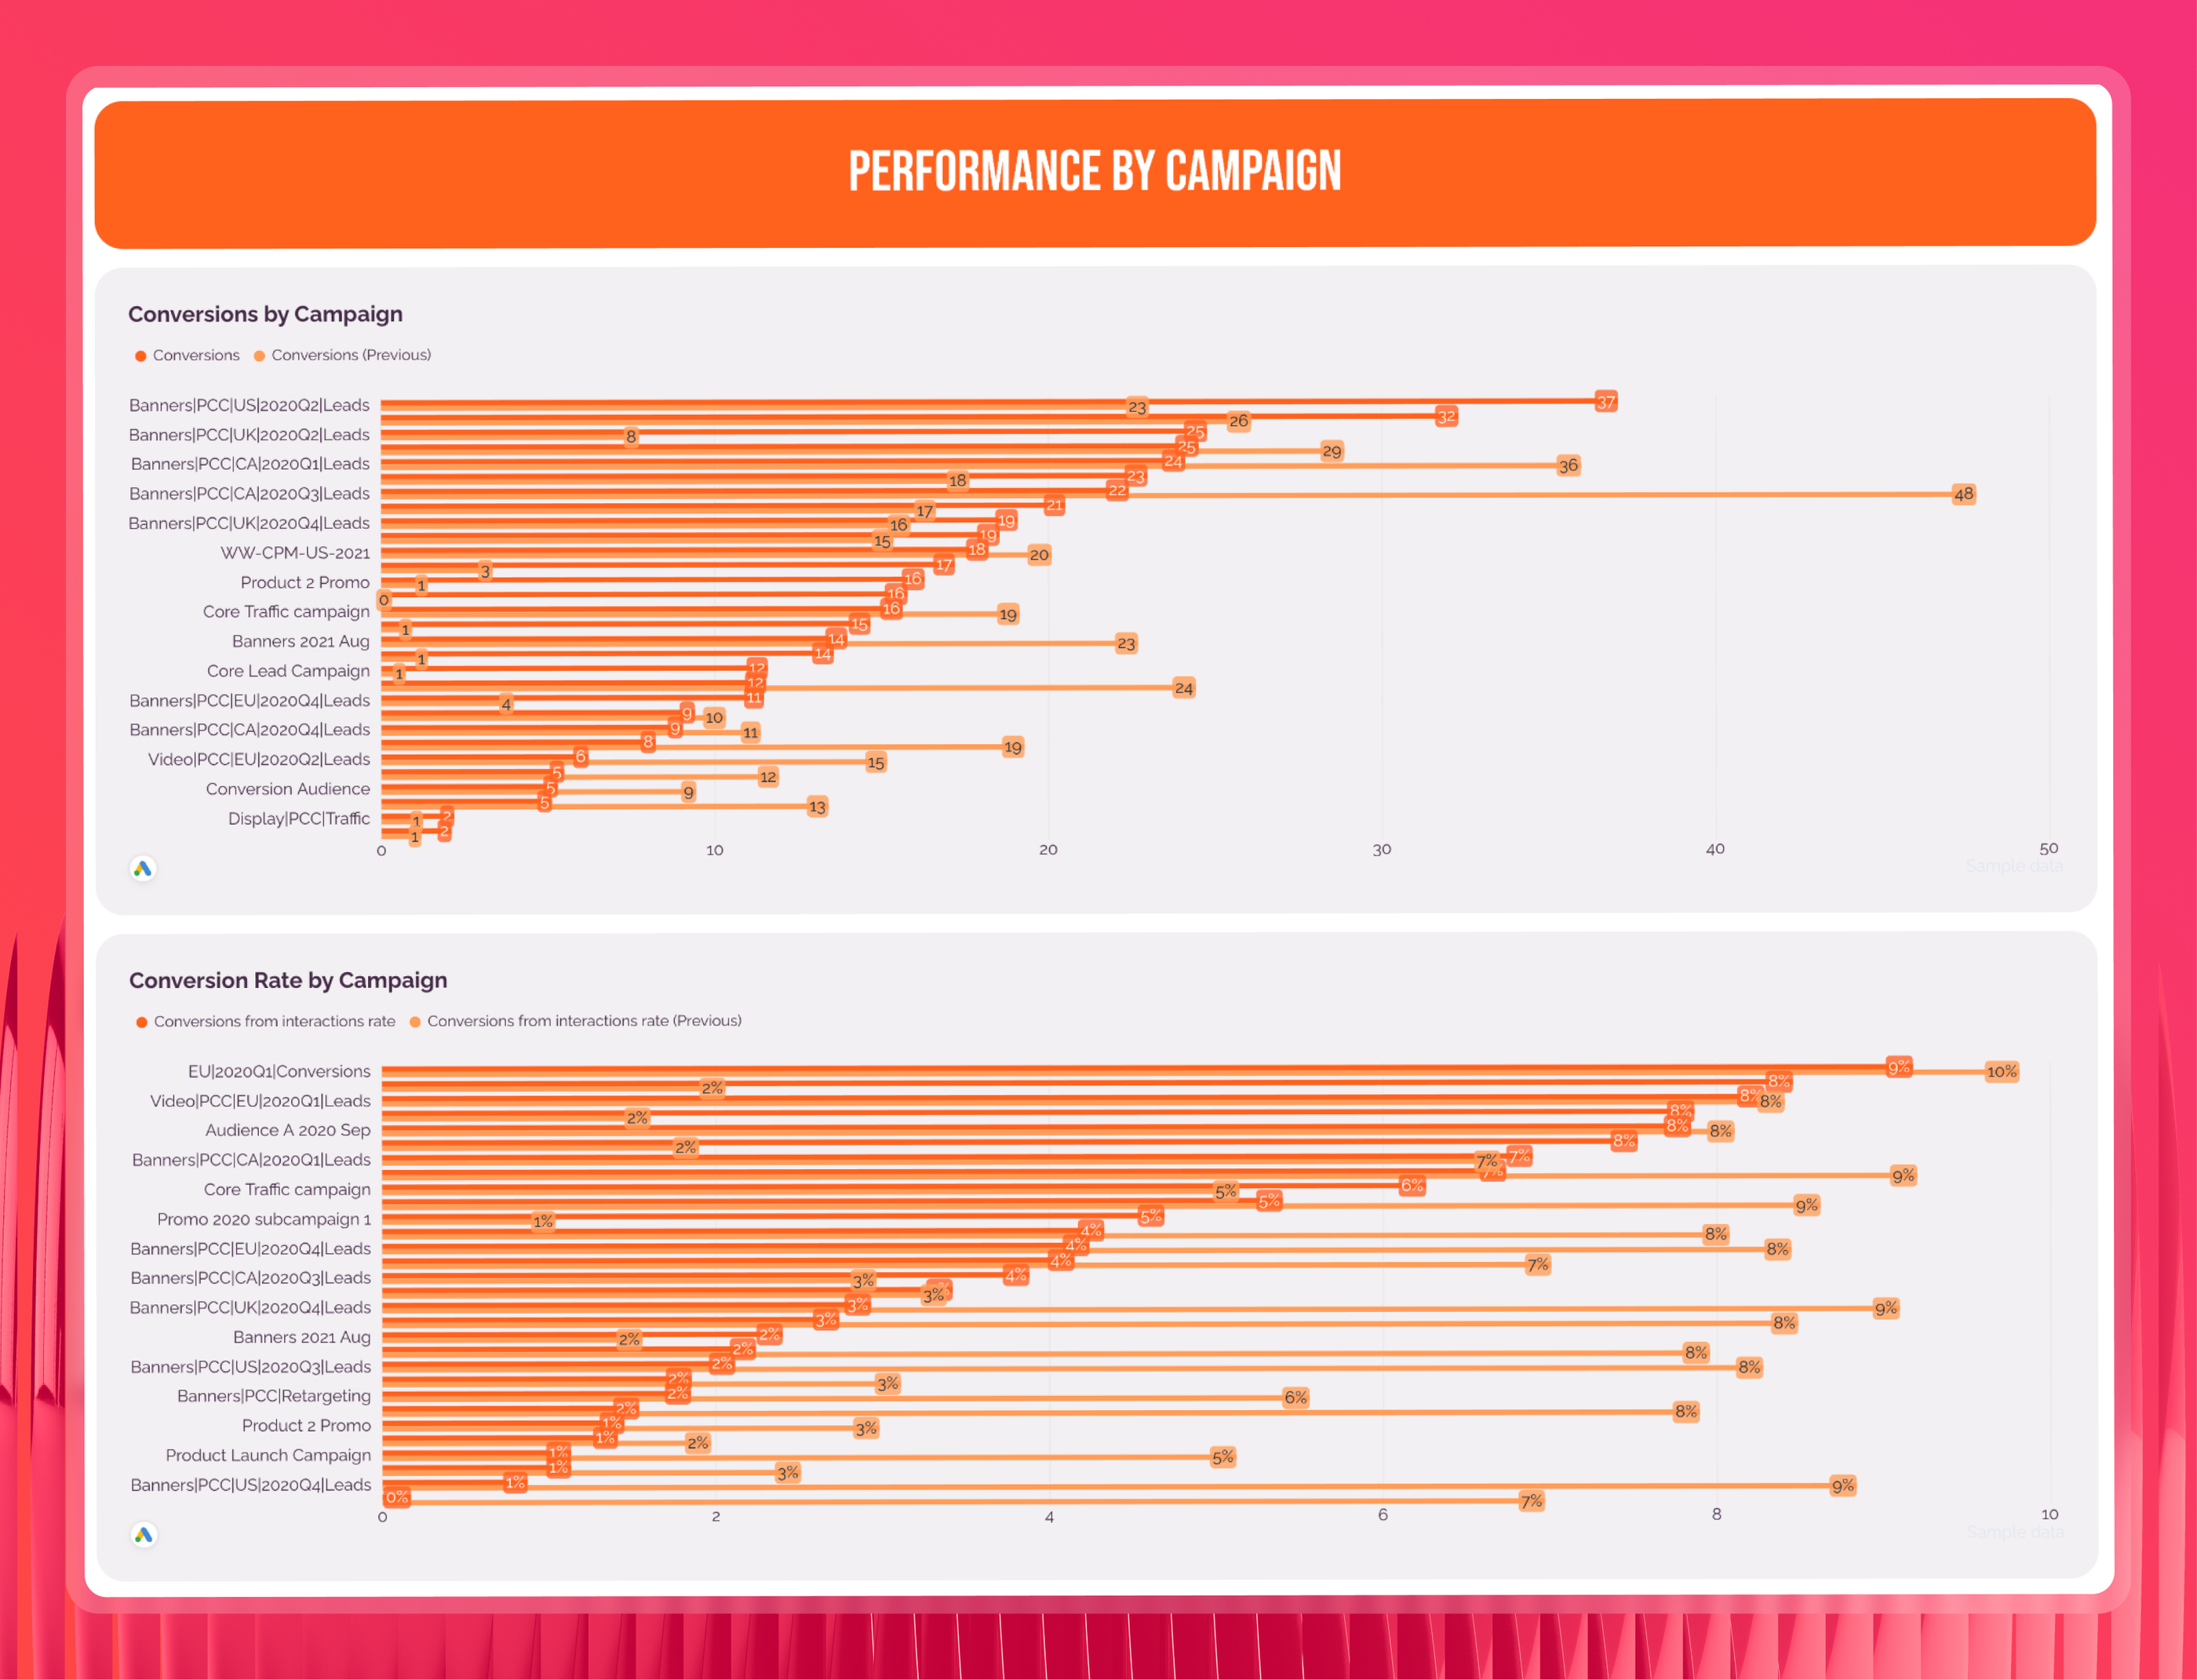
This section breaks down how each campaign contributed to the overall lead total, showing Conversions and Conversion Rate per campaign sorted from highest to lowest volume.
Ameet's approach here is deliberate: showing conversion rate alongside volume prevents a common misread where two campaigns with the same number of leads tell completely different stories if one converted at 8% and the other at 1%.
4. Audience Insights
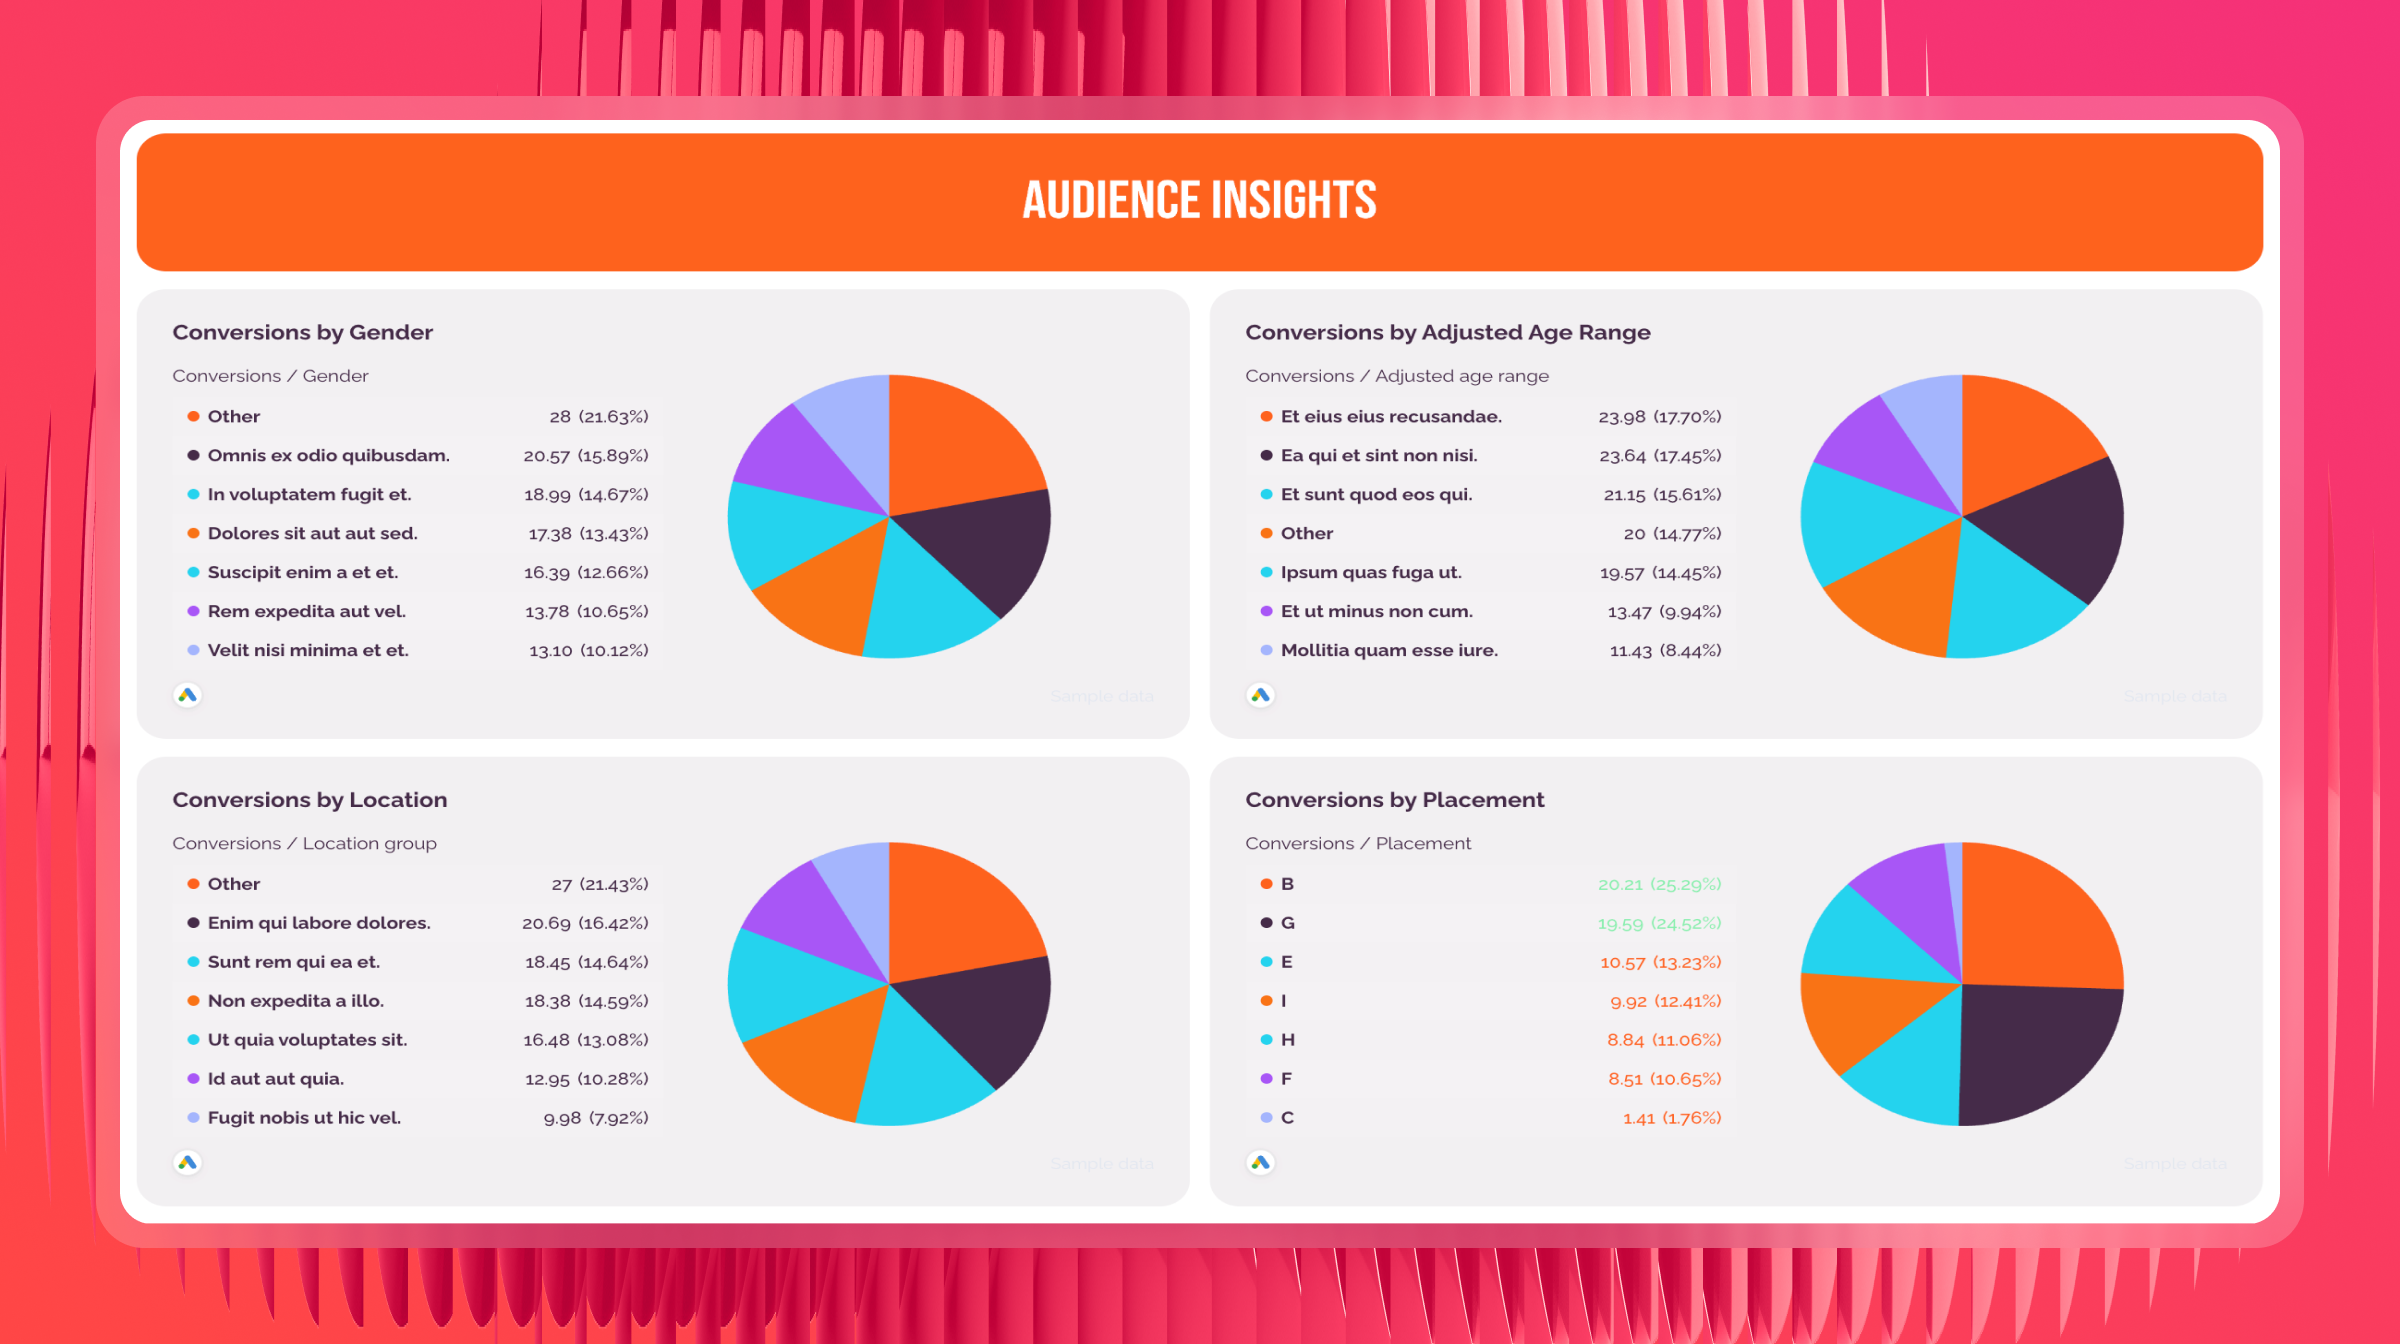
This section breaks down Conversions data by Gender, Age Group, Location, and Placement in pie charts. This directly informs decisions about where to increase spend and where to cut it, identifying which audiences are driving leads and which are consuming budget without results.
5. Keywords and Search Terms
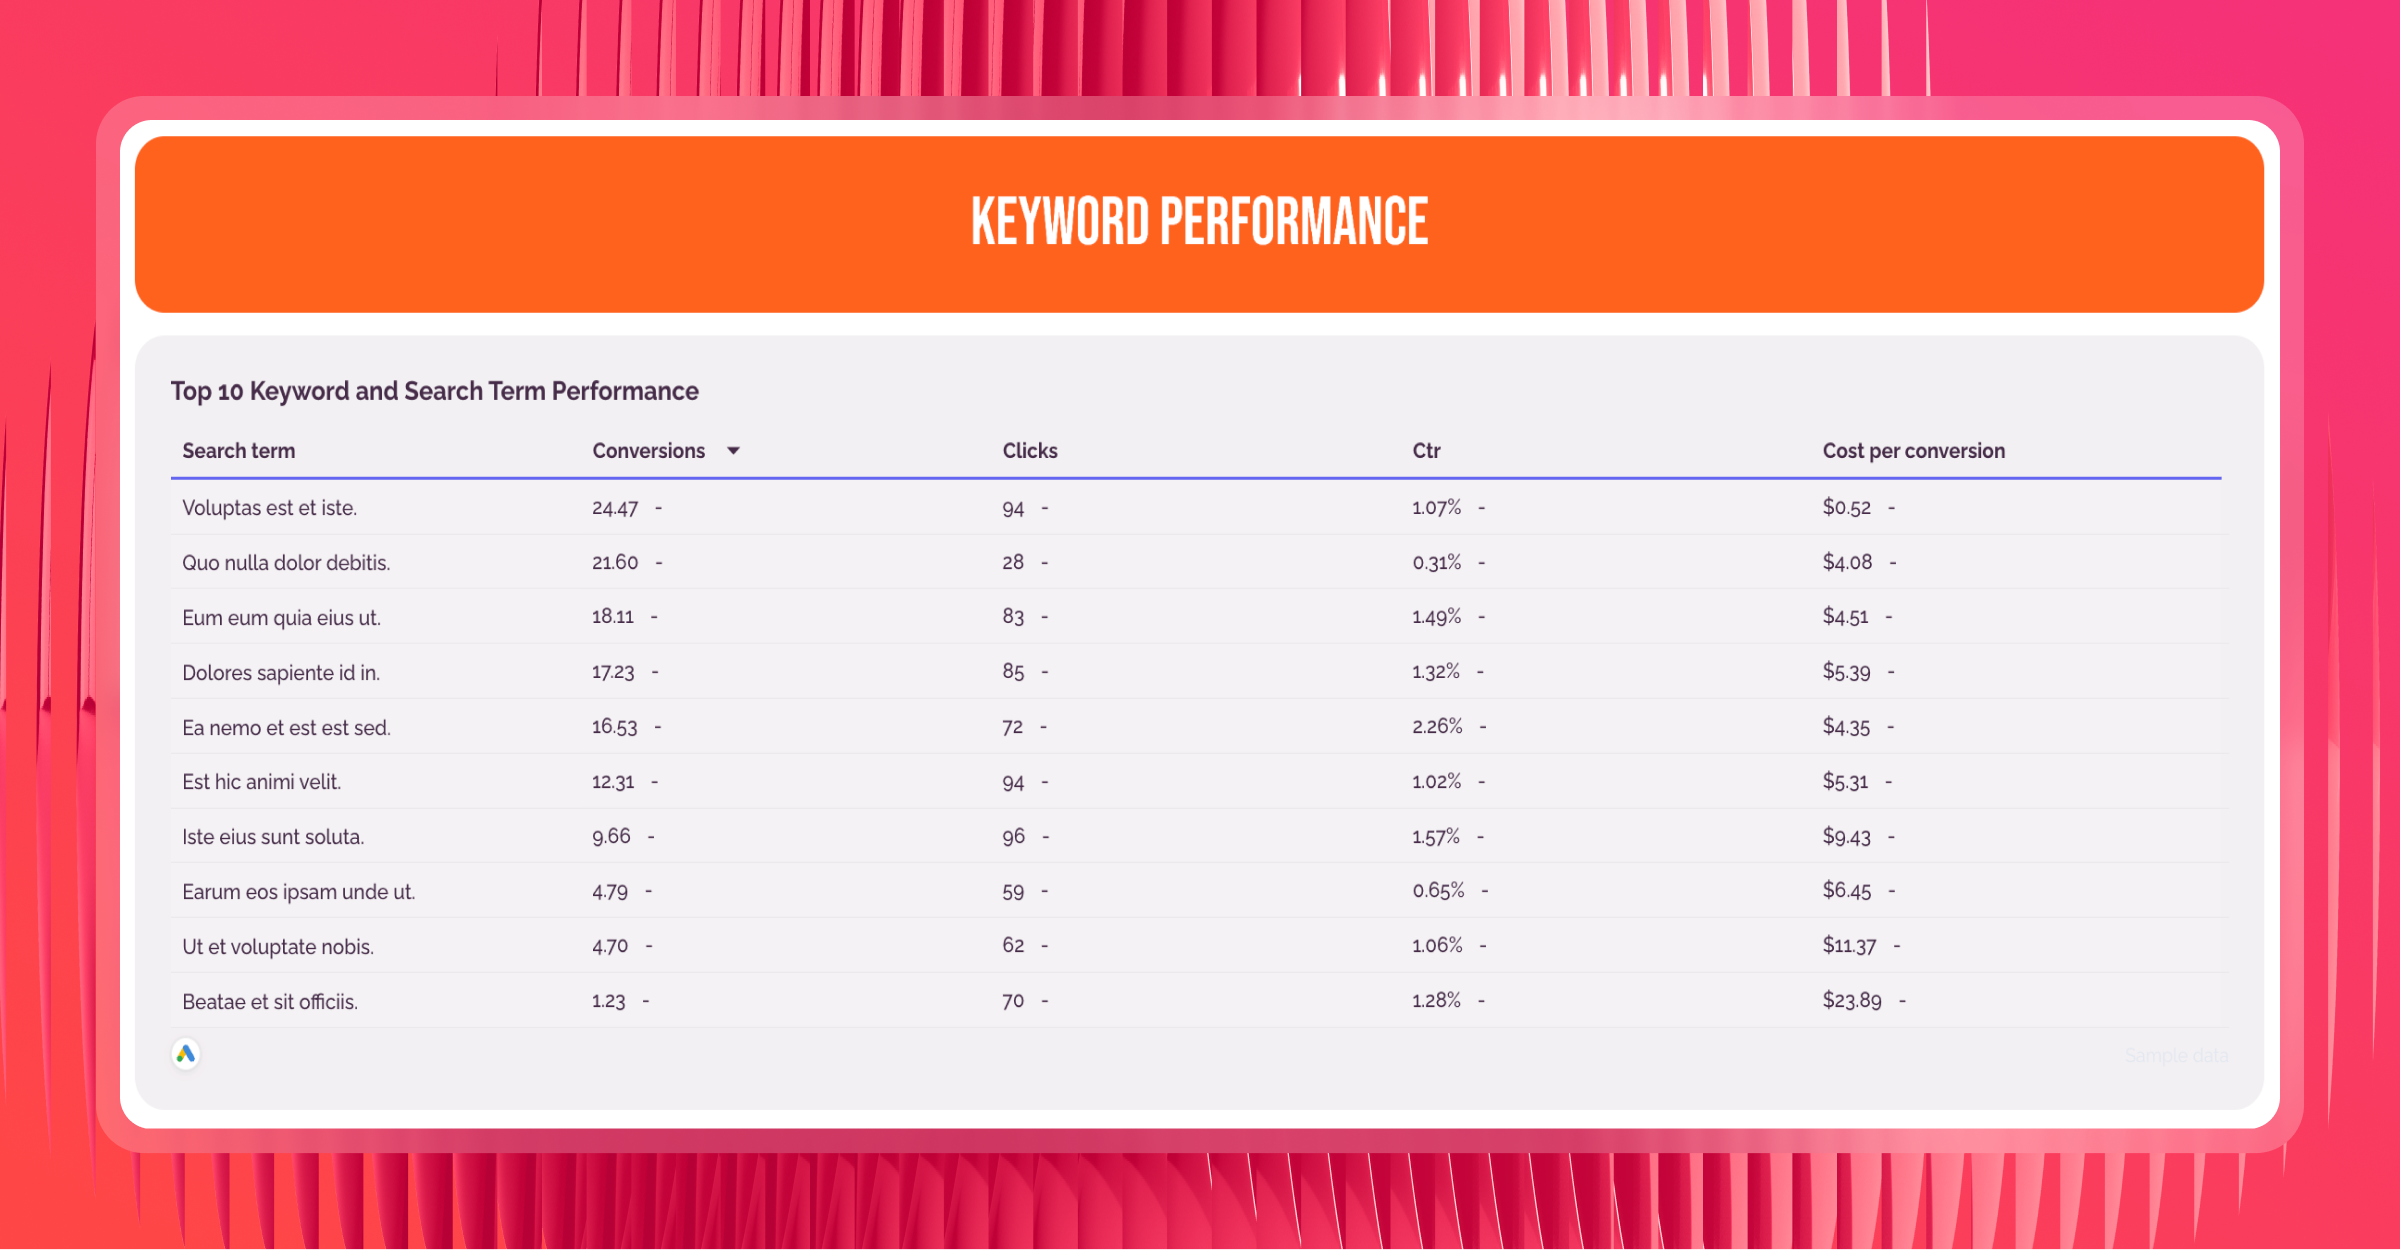
Ameet surfaces the actual search queries that drove conversions, not just the keywords the account was bidding on.
A top 10 table shows Search Term, Conversions, Clicks, CTR, and Cost per Conversion — giving you the foundation for decisions about which terms to invest in and which to exclude.
6. Performance Max Visibility
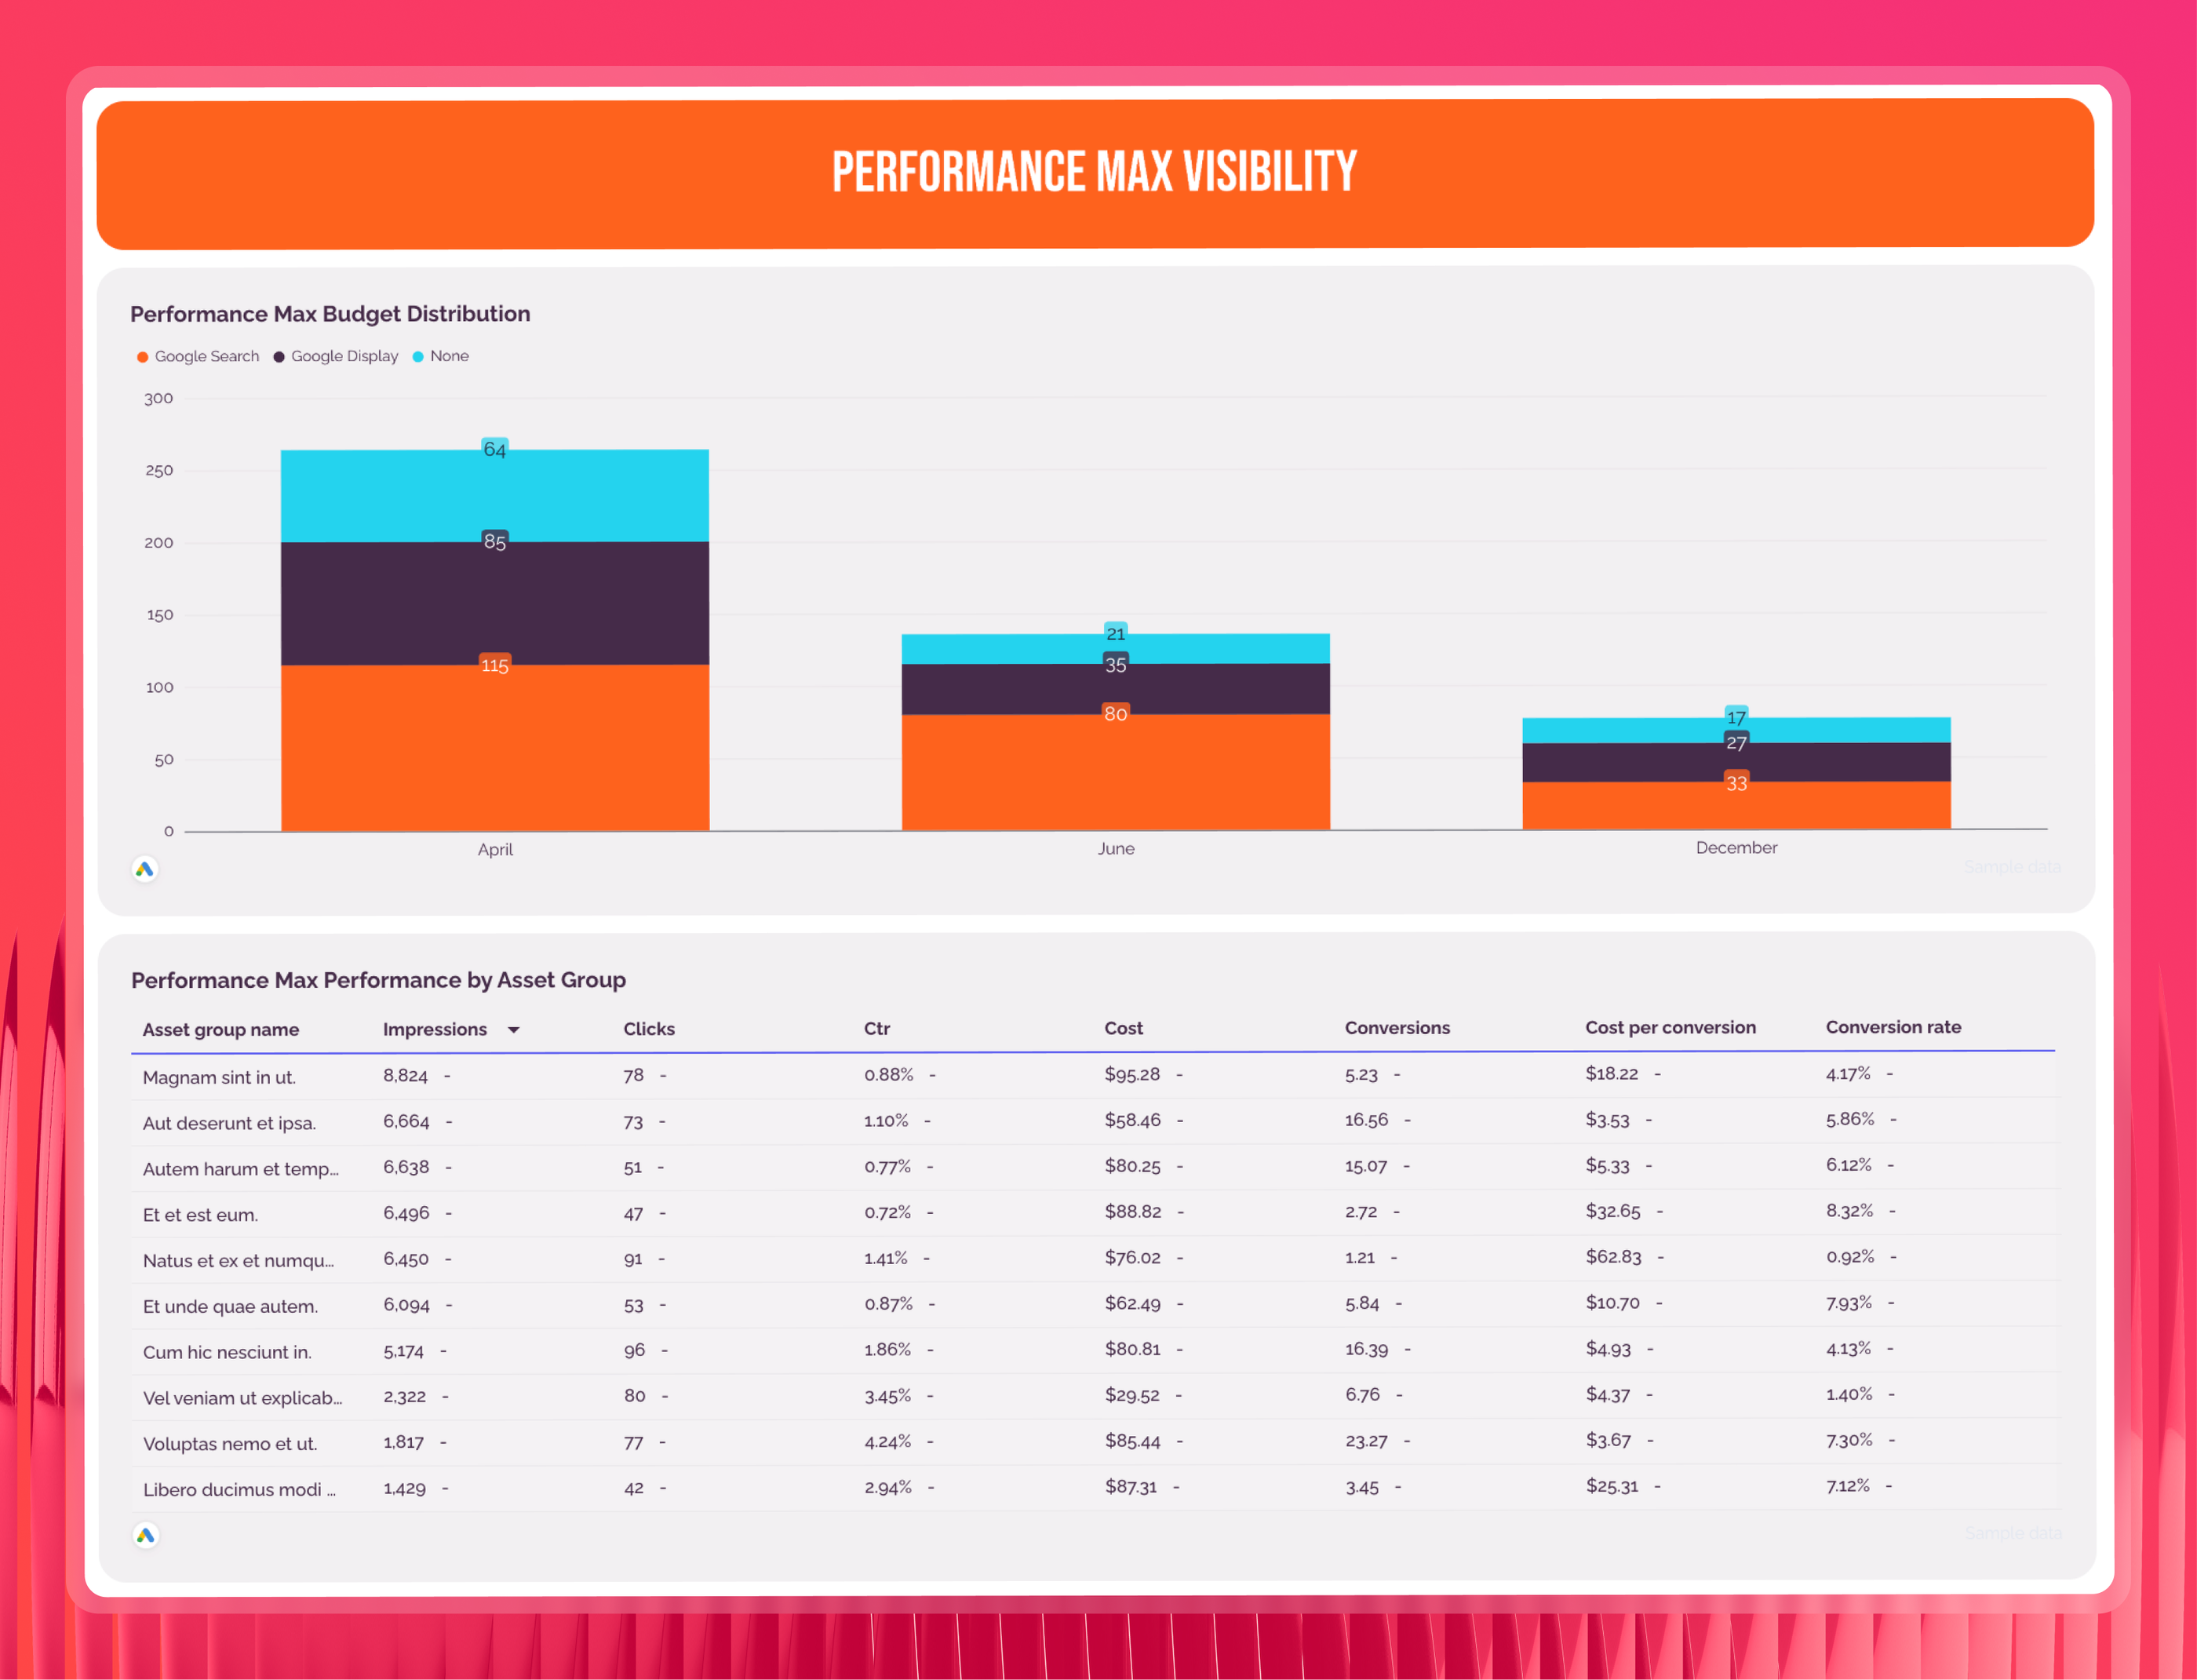
This section only appears when Performance Max campaigns are active. It shows which channels — Search, Display, YouTube — Performance Max is using each month, alongside performance by ad asset group. Ameet includes this because without it, it's impossible to know whether Google's algorithm is prioritising placements that actually drive leads or drifting toward cheaper clicks that don't convert.
7. Key Metrics by Week
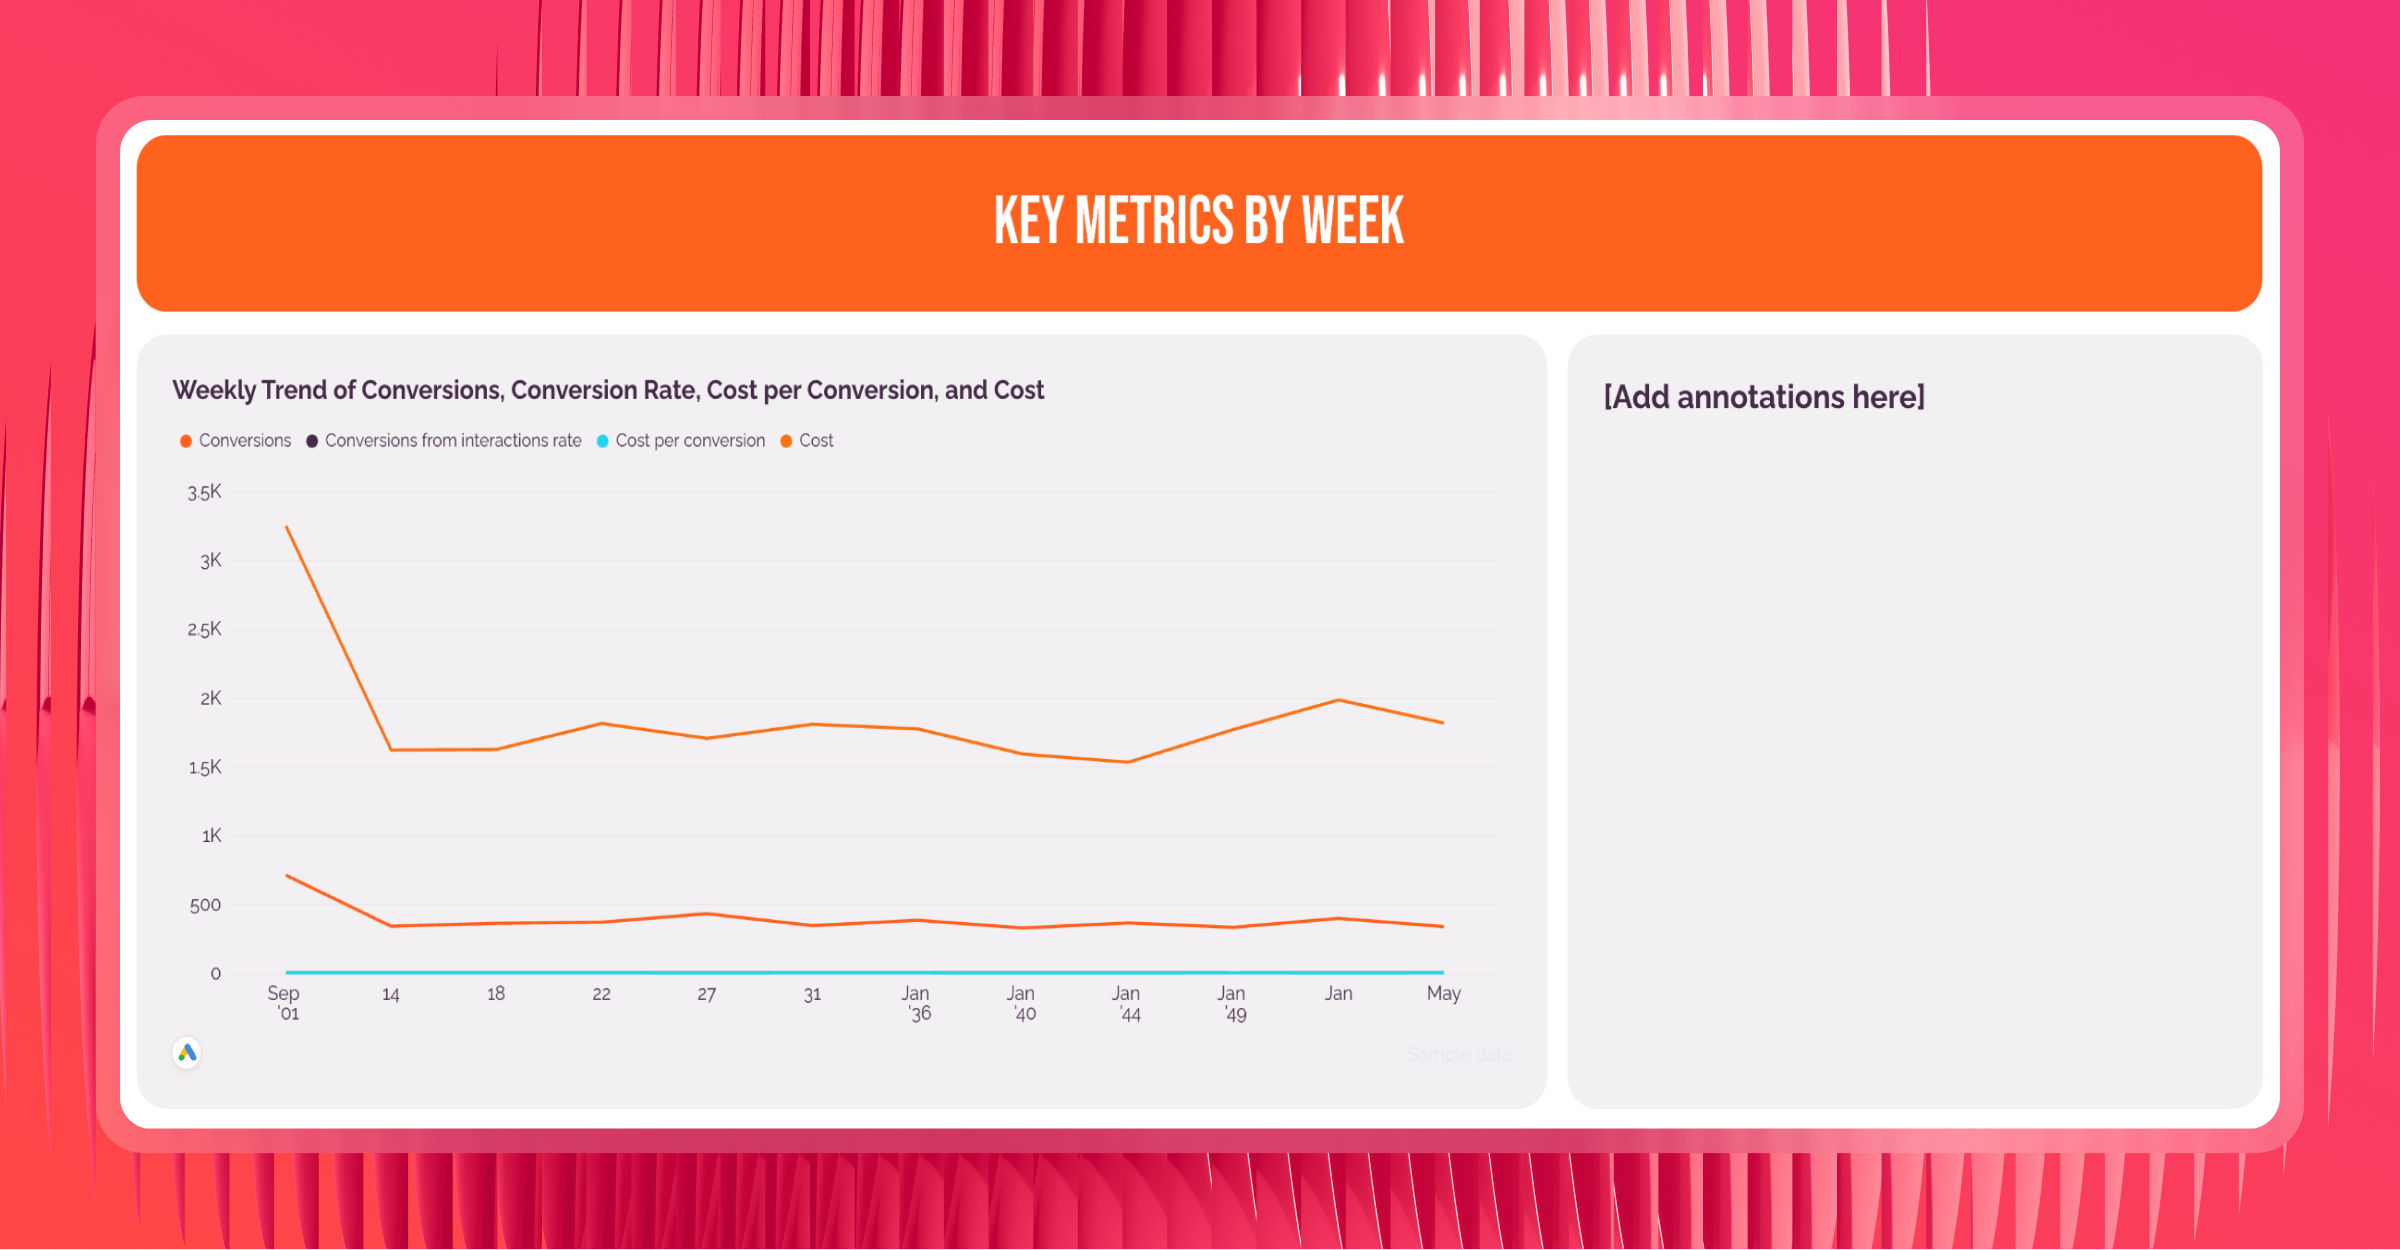
Ameet plots Conversions, CVR, Cost per Conversion, and Cost week by week over the past 13 weeks. Weekly data smooths out day-of-week noise — lead gen typically slows on weekends — so clients see genuine performance trends rather than reacting to individual spikes.
8. Overview and Next Steps
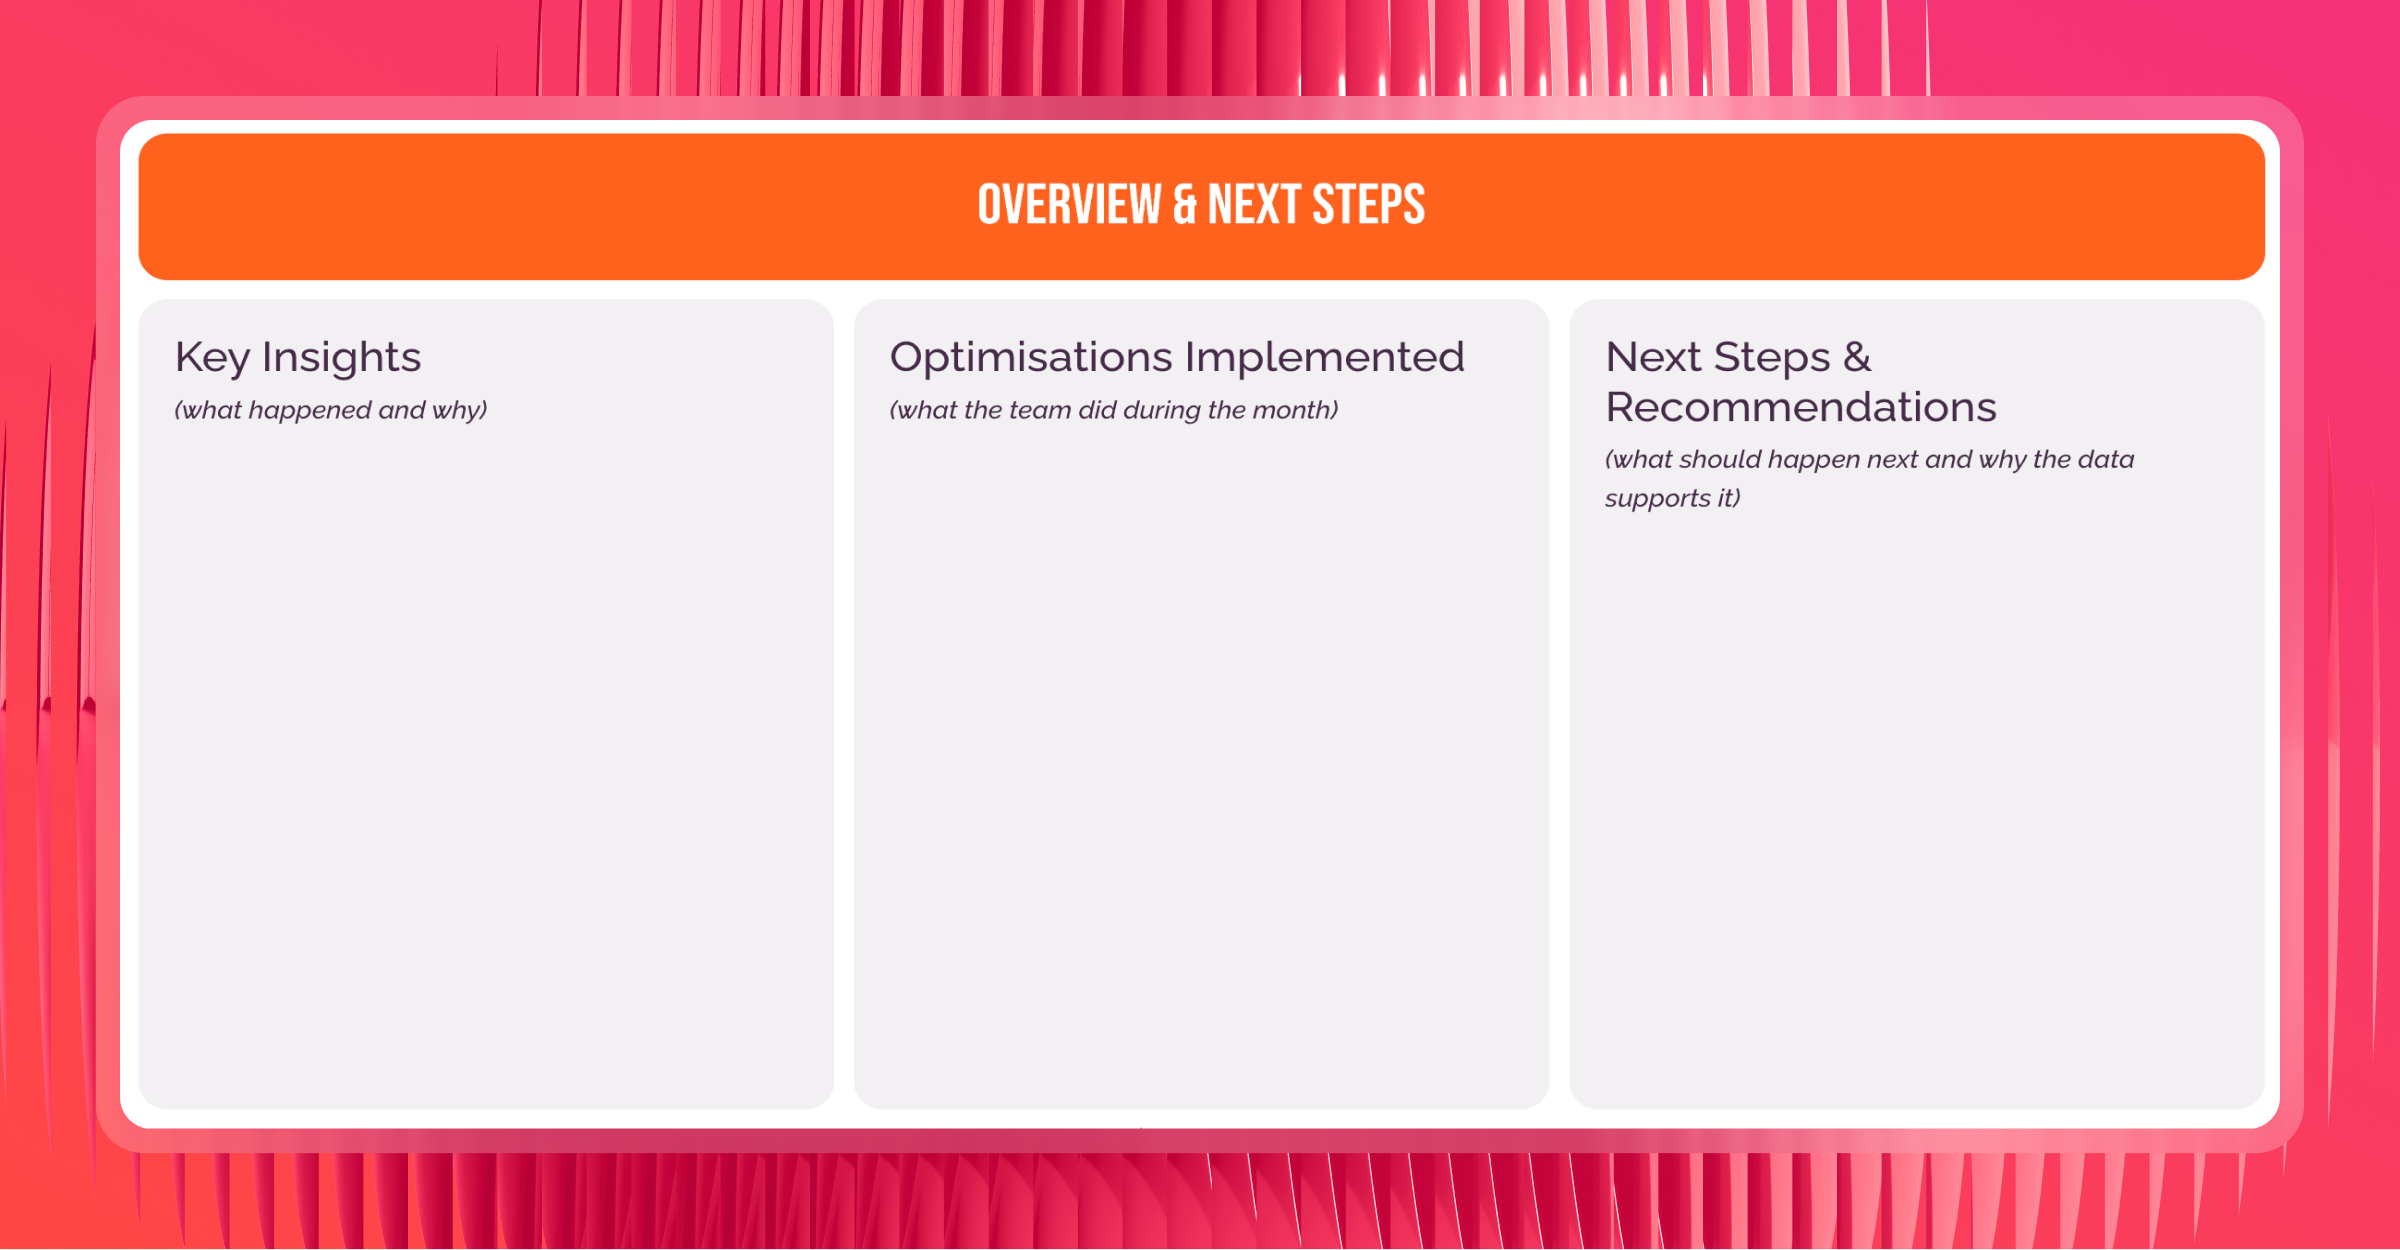
This is the section clients actually read. It covers three things:
- Key Insights on what happened and why
- Optimisations Implemented during the month
- Next Steps and Recommendations backed by the data
It's the only section that requires analyst input, everything else is automated.
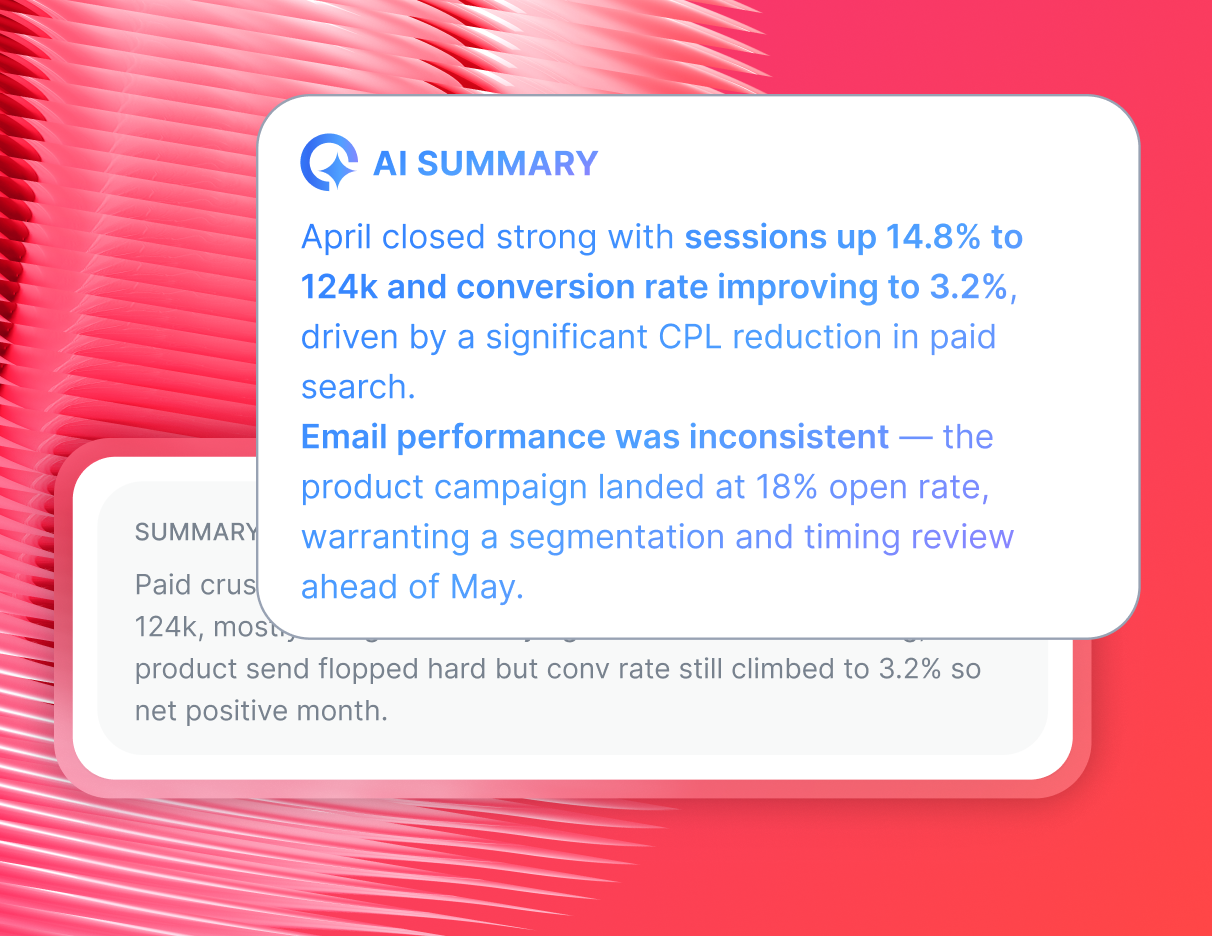
With Whatagraph IQ, you don't have to write it from scratch. Just ask AI to generate the performance summary, choose your format, and edit for tone before sending.
Want to replicate this exact report structure? Grab this Google Ads report template co-created with Ameet.
Here are more report templates co-created with top performance marketers you can use right away:
How do I track Google Ads performance?
Tracking Google Ads performance doesn't have to mean logging into Google Ads, exporting CSVs, and piecing everything together in a spreadsheet.
With Whatagraph's automated PPC reporting software, you can go from data connection to client-ready Google Ads performance report in under 30 minutes.
Here's how:
1. Connect Google Ads
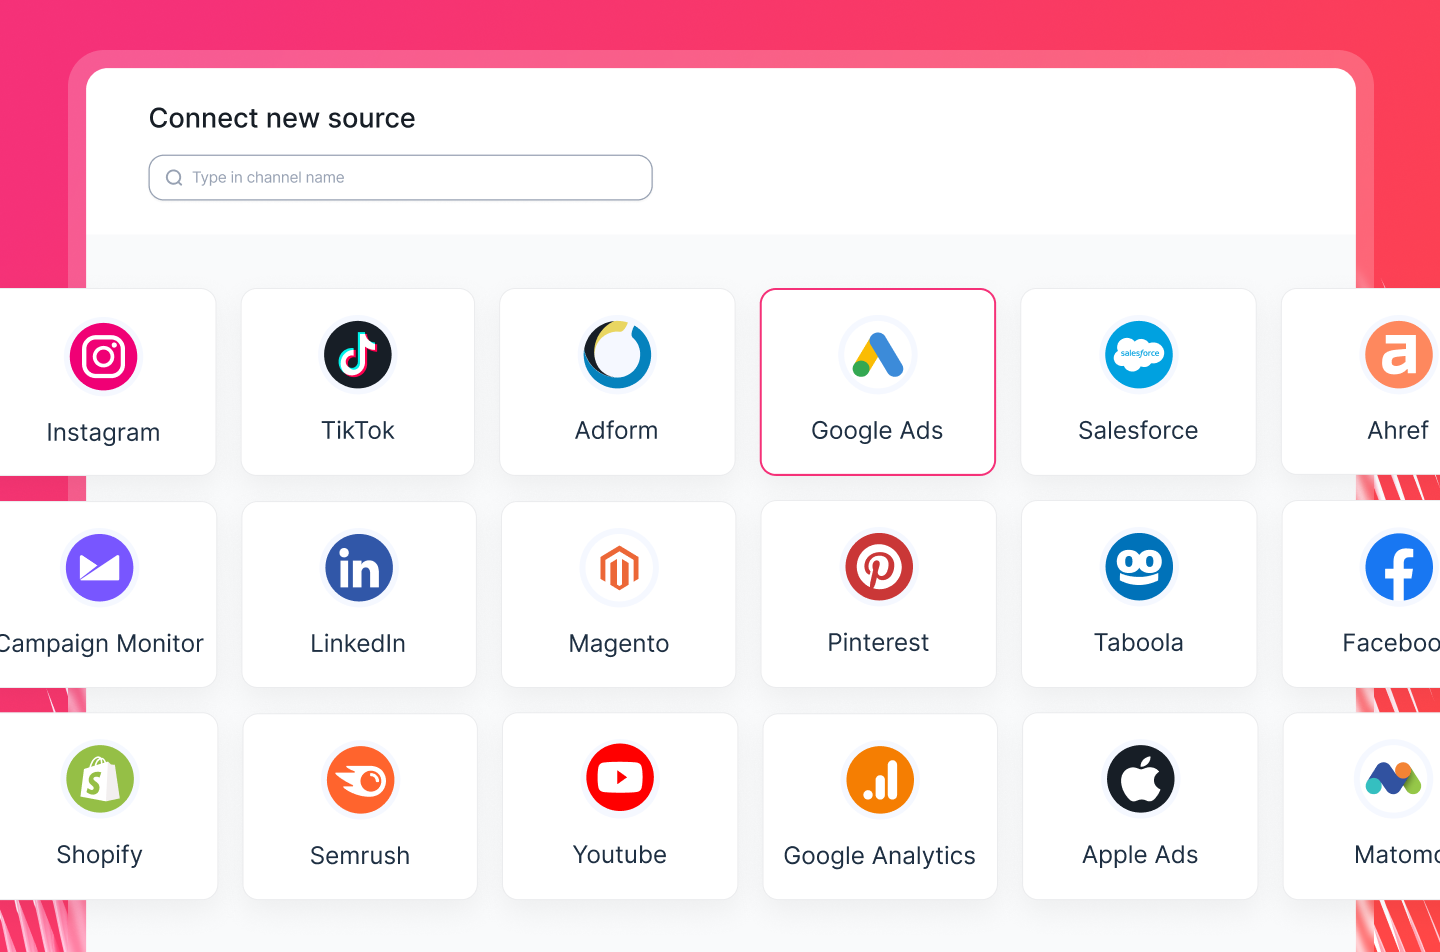
Start by connecting your Google Ads account through a native, plug-and-play integration.
From your Whatagraph workspace, choose Google Ads as your source, authenticate with your login, and you're done. No devs, no APIs, no third-party connectors. Setup only takes a few minutes, and your campaign data starts flowing in automatically.
You can also pull in data from GA4, other PPC platforms, or use Google Sheets or API connections for custom sources.
We support 55+ integrations in total, including:
- PPC: Google Ads, Meta Ads, LinkedIn Ads, Pinterest Ads, TikTok Ads
- Social: Instagram, TikTok, YouTube, Facebook
- E-commerce: Shopify, BigCommerce, Magento
- SEO & Analytics: GA4, Semrush, Ahrefs, SE Ranking, Matomo
- Email: Mailchimp, ActiveCampaign, Constant Contact
Plus, Whatagraph's integrations are fully managed and extremely stable. Uptime has averaged 99.95% over the past 6 months. If system outages occur, engineers are notified immediately (even at 3am).
2. Organize your data
Once connected, clean things up. Standardize campaign naming, unify metrics across platforms, and align currencies if needed.
With Whatagraph, you can:
- Group campaigns by channel, ad group, geo, or audience
- Filter by platform, device, or custom segments
- Standardize metric naming across platforms and accounts
- Blend cross-channel data (e.g., Google Ads + Facebook Ads in one view) as a PPC reporting tool that integrates with GA4
- Apply tags and folders to organize by client, account manager, or region
With Whatagraph IQ Dimensions (available on advanced pricing plans), you won't need to play around with formulas to create custom dimensions.
You can just ask AI to:
- Create custom blends automatically. Just describe what you need, like "combine all spend from Google Ads, Meta, and LinkedIn into one unified Paid Media metric," and IQ builds the blend for you.
- Build custom metrics on the fly. Want ROAS across channels? Or a funnel KPI like cost per conversion? IQ can generate them instantly, without formulas or coding.
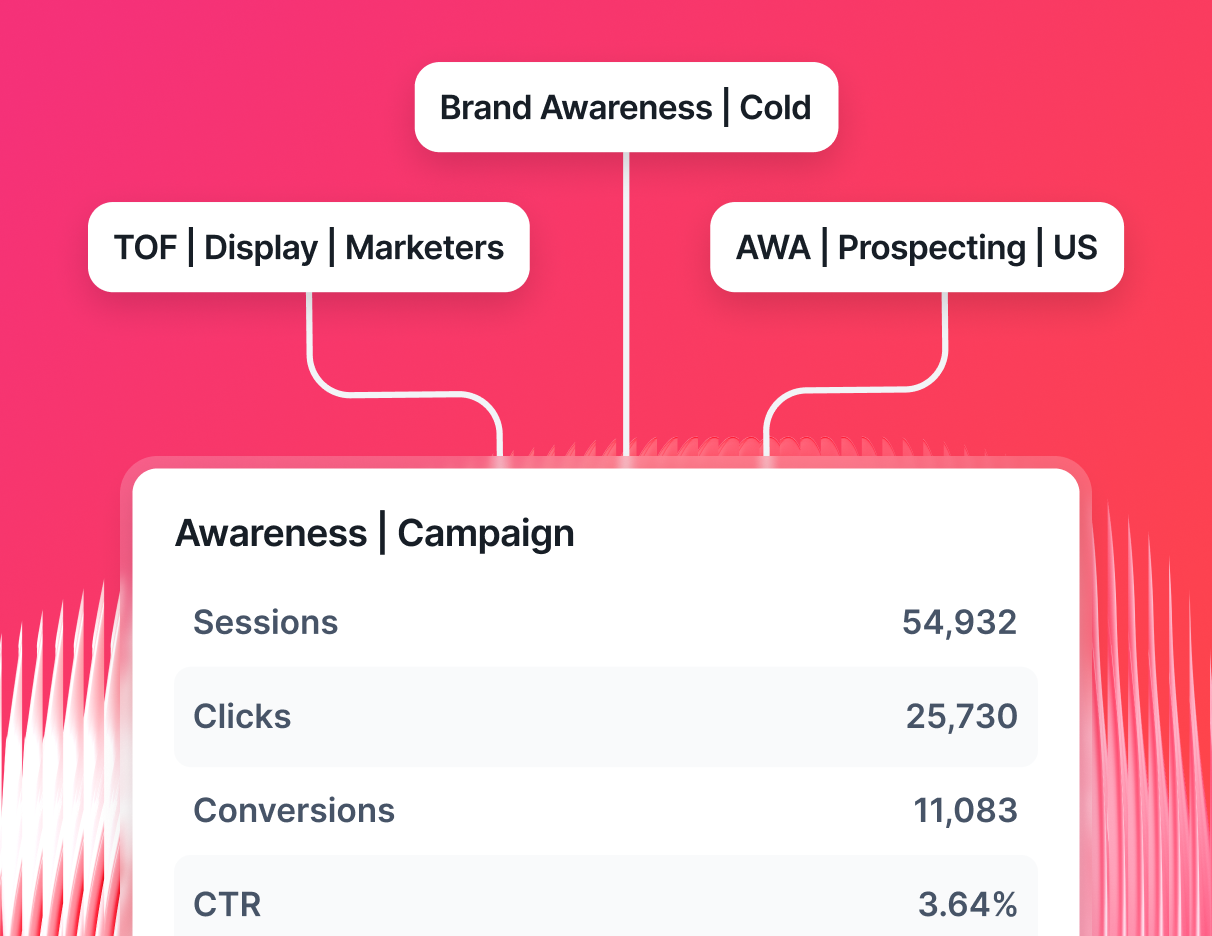
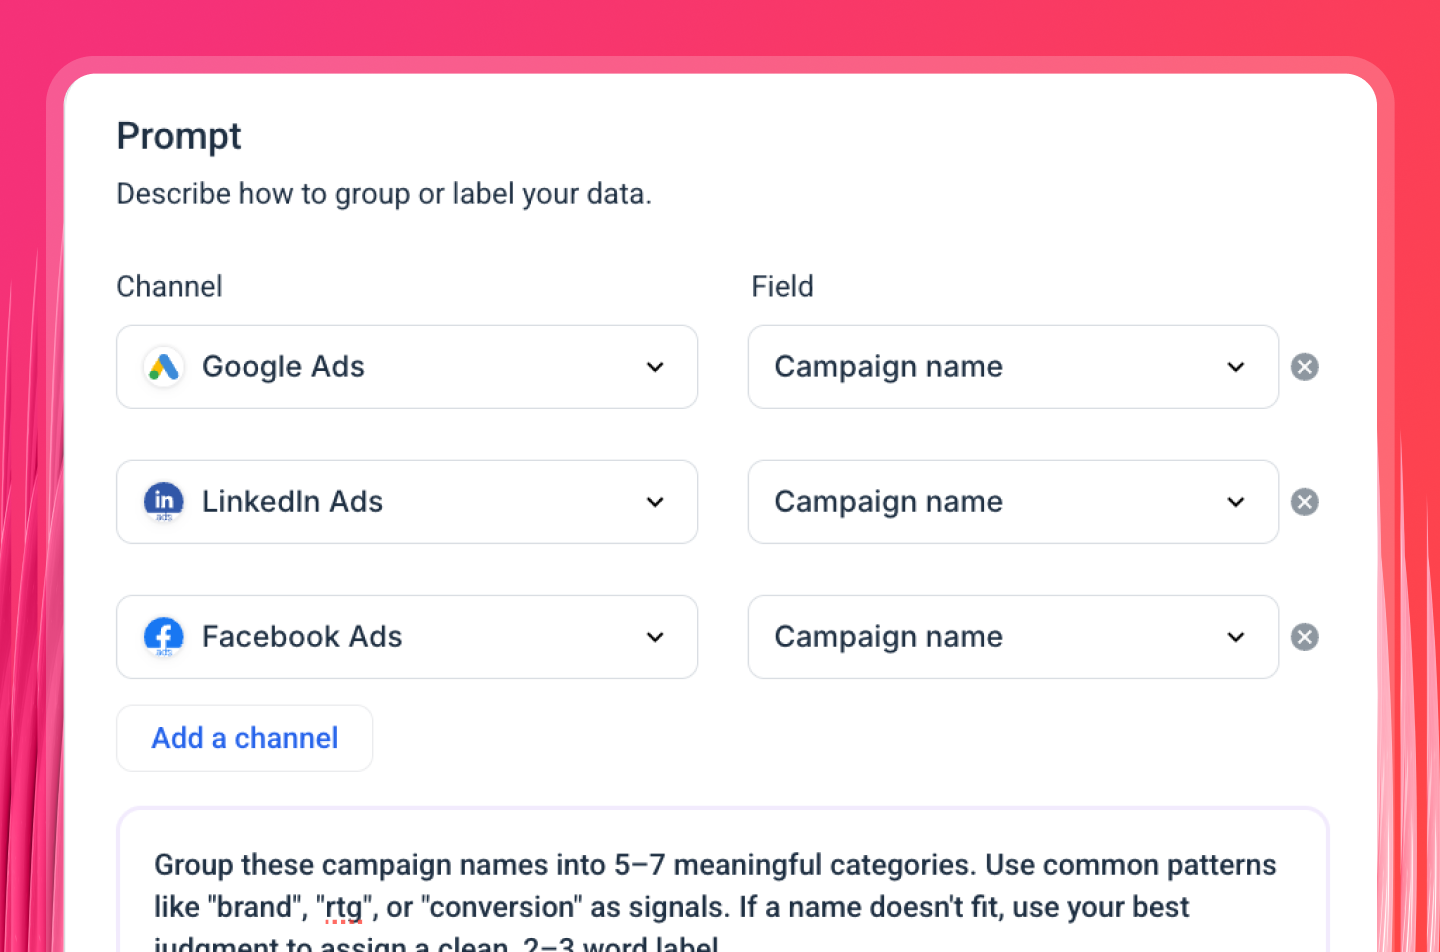
- Standardize messy data with IQ Dimensions. If you've got campaign names like "GGL_US_SpringSale_23" and "GoogleUSA_Spring23," just tell IQ: "Group by Campaign Type: Spring Sale." IQ creates a brand-new dimension that neatly categorizes everything, and you can reuse it across reports.
- Normalize any dimension at scale. Group campaigns by objective, keywords by match type, or accounts by region. IQ makes sense of inconsistent data and saves hours of manual clean-up.
3. Create automated Google Ads reports for clients
With Whatagraph IQ, building client-ready Google Ads reports for clients isn't a manual drag-and-drop exercise anymore. It's as simple as asking AI.
- Generate full reports instantly: Just type what you need, and IQ builds the entire Google Ads campaign report including charts, KPIs, tabs, and layouts.
For instance you can just type in “Create a white-labeled Google Ads report for my client”, and it’s done.
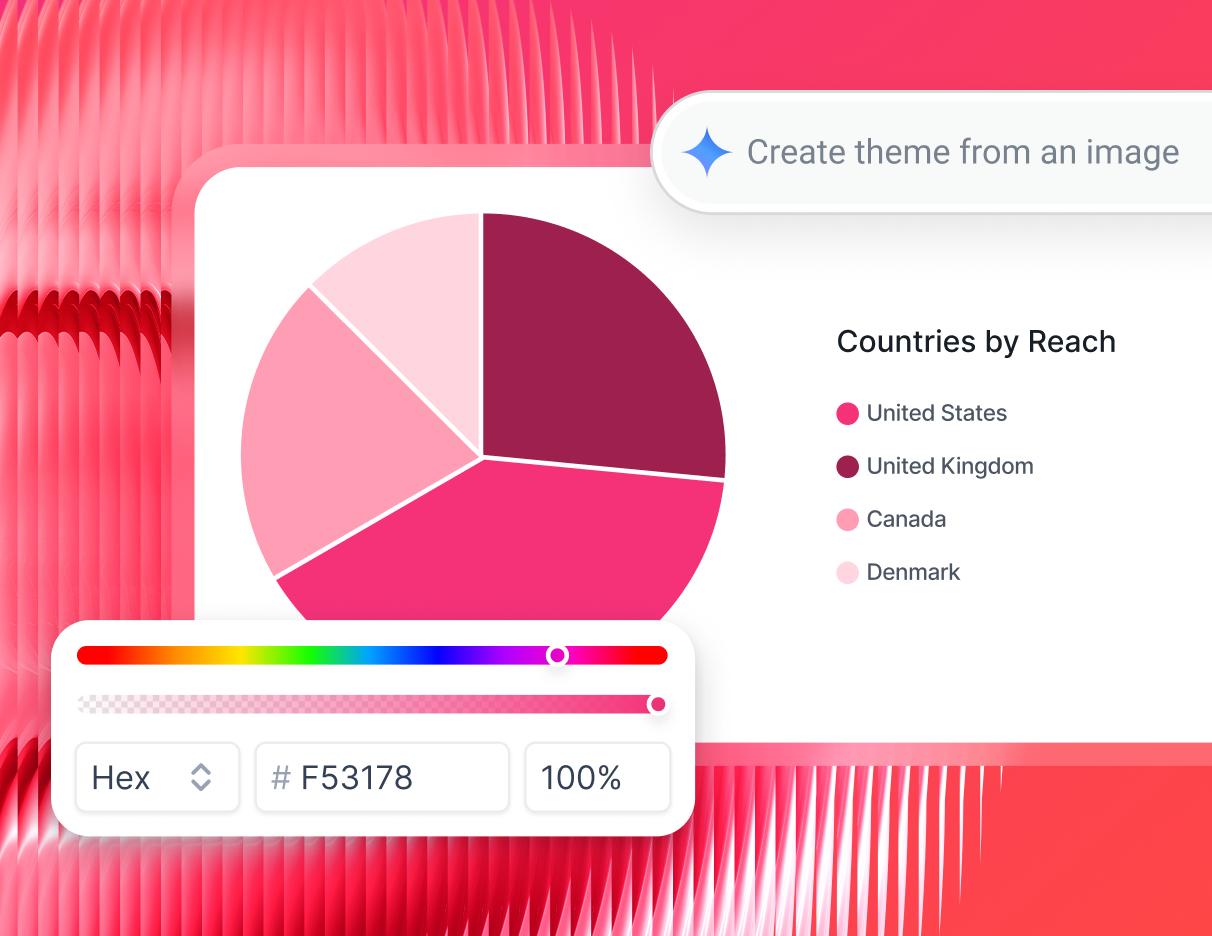
- Style it automatically: Upload a client logo or image, and IQ Themes generates a branded look with fonts, HEX codes, and icons to match.
- Explain results in plain English: IQ Summaries add clear, on-brand performance insights you can edit and send straight to clients.
Want full control? Start from a blank canvas and drag-and-drop your report layout using customizable widgets and visualizations.
With every widget, you can:
- Change the label, size, icons, and layout
- Apply custom formulas
- Match color schemes to client or agency branding
- Choose reporting periods, set currencies, or hide sections
- Insert or rearrange rows, columns, and headers
Pro tip: Save your Google Ads client reports as team templates and reuse them across clients. Better yet, use linked templates to automate report editing. You only edit the "master" template once, and your changes sync across every report linked to it.
4. Create internal dashboards to monitor performance
Want an internal Google Ads performance dashboard with more granular details? You can easily create one on Whatagraph called "Overviews."
Use Overviews to:
- Track KPIs across all Google Ads campaigns and clients in one place
- Flag campaigns that are wasting budget or hitting targets
- Monitor Account Manager performance at a glance
- Set custom limits (e.g., ad spend caps) and goals (e.g., CTR benchmarks)
Slice by channel, client, manager, or region. This lets your team make faster, smarter decisions without checking 10 different platforms. And if you want to know which Google Ads campaigns are wasting budget, just ask.
5. Use AI to write summaries and answer performance questions
Clients don't want a wall of graphs and numbers. They want clear takeaways, and now your team doesn't have to write them from scratch.
Whatagraph AI helps you:
- Generate Google Ads performance reporting summaries based on any campaign, date range, or account
- Summarize Google Ads campaign performance for a client meeting
- Choose short or long format, then tweak tone and messaging
Try it out here:
For your internal team, they can ask questions like:
- “show me which Google Ads campaigns are wasting budget”
- “compare Google Ads performance across all my client accounts”
- and get real-time answers in plain English.
It's like Claude, but trained on your actual Google Ads data.
6. Share and automate monthly Google Ads reports for all clients
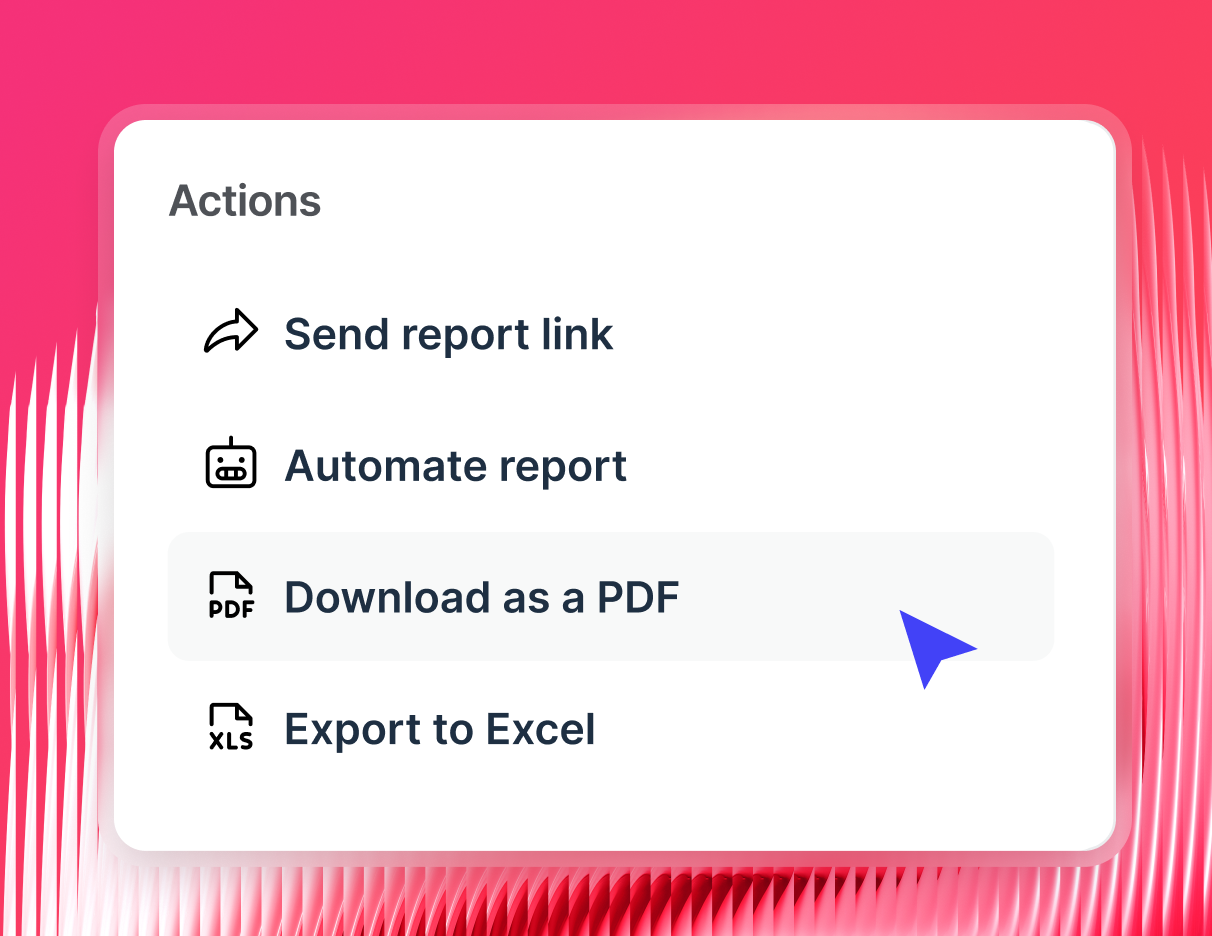
Once your Google Ads custom reports are ready, you have multiple sharing options:
- Automated emails: Set up automated Google Ads reports on any cadence, weekly, monthly, or quarterly
- Live links: Clients get access to real-time data with no logins needed
- PDF or CSV exports: Perfect for internal archives or offline access
- White-label delivery: Use your own custom domain and sender details
You also have the option to export Google Ads reports into BigQuery for long-term storage, or send Google Ads reports to Google Sheets for teams that prefer working in spreadsheets.
What performance metrics to include in a Google Ads campaign report?
When you're using a Google Ads dashboard, it’s not enough to just show raw numbers—you need to show the metrics that matter. Here are the core metrics you should always include in your reports:
- Impressions: Shows how often your ads were displayed. Helps measure visibility and reach.
- Clicks: Tracks how many users interacted with your ad. A key indicator of ad engagement.
- Click-Through Rate (CTR): Ratio of clicks to impressions. High CTR means your ads are relevant and engaging.
- Conversions: Counts how many users completed a desired action (purchase, signup, etc.). Core performance metric.
- Conversion Rate: Percentage of clicks that resulted in a conversion. Reflects how effective your landing page and offer are.
- Cost: Total ad spend during the reporting period. Essential for budget tracking.
- Cost Per Conversion (CPA): How much you spend to generate one conversion. Helps assess efficiency and ROI.
- Average Cost Per Click (CPC): Shows the average amount paid per click. Useful for monitoring bid strategy and cost trends.
- Return on Ad Spend (ROAS): Measures revenue earned for every dollar spent. A key profitability indicator.
- Top-performing locations: Identifies which countries or regions are driving the most impressions, clicks, and conversions.
- Keyword performance: Tracks clicks, CTR, CPC, and conversions for each keyword. Helps optimize targeting and reduce wasted spend.
- Landing page performance: Measures how landing pages perform after a click. Critical for spotting UX issues and improving conversion rates.