Amazon Ads Dashboard
Running Amazon ads on the pay-per-click model? How do you track their performance? Use our Amazon Ads dashboard to monitor the essential Amazon advertising metrics such as impressions, click-through rate (CTR), cost of sales (ACOS), and return on ad spend (ROAS). Pull data directly from your Amazon Ads account to our dashboard and use the insights to optimize the ad creatives and boost conversions for you or your clients.
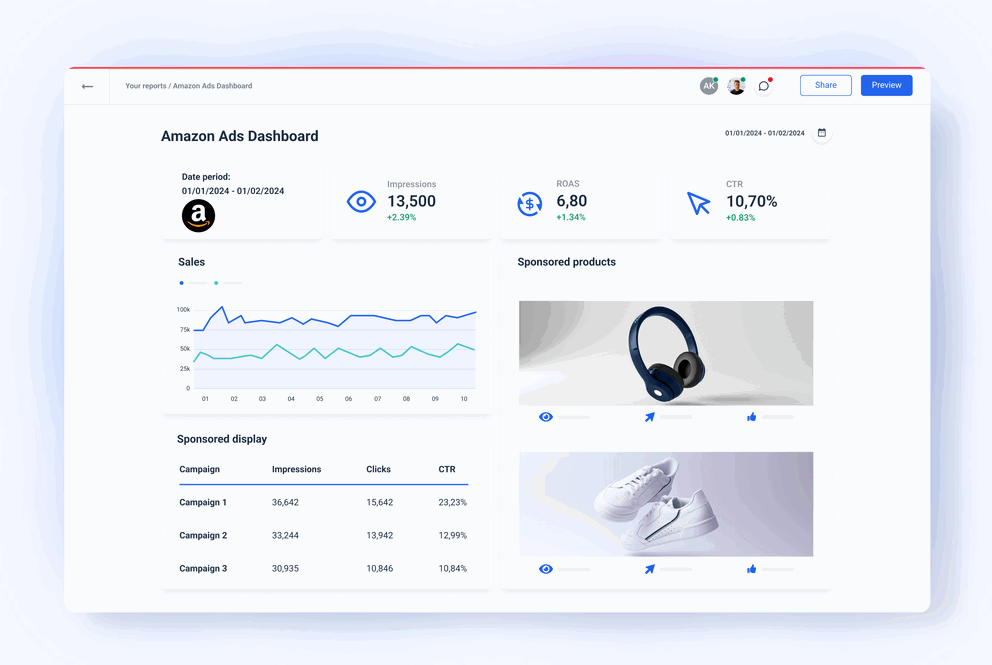


All Amazon Ads KPIs beautifully presented in one dashboard
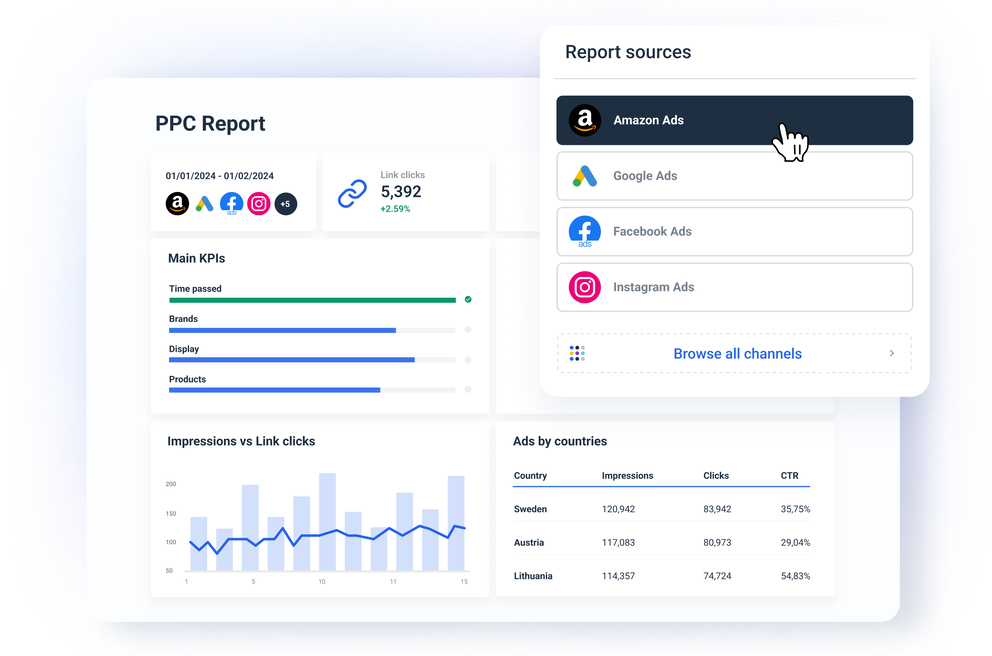
Connect your Amazon Ads and take your seat
Once you add Amazon Ads as a data source, your job is done. The data in your dashboard refreshes every 30 minutes, so you never fall behind the latest developments. Effortlessly combine Amazon Ads analytics with data from your other PPC or e-commerce platforms to get the full picture of your marketing and sales efforts. Visualize all metrics available from the Amazon API or create your own metrics using intuitive custom formulas.
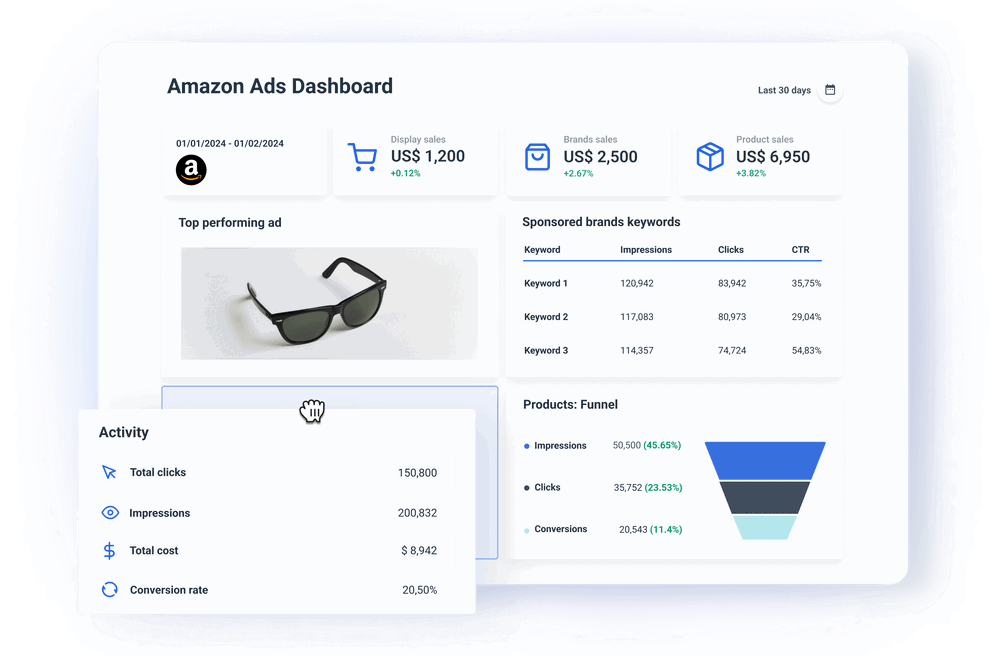
Easily present your Amazon PPC performance
Learn how each Amazon Ads campaign is performing in terms of impressions, clicks, costs, and attributed sales or conversions. Monitor sponsored brand keywords, Amazon sponsored product ads, and sponsored displays. Use our media widgets to display ad creatives with the most conversions. This way, you can easily understand what is working and what is not. Blend user actions from different campaigns or group them by region.
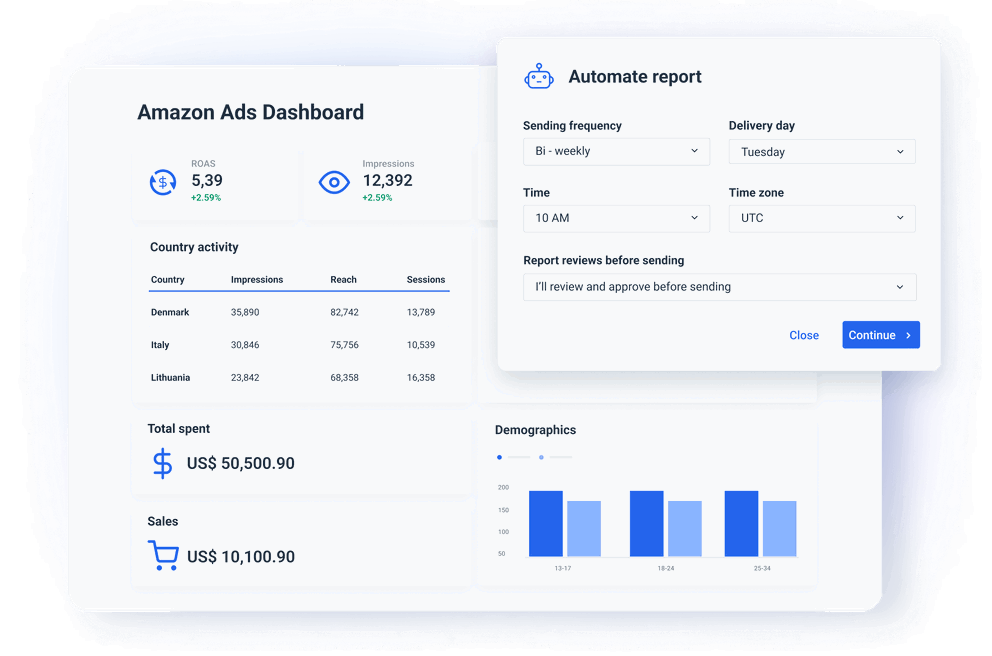
Save time managing Amazon Ads data
Whatagraph helps you automate much of your data-related tasks. Once you hook up your Amazon Ads account, the connection is self-managed, and the data updates in your dashboard automatically. Any blends or transformations you apply can be saved, reused, or tweaked by anyone in your team. Use our beautiful Amazon Ads dashboard template to visualize data or build your dashboard from scratch in our intuitive drag-and-drop builder. Finally, share the dashboard via a live link for 24/7 on-demand access.
What is an Amazon Ads dashboard?
An Amazon Ads dashboard is a marketing dashboard you can use to display all the essential Amazon advertising metrics in a visually engaging way that is easy to understand. It’s a central information hub for marketing agencies whose clients sell on Amazon or in-house marketing teams to share the results of their marketing efforts.
All dashboard features your agency needs


Frequently Asked Questions
How to monitor Amazon Ads campaigns?
To monitor your Amazon Ads campaign, you should create an Amazon DSP advertising account, use Amazon marketing services (AMS), or start using Whatagraph’s services.
You should have an Amazon Ads dashboard whether your goal is to run Amazon KDP (Kindle Direct Publishing)Ads to increase your book sales, raise your business's brand awareness, or drive more sales.
Using Whatagraph has multiple advantages:
- Cross-platform insights - This will help you to take a look at your overall PPC or even your entire digital marketing picture;
- White label - Customize dashboards to match your client’s brand and make looking at data more engaging;
- Automation - Don’t miss another deadline by sharing a live dashboard link with your clients. This way, they are updated whenever there is a change or on agreed terms.
These features will not only make creating dashboards easier but will also allow you to effortlessly track your ad campaigns and product targeting.
Can I track the Amazon Ads performance of multiple clients with Whatagraph?
You can track the Amazon Ads performance for multiple clients using Whatagraph’s Overview feature. The Overview dashboard is a good option if you have a lot of clients or channels to manage. You can use it to track targets and limits or gather insights for different campaigns running on different channels for different clients.
What Amazon Ads metrics should I include in a client dashboard?
Only the most important ones! By showing relevant metrics and KPIs, you can keep your client dashboard brief and engaging. These are some examples:
- Cost;
- CTR;
- CPC;
- Conversions;
- CPM;
- Clicks;
- Impressions;
- Sales.
What other data can I bring to my Amazon advertising dashboard?
In short, you can bring any data you have. Apart from popular advertising solutions such as Google Ads and Facebook Ads, Whatagraph has native integration with 45+ popular marketing data sources. For example, you can integrate your Google Analytics 4 account to gauge the performance of your website or add SEO insights to monitor the keywords that bring you the most traffic. Apart from those integrations, you can connect any source by building a custom API or importing the data via Google Sheets or BigQuery.
Is Whatagraph easy to use for beginners?
Yes, Whatagraph is easy to use even if you don’t have previous data experience. Every data operation is made to be intuitive, so even beginners can quickly learn how to connect, organize, visualize, and share their data.
Once you apply for a free trial, you’ll be kindly asked to book a demo where an account executive will show you the basics step-by-step. If you encounter a problem, you can always contact our support team via live chat or search for the video tutorial in our help section.
It’s good to be loved! Our clients are not shy about expressing it.
I made a switch from GDS and Sheets for reporting to Whatagraph, and I am saving literal hours each week on performance report creation. Our small firm actually managed to onboard 2 new clients as a result of all the time we saved on managing data and reporting. The customer service is also really helpful and easy to reach.

Capterra verified review by
Mindaugas S., Marketing Consultant
Having active customer support to help fix any issues was a big contributor, but we also really liked the ability to save templates and connect sources to multiple charts/widgets at once without having to edit them individually. And having the grid layout is much easier to stay consistent with than the free form setup that Data Studio has.

Capterra verified review by
Nico T., Media Planner
The system has standard templates that are easy and fast to use. Also you can build your own report with lightning speed. It is very easy to use, has a lot of integration, and let get started very fast.

Capterra verified review by
Rasmus Bernt K., External Senior Management Consultant
We love Whatagraph - we would definitely recommend and our account manager is great! I love how easy this tool is to use, everyone on the team finds it much more user-friendly than other dashboards. Integration was easy, we sent some example reports to the team who duplicated these for us. We literally had to log in and send it to our clients!

Capterra verified review by
Stephanie S., Digital Director
We are showing our clients the work that we're doing for them and this is incredibly important for our clients ROI. They want to see results and having a tool like Whatagraph that can show data from virtually every source we use is hugely important.

Capterra verified review by
John S., SEO Strategist
The tool is easy to use; you do not need to have development resources. Even my junior project managers are capable of making campaign reports in minutes. There are a lot of pre-made templates you can use as well as many pre-made widgets.

Capterra verified review by
Erman E., Marketing Specialist
Really easy to connect data sources within the tool. The library of report templates has been helpful. The customer support team has been responsive to all of our needs. Our team enjoys the simplicity of setting up the reports and how the data is presented.

Capterra verified review by
Brent N., Director of Operations
Easy to create really beautiful graphs and reports which can help other team members to understand the most important takeaways. I especially like the automated report function, so I don't have to check on the same thing repeatedly.

Capterra verified review by
Orsolya S., Online Marketing Manager