Business Dashboard for Executives
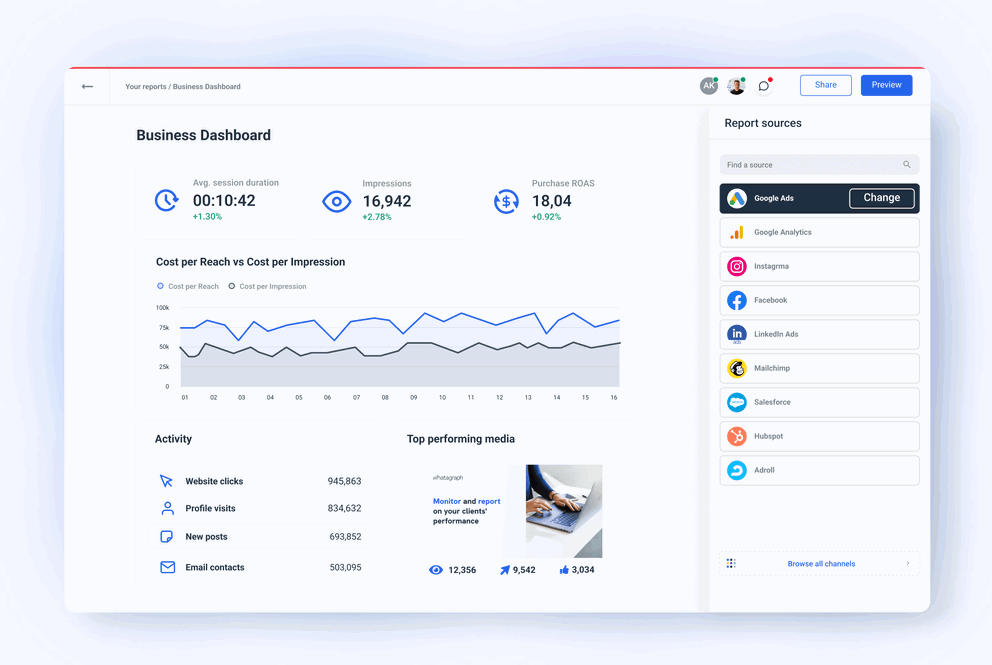
Make informed decisions quickly with the Whatagraph business dashboard. Aggregate data from multiple marketing channels and show it to your clients in real-time. Track your clients’ most important business goals with our widgets and show ongoing campaign progress.


Create Business Dashboards with Whatagraph and improve your client’s business processes today!
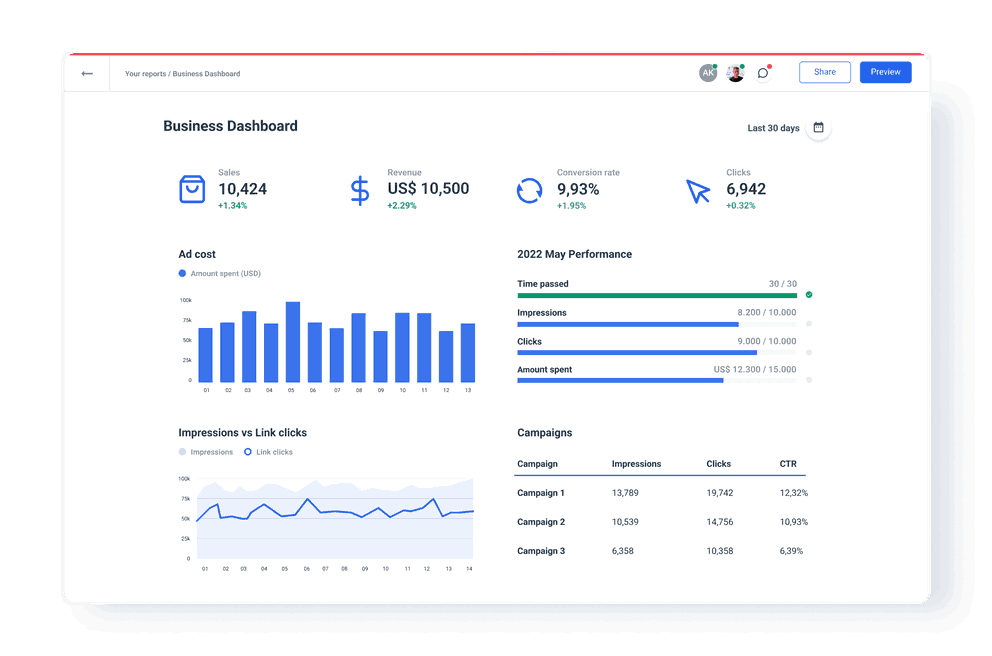
Detailed KPI Business Dashboard
Track the number of sales, revenue, profit margins, or profit your client’s business generates. The Whatagraph business dashboard presents this data as a part of visualizations or tables. Access full visibility into your client’s KPIs and metrics. Dive into data and start analyzing customer retention rates, budgeting, and improving customer satisfaction according to real-life data.
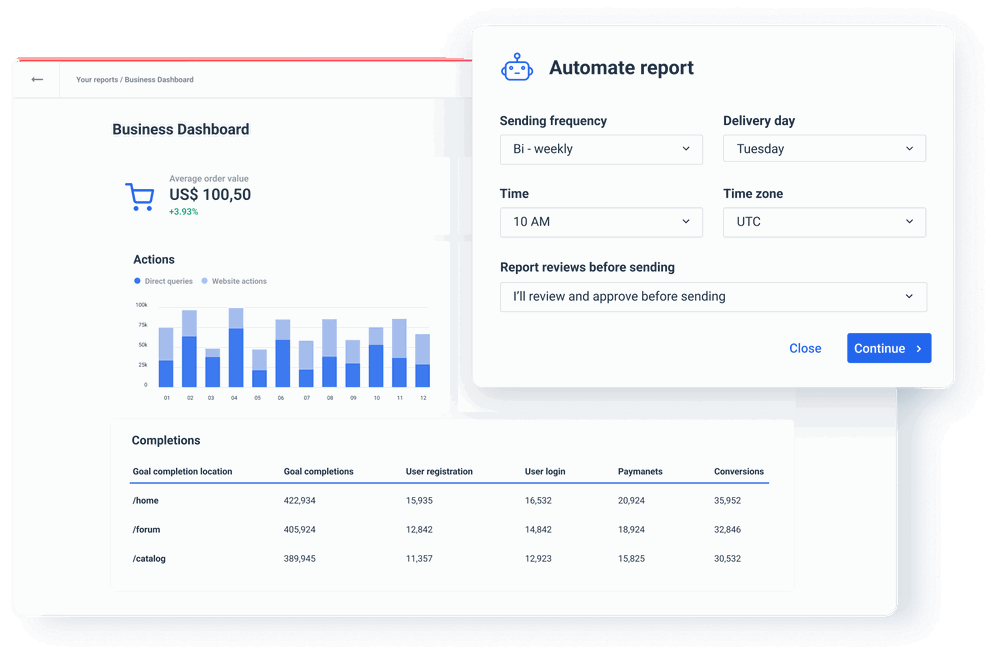
Keep clients up to date with automated dashboards
Send clients an automated business dashboard of their performance! Whatagraph has an automation feature allowing you to set the dashboard to be sent out automatically at the interval you want. You can choose the frequency (weekly, monthly, quarterly, etc), the number of recipients, and the time period you want to report. Keep your client up to date without spending hours creating and sending reports.
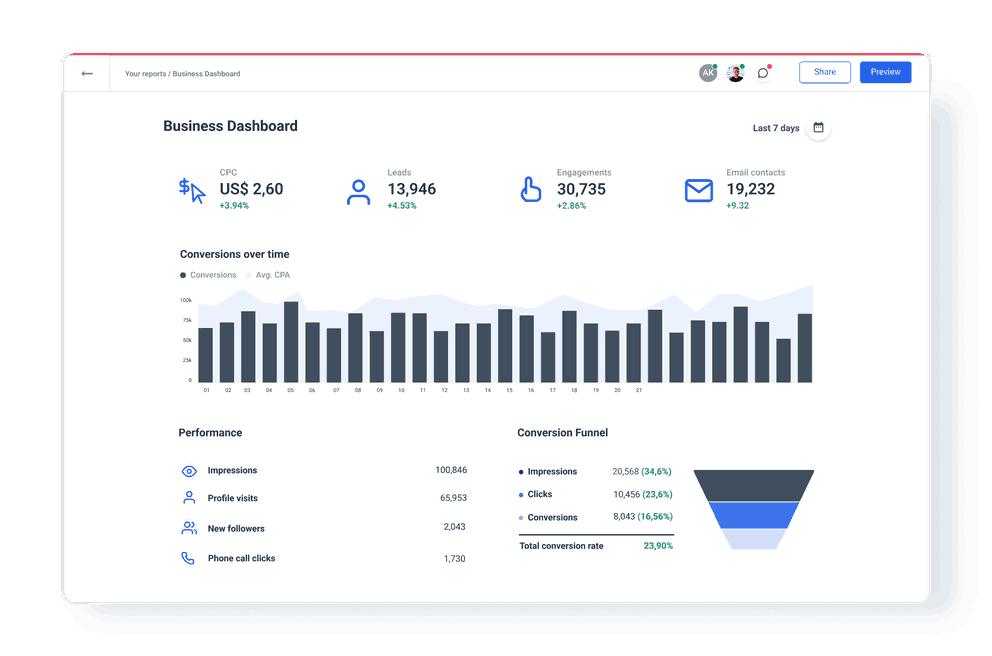
Actionable Business Metrics in One Place
Our modern business dashboard includes all KPIs and metrics in one document so you can immediately act upon them and drive results for your clients. Learn about your marketing campaigns and the results they got just by glancing at the dashboard. Easily analyze your performance and improve your work with Whatagraph’s business dashboard.
All reporting features your agency needs


Frequently Asked Questions
What are the benefits of using a business dashboard?
Whatagraph business dashboards:
- Give you an overview of your client’s business status;
- Show you how you can improve clients’ performance results;
- Help increase profits by showing the areas of your client’s business that need improvement,
What to include in a comprehensive business dashboard?
First, identify who will be looking at the dashboard, you or your client. These business dashboards will differ in length, depth, and the amount of data presented. However, here are some things to consider regardless of the recipient:
- Key business objectives and their results;
- The most important business metrics;
- Trends and patterns of customer behavior;
- Wherever necessary, include notes summarizing or providing context.
How to build a business dashboard for your client’s business
All you need to do is create a Whatagraph account and you’ll be ready to go within minutes. Here are the steps you need to take:
1. Create an account
Create a Whatagraph account in less than a minute by adding your data. No credit card is needed and you can try Whatagraph for free for 7 days!
2. Connect your tools
Connect the tools your client uses to monitor their business. With just a few clicks, you can automatically populate your dashboard templates in Whatagraph.
3. Create a template by adding pre-made widgets or creating it from scratch
Create your first KPI dashboard template by choosing from a list of pre-made widgets. Or you can create your own KPI dashboard template by combining the elements your clients need to see.
It’s good to be loved! Our clients are not shy about expressing it.
I made a switch from GDS and Sheets for reporting to Whatagraph, and I am saving literal hours each week on performance report creation. Our small firm actually managed to onboard 2 new clients as a result of all the time we saved on managing data and reporting. The customer service is also really helpful and easy to reach.

Capterra verified review by
Mindaugas S., Marketing Consultant
Having active customer support to help fix any issues was a big contributor, but we also really liked the ability to save templates and connect sources to multiple charts/widgets at once without having to edit them individually. And having the grid layout is much easier to stay consistent with than the free form setup that Data Studio has.

Capterra verified review by
Nico T., Media Planner
The system has standard templates that are easy and fast to use. Also you can build your own report with lightning speed. It is very easy to use, has a lot of integration, and let get started very fast.

Capterra verified review by
Rasmus Bernt K., External Senior Management Consultant
We love Whatagraph - we would definitely recommend and our account manager is great! I love how easy this tool is to use, everyone on the team finds it much more user-friendly than other dashboards. Integration was easy, we sent some example reports to the team who duplicated these for us. We literally had to log in and send it to our clients!

Capterra verified review by
Stephanie S., Digital Director
We are showing our clients the work that we're doing for them and this is incredibly important for our clients ROI. They want to see results and having a tool like Whatagraph that can show data from virtually every source we use is hugely important.

Capterra verified review by
John S., SEO Strategist
The tool is easy to use; you do not need to have development resources. Even my junior project managers are capable of making campaign reports in minutes. There are a lot of pre-made templates you can use as well as many pre-made widgets.

Capterra verified review by
Erman E., Marketing Specialist
Really easy to connect data sources within the tool. The library of report templates has been helpful. The customer support team has been responsive to all of our needs. Our team enjoys the simplicity of setting up the reports and how the data is presented.

Capterra verified review by
Brent N., Director of Operations
Easy to create really beautiful graphs and reports which can help other team members to understand the most important takeaways. I especially like the automated report function, so I don't have to check on the same thing repeatedly.

Capterra verified review by
Orsolya S., Online Marketing Manager