Challenges
The Need for a Faster and Easier Way to Build and Manage Reports
With dozens of clients ranging from small businesses to large international brands, Ampilio needed a reporting solution that could scale without draining resources.
The agency had been in business for over 10 years and they had used Looker Studio for most of that time—but it became a bottleneck as the agency grew.
The team works heavily with Amazon Ads, but to bring that data into Looker Studio, they needed to use third-party connectors like Supermetrics and Funnel.
These third-party connectors were finicky—connections would break and sources wouldn't load properly, making reports inaccurate. When that happened, the team had to waste time troubleshooting technical issues rather than analyzing results.
Plus, building reports on Looker Studio was a huge time sink.
The user interface was clunky and the team had to manually configure the reports since there weren’t a lot of out-of-the-box templates available. This meant spending hours building widgets, making custom metrics, configuring filters, and adjusting layouts.
For an agency managing dozens of clients, this wasn’t sustainable.
Ampilio needed a reporting tool that was accurate, easily customizable, and holistic—without requiring technical expertise or hours of prep work.
Solution
A Scalable Reporting Platform Built for Speed, Clarity, and Collaboration
This was when the team switched to Whatagraph, and they immediately saw the benefits of an all-in-one marketing intelligence platform.
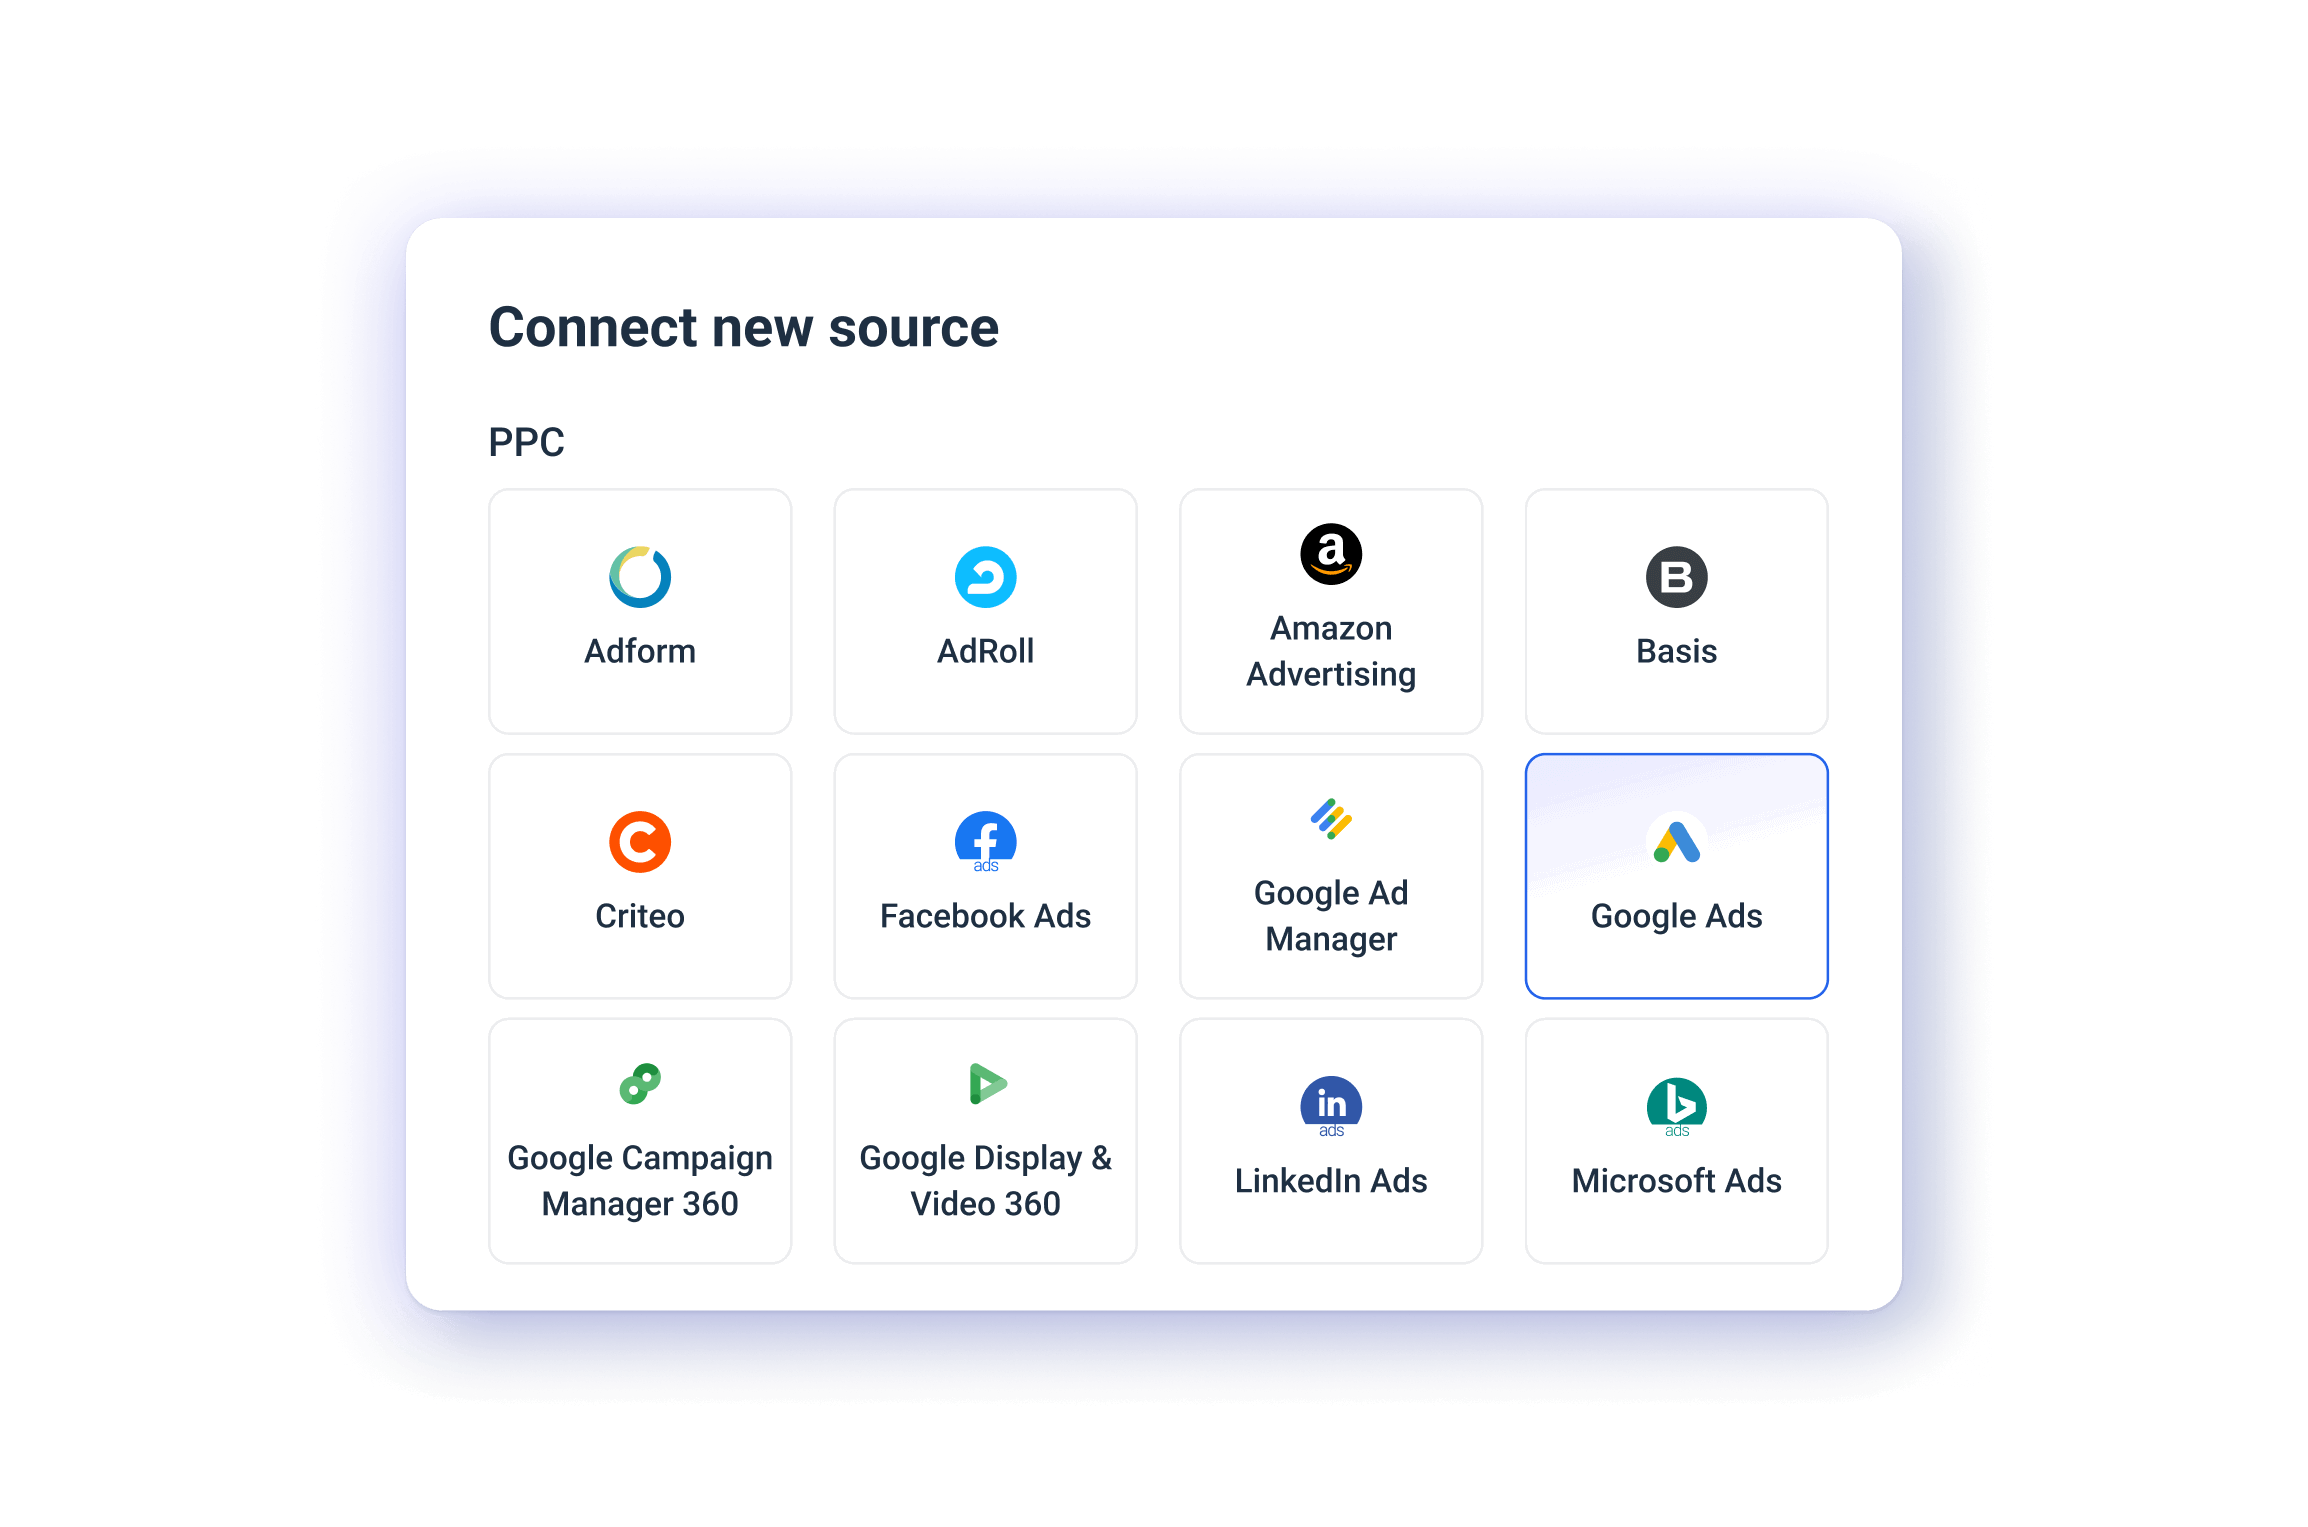
On Whatagraph, they could connect to both Google and non-Google sources through direct, ready-made integrations.
The Ampilio team didn’t need to use an extra connector nor waste time fixing broken connections. All they needed to do was to authenticate the connection and the data started flowing into Whatagraph automatically. This data also refreshes every 30 minutes so the reports are always up-to-date.
 To stay organized, Ampilio assigned different data sources to dedicated folders for each client, making it easy to find and manage them when needed.
And if they needed to add a new source mid-report, they could do it directly from the report editor—no backtracking required.
When it comes to visualizing this data, the Ampilio team built their first report using one of Whatagraph’s ready-made templates.
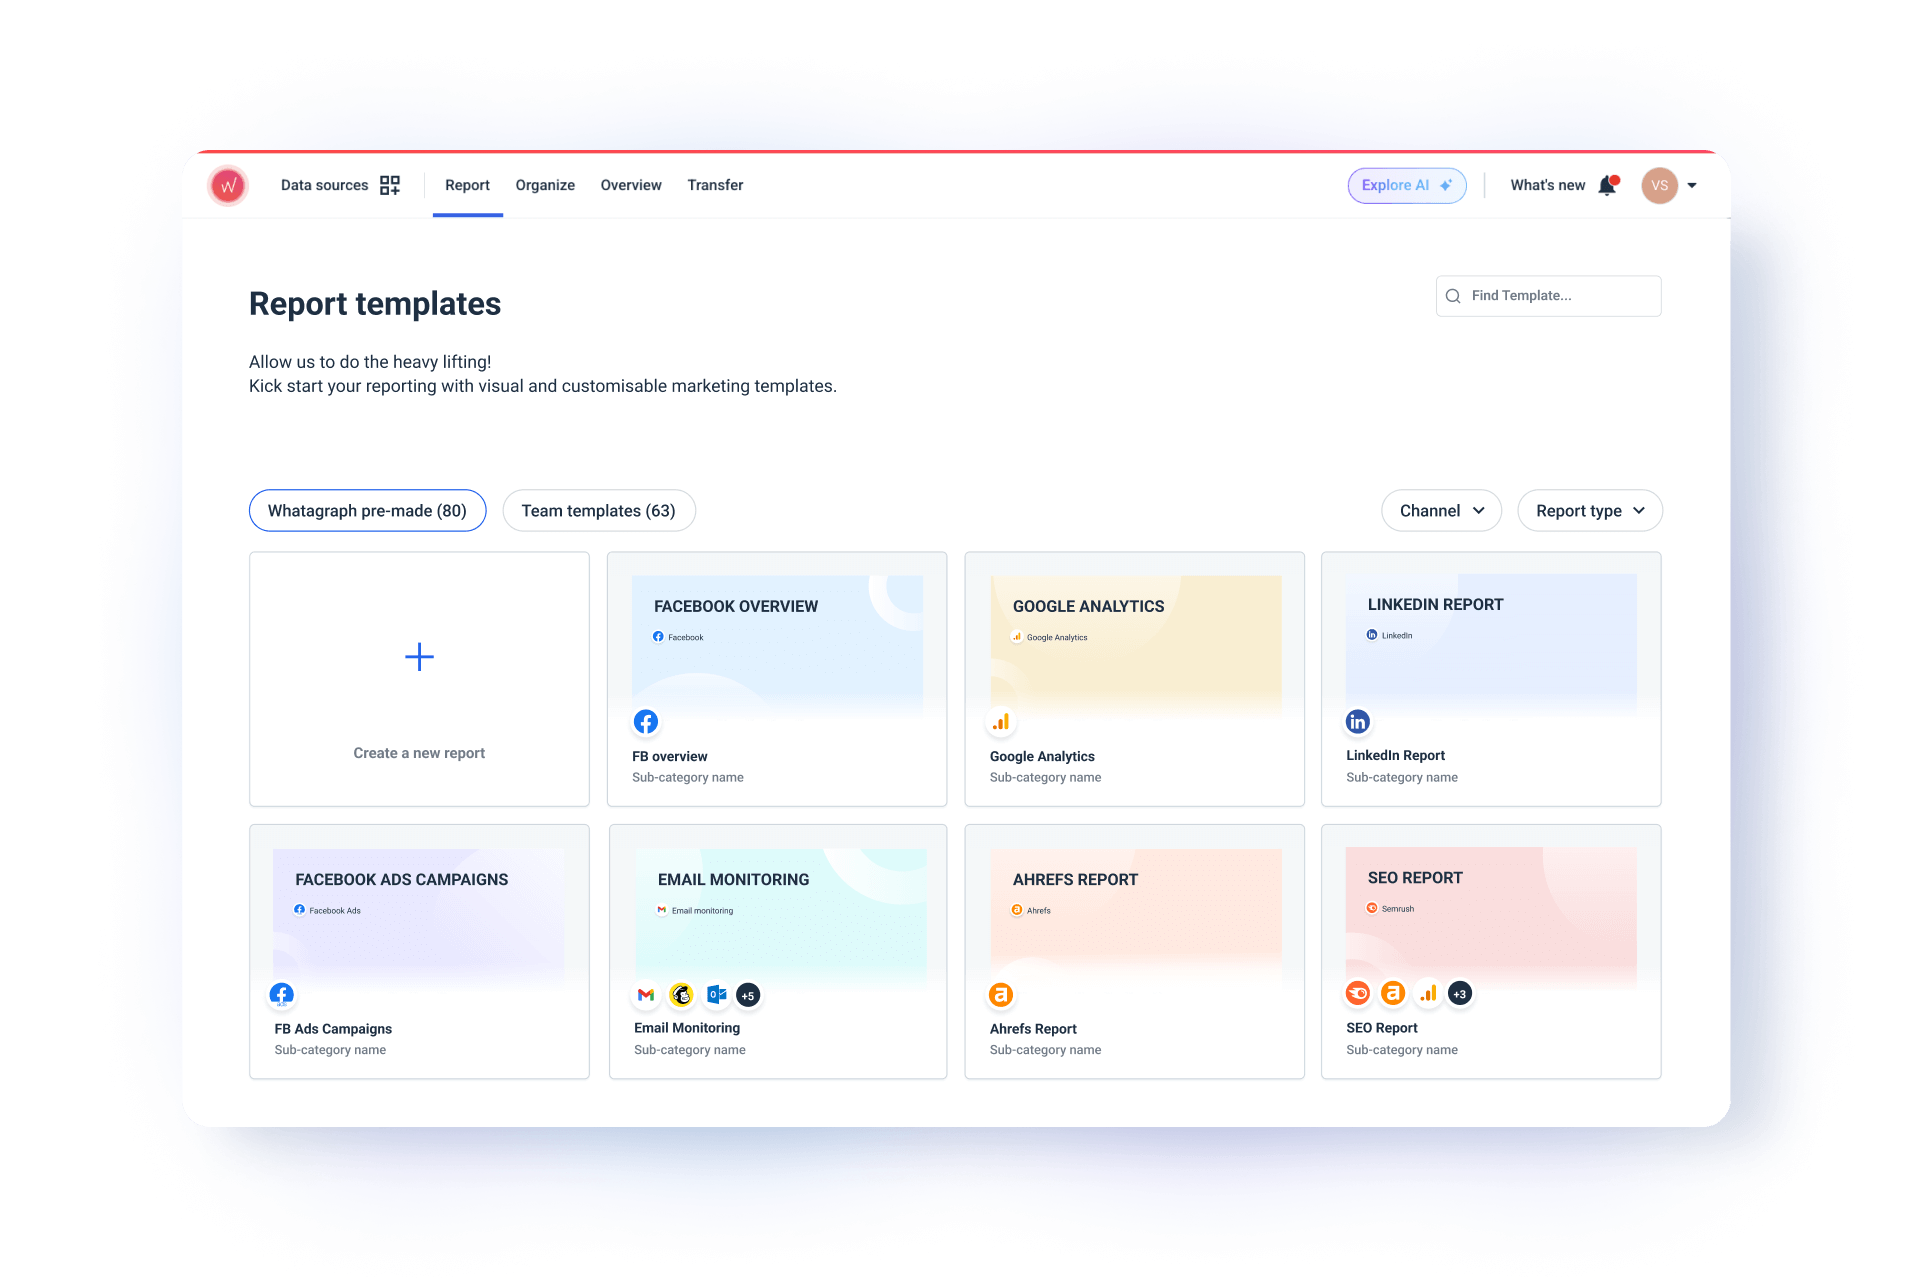
Once they were more comfortable with the platform, they built their own reports in the structure and style they preferred and saved them as “team templates” so they could reuse them the next time.
 Whenever they needed to create a new report for a new client that used the same channels, they simply:
- Duplicated the existing report
- Swapped out the data sources
- Tweaked the metrics, charts, and graphs according to the client’s preference
This only takes about an hour or two, compared to the multiple hours it used to take on Looker Studio.
The team also appreciates the pre-made widgets available on Whatagraph that they can just drag-and-drop onto their reports. This meant they didn’t need to configure and build widgets from scratch, like they used to on Looker Studio.
“We love the drag-and-drop function on Whatagraph and the simple layout of reports. It's easy for anyone to start creating reports and even non-tech savvy people can start using it,” Elvira Danielsson, Digital Marketing Specialist at Ampilio explains.
Whatagraph’s reports are also fully customizable. The Ampilio team can easily:
- Adjust the widgets sizes horizontally and vertically
- Choose icons for widgets from an icon library
- Choose the orientation of their reports—either Landscape or Portrait
- Insert new rows anywhere in their reports
When it comes to white-labeling the reports, the Ampilio team can:
- Upload their logo or their client’s logo
- Create custom color schemes or choose one from pre-made schemes
- Add footer and header texts
- Create custom domains to host and share your reports
Since Ampilio works with international clients, the team often localizes reports in two main languages: English and Swedish. They manually edit widget titles, rename metrics, and write summaries in the client’s preferred language.
Once the localized report is built, it’s saved as a reusable team template—so they never have to start from scratch again.
 Another feature Ampilio loves about Whatagraph is the folder management. They created dedicated folders for each client and saved all the respective reports and data sources to them. This makes it easy to search for reports and edit them.
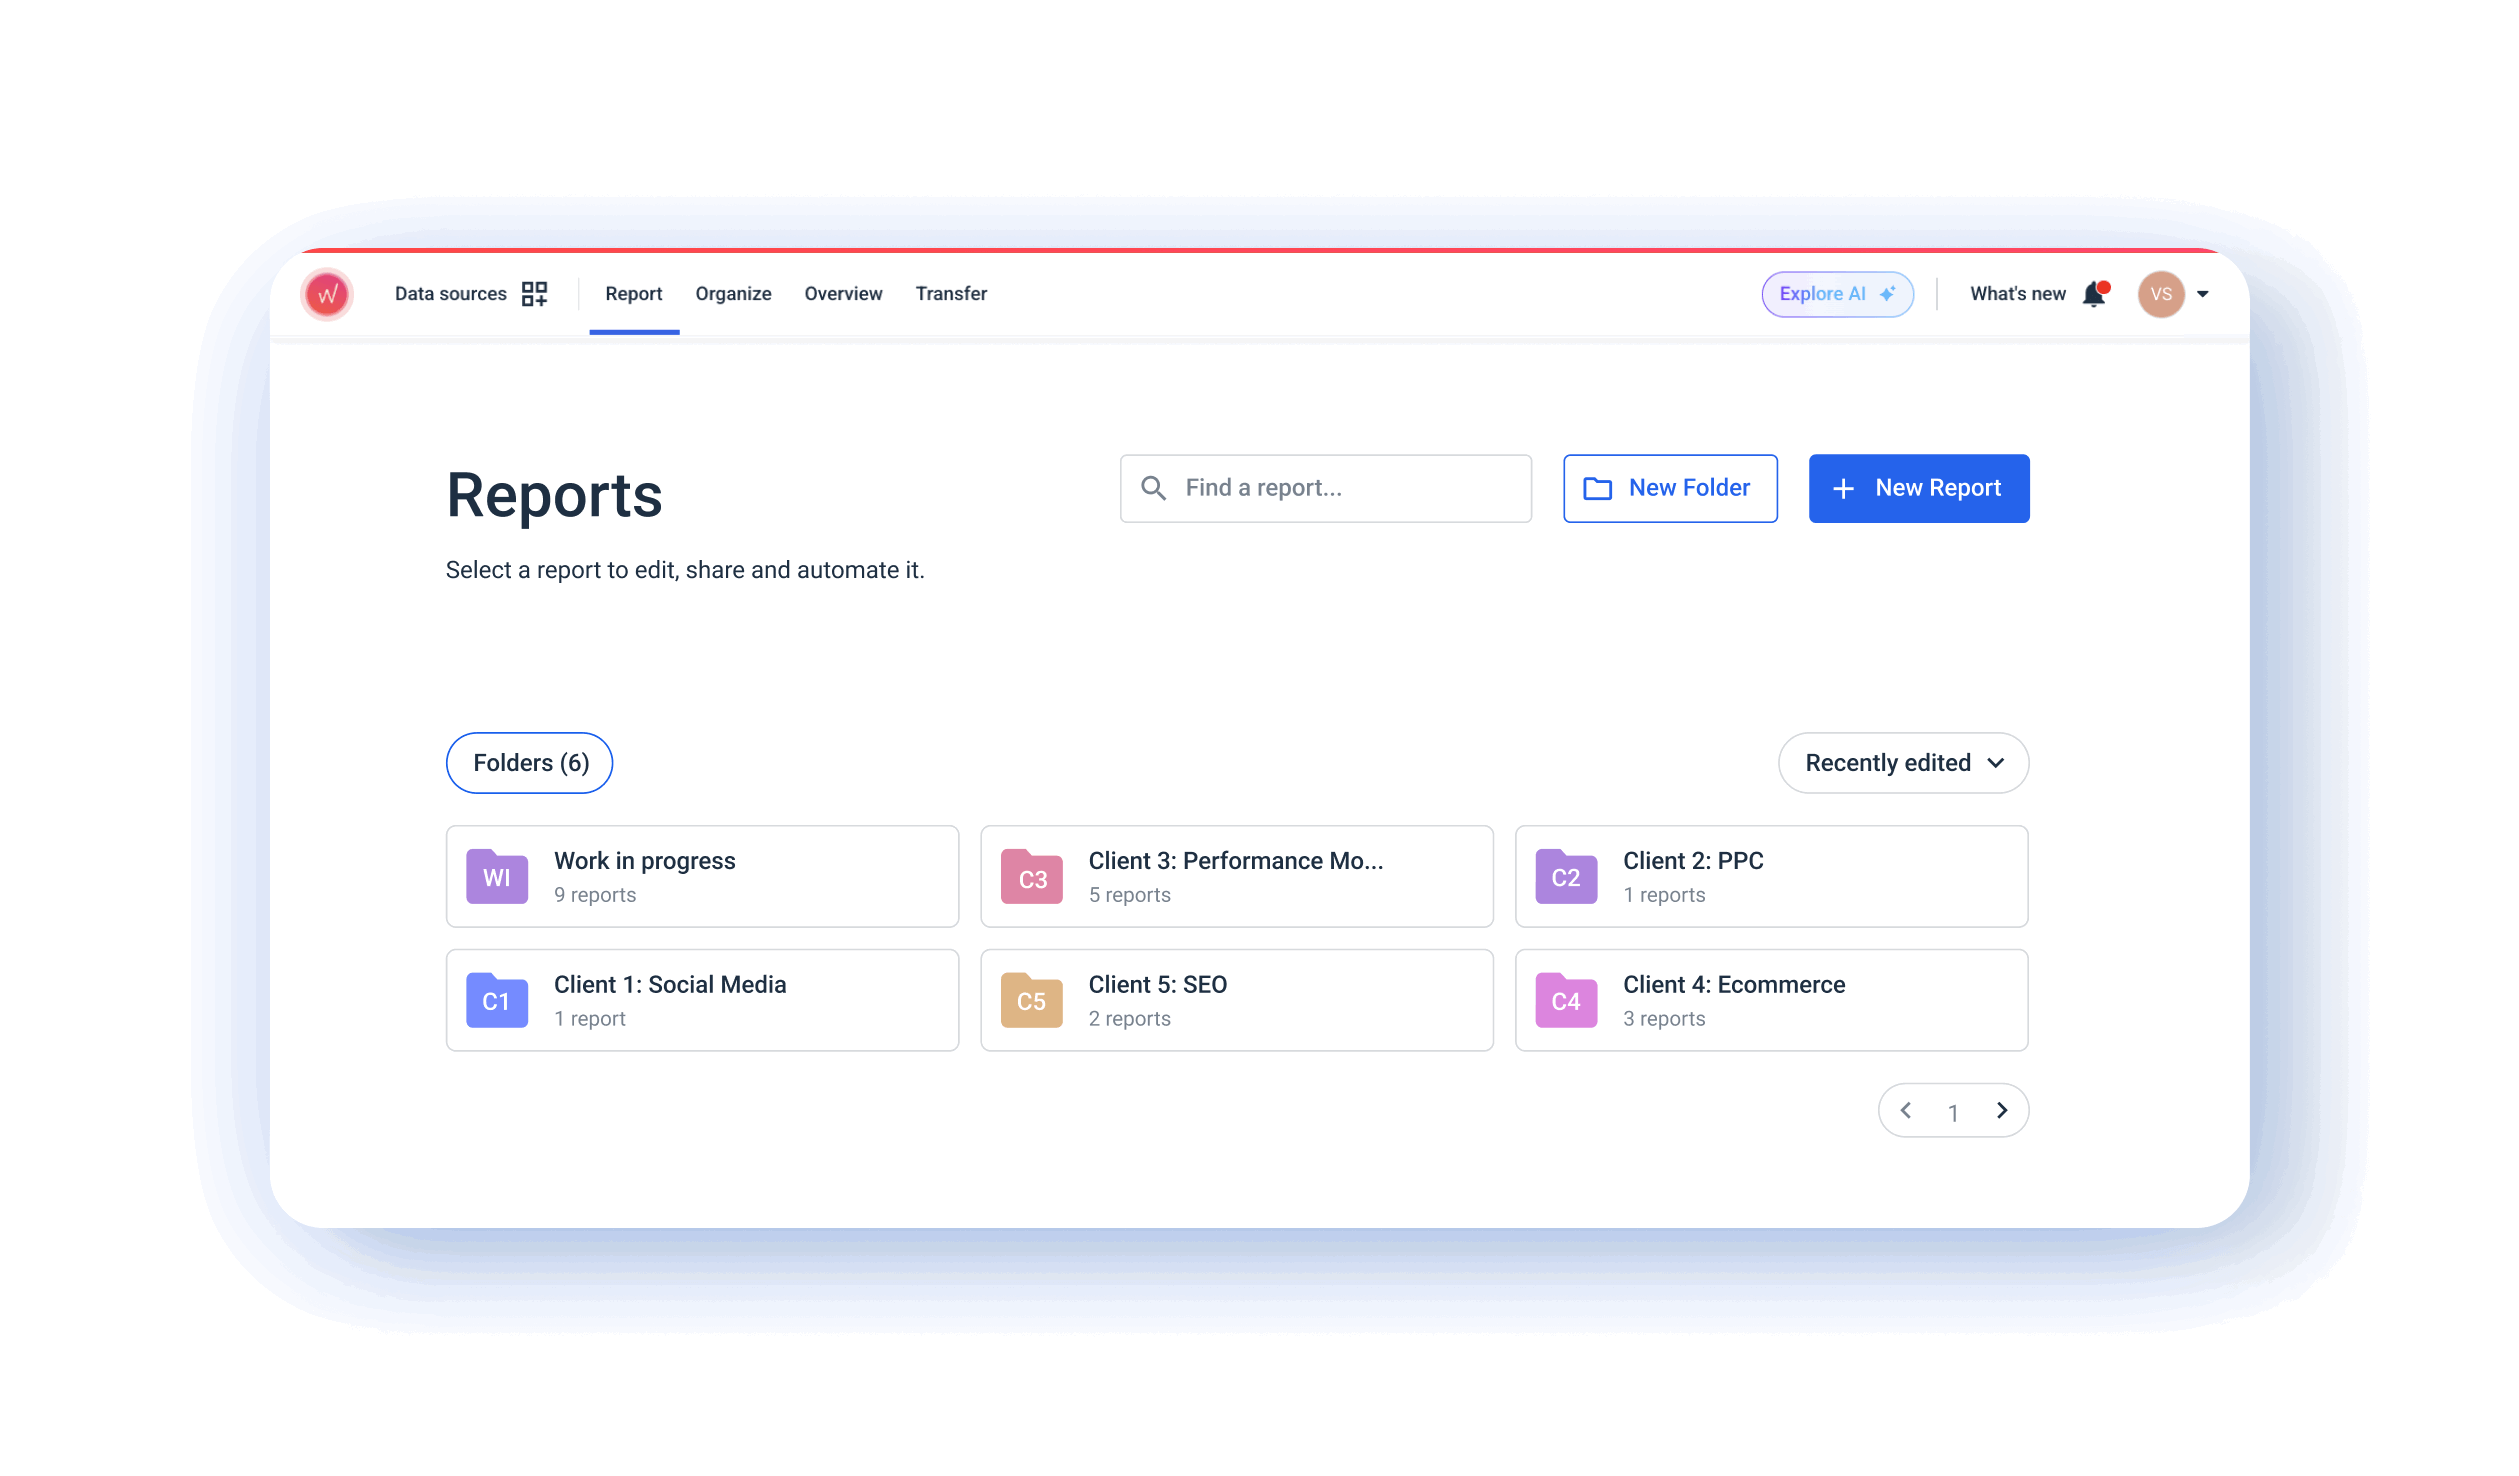
And at any point in time, if the team runs into roadblocks with the platform, they can always reach out to Whatagraph’s support team through the in-app live chat.
“We usually get a reply in 2–3 minutes, and most problems get solved in under 30 minutes. We love that it’s so easy to get help from an actual Whatagraph team member,” Mathilda Johnsson, Head of Growth Management at Ampilio, tells us.
Today, Ampilio has created 50+ folders, each dedicated for a client that requires reporting. Every folder includes the dedicated reports and data sources associated with each client.
The Ampilio team has also automated the way they send reports to clients. With Whatagraph, they either:
- Send an automated email with the report that goes out at a certain day, time, and frequency
- Share live links to the reports with clients
The team then goes through these reports in live performance calls with clients, making it easy for clients to follow along and understand the impact of marketing campaigns.
Results
Accurate Reports, Stronger Transparency with Clients, and Time Saved
The biggest benefit Ampilio saw with Whatagraph is stability and accuracy in reports.
Whatagraph’s native integrations and fully managed connectors mean Ampilio no longer worries about broken data or manual fixes. Reports load quickly and reliably, with fresh data always matching what’s visible on the ad platforms themselves.
This consistency has eliminated one of their biggest pain points with Looker Studio, where issues with third-party connectors often delayed reports and eroded client confidence.
Plus, the Ampilio team can now easily create reports thanks to ready-made templates by Whatagraph or by their own team. Even the most non-tech savvy person can easily create a report in an hour or two.
And instead of static PDFs or delayed updates, clients now receive live links with real-time performance data—allowing them to explore results, filter by date range, and check on campaign progress anytime they want. This is fundamental in building trust with clients, even beyond regular performance calls.
When asked if Ampilio would recommend Whatagraph to other agencies, the answer is immediate:
“Absolutely. I even tell my friends at other agencies who are still using Looker Studio about Whatagraph. We are very happy with it!” Elvira says.