Challenge
Managing Reports for 70+ Clients with a Cumbersome Workflow
Media Maven, a marketing agency from Israel with 30 employees, has been in business for 8 years and manages over 70 clients worldwide.
Keeping clients informed and satisfied was no small task, especially with their previous reporting process.
Before discovering Whatagraph, Media Maven “suffered” with a combination of Looker Studio and Supermetrics.
Instead of a single tool, they had to use two: one for connecting data sources and another for visualization. The connections between the tools frequently broke, forcing the team to troubleshoot instead of focusing on campaigns.
There were three steps involved in their reporting workflow:
- A marketing tool or platform (e.g. Facebook Ads)
- The visualization tool (Looker Studio that they used before)
- The connector that works between the marketing platform and the visualization tool
This setup was far from ideal and required significant manual work to maintain.
Sending reports was equally time-consuming. With a client base of over 70, Media Maven needed to send weekly reports. Account managers often had to drop everything to provide clients with campaign updates, which involved manually checking and preparing data.
Solution
Streamlining Reporting with Automated Dashboards
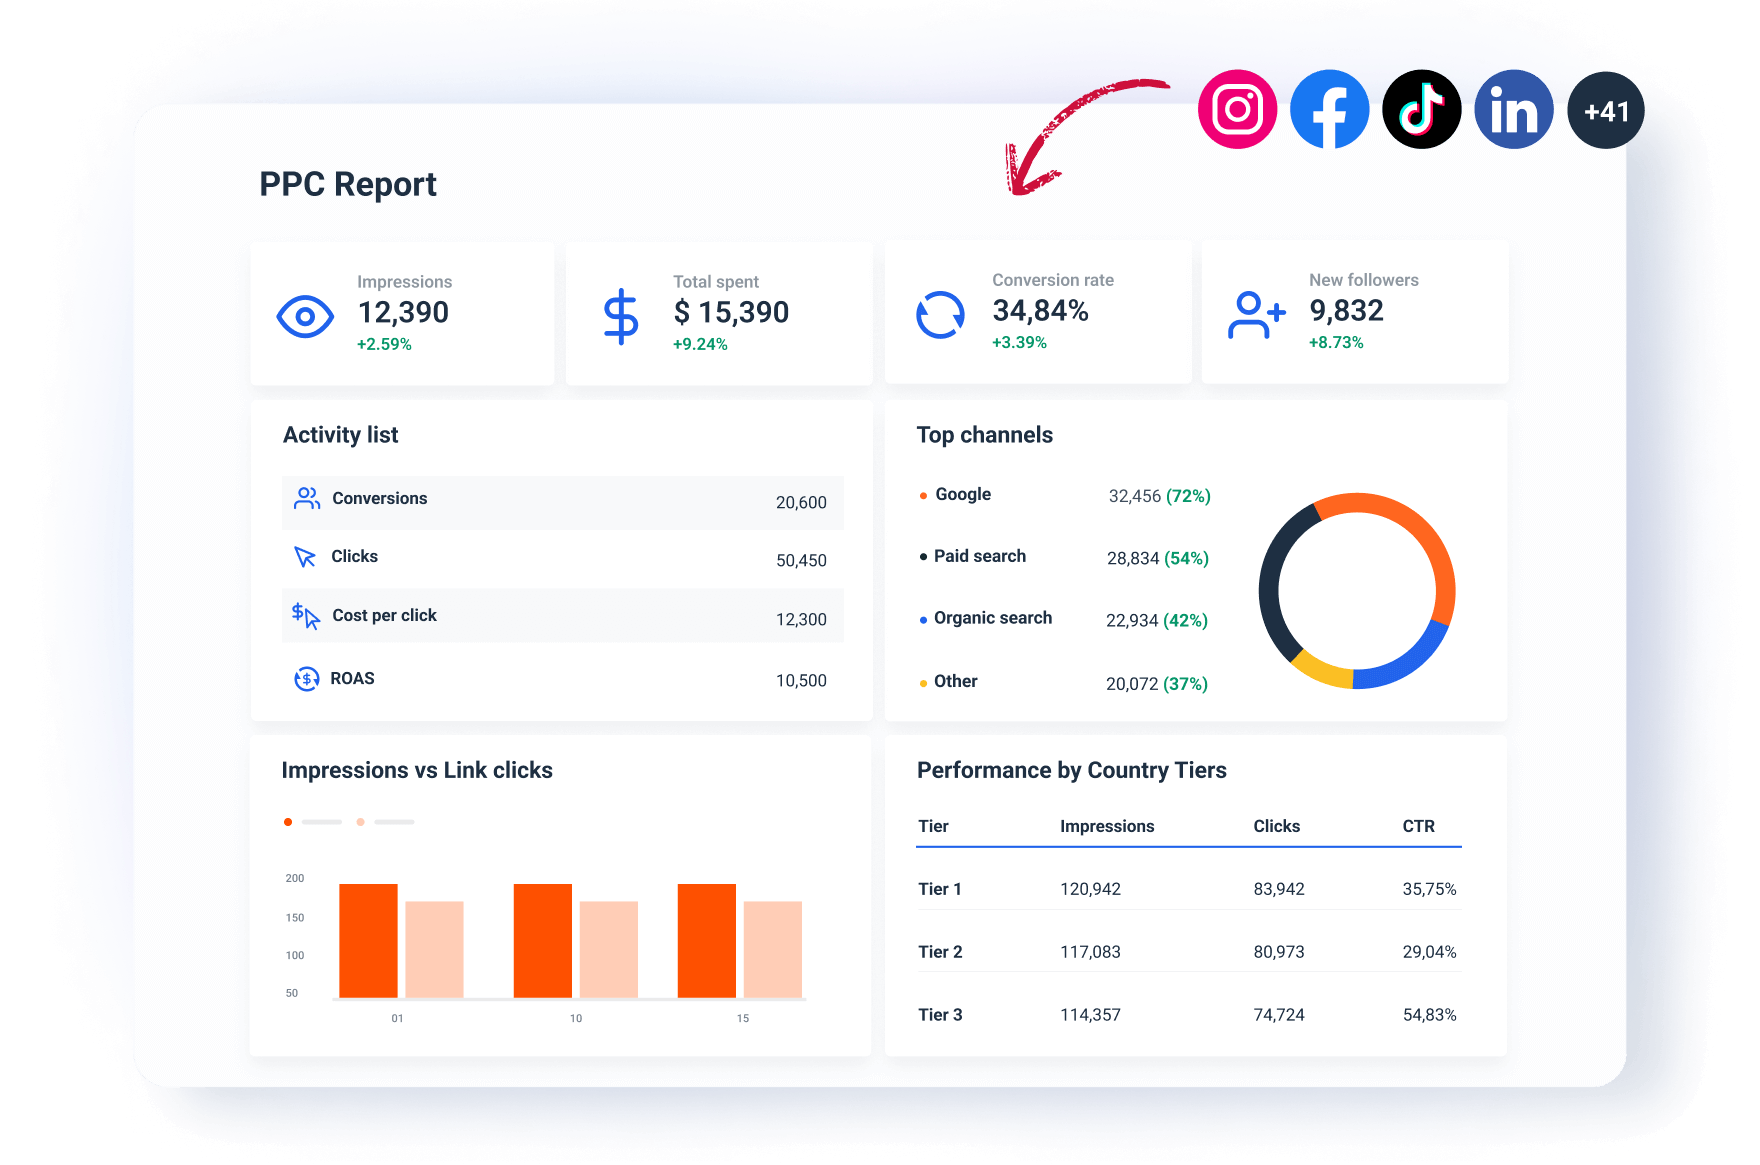
For the past two years, Media Maven has relied on Whatagraph to transform its reporting process. The platform replaced their old workflow with a single, intuitive tool that aggregates and visualizes data in one place.
With Whatagraph, Media Maven introduced automated dashboards, allowing clients to access live campaign results at any time via a link. This eliminated the need for frequent email updates and manual data preparation, significantly reducing the workload for account managers.
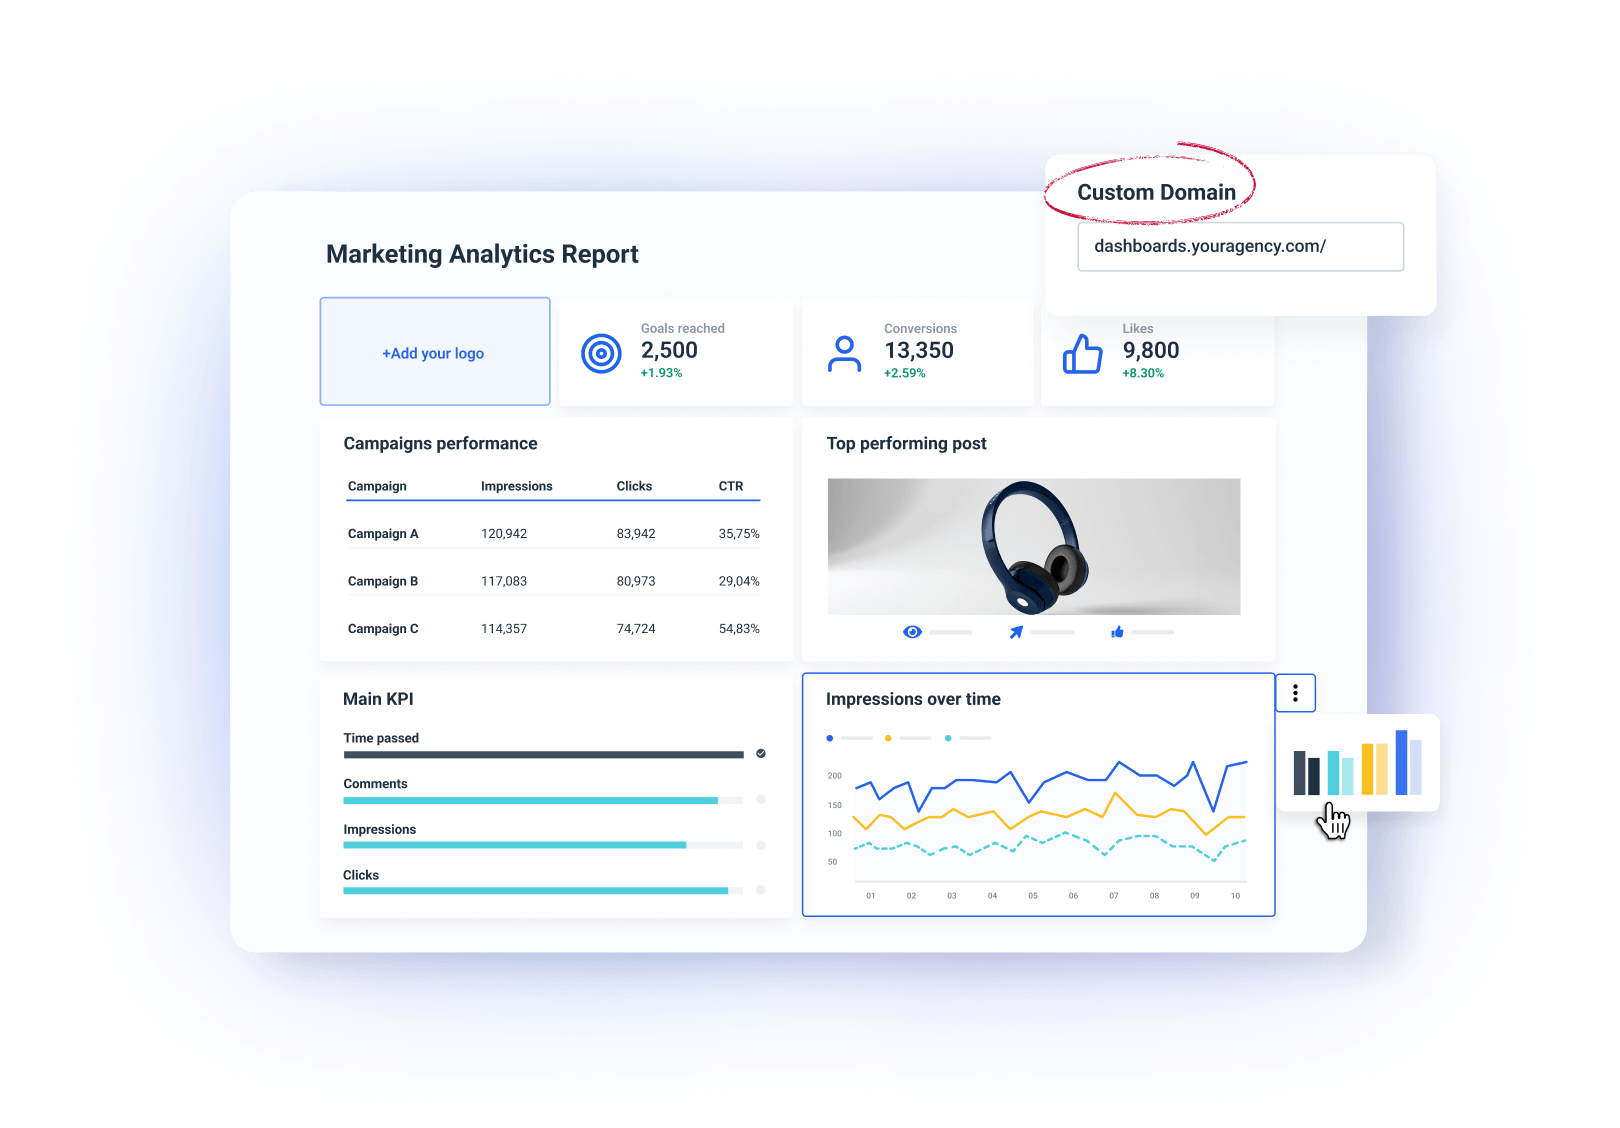
Whatagraph’s direct integrations also resolved the issues caused by broken connections in their previous setup. The platform allowed Media Maven to aggregate and visualize data seamlessly, replacing the need for separate tools like Looker Studio and Supermetrics.
Results
Faster Reporting and Happier Clients
Whatagraph has helped Media Maven streamline its reporting process, saving hours of manual effort.
The automated dashboards ensured that clients could access real-time performance data at their convenience, improving satisfaction and reducing back-and-forth communication.
With their reporting workflow simplified and their client communication improved, Media Maven now has more time to focus on what truly matters—delivering results for their clients.