


What is custom reporting software?
Rather than being locked into the fixed dashboards that platforms like Google Ads and Meta provide, custom reporting software lets agencies collect, organize, and present performance data from multiple channels - all in one place.
According to HubSpot, agencies spend approximately four to five hours per client each month just on reporting. For 20 clients, that's nearly 100 hours a month! That's time that can't be billed. Senior specialists who could be optimizing campaigns or developing strategy are stuck formatting dashboards instead.
We've seen what that looks like in practice.
Peak Seven, a Florida advertising agency managing 25 clients and 100+ ad campaigns, used to spend 4 hours building a single report in Looker Studio. After switching to Whatagraph, that same report takes 1.5 hours or less - saving the team 63 hours every single month.
A good custom reporting tool does most of the work for you:
- Connects directly to your marketing channels - no manual exports, no broken connectors
- Standardizes and organizes data so it's consistent across every client and platform
- Builds reports that are branded, clear, and tailored to what each stakeholder cares about
- Delivers reports automatically on a schedule - no one has to remember to send anything
What is the best custom reporting software for marketing teams?
There are plenty of custom reporting solutions out there, and below, we’ve broken down the top five options available.
Tip: For a more detailed breakdown, read our article on the best client reporting software.
1. Whatagraph - Best custom reporting software for agencies and marketing Teams
Whatagraph is built for marketers, not data teams.
Instead of stitching together Looker Studio, Supermetrics, and a spreadsheet just to produce one client report, you get a single custom reporting dashboard tool that connects your data, organizes it, builds the reports, and delivers them - without any developer involvement.
With Whatagraph IQ, you can ask AI to:
- Build entire reports: Describe what you need, and IQ assembles the full report - charts, KPI widgets, tabs, and layout included
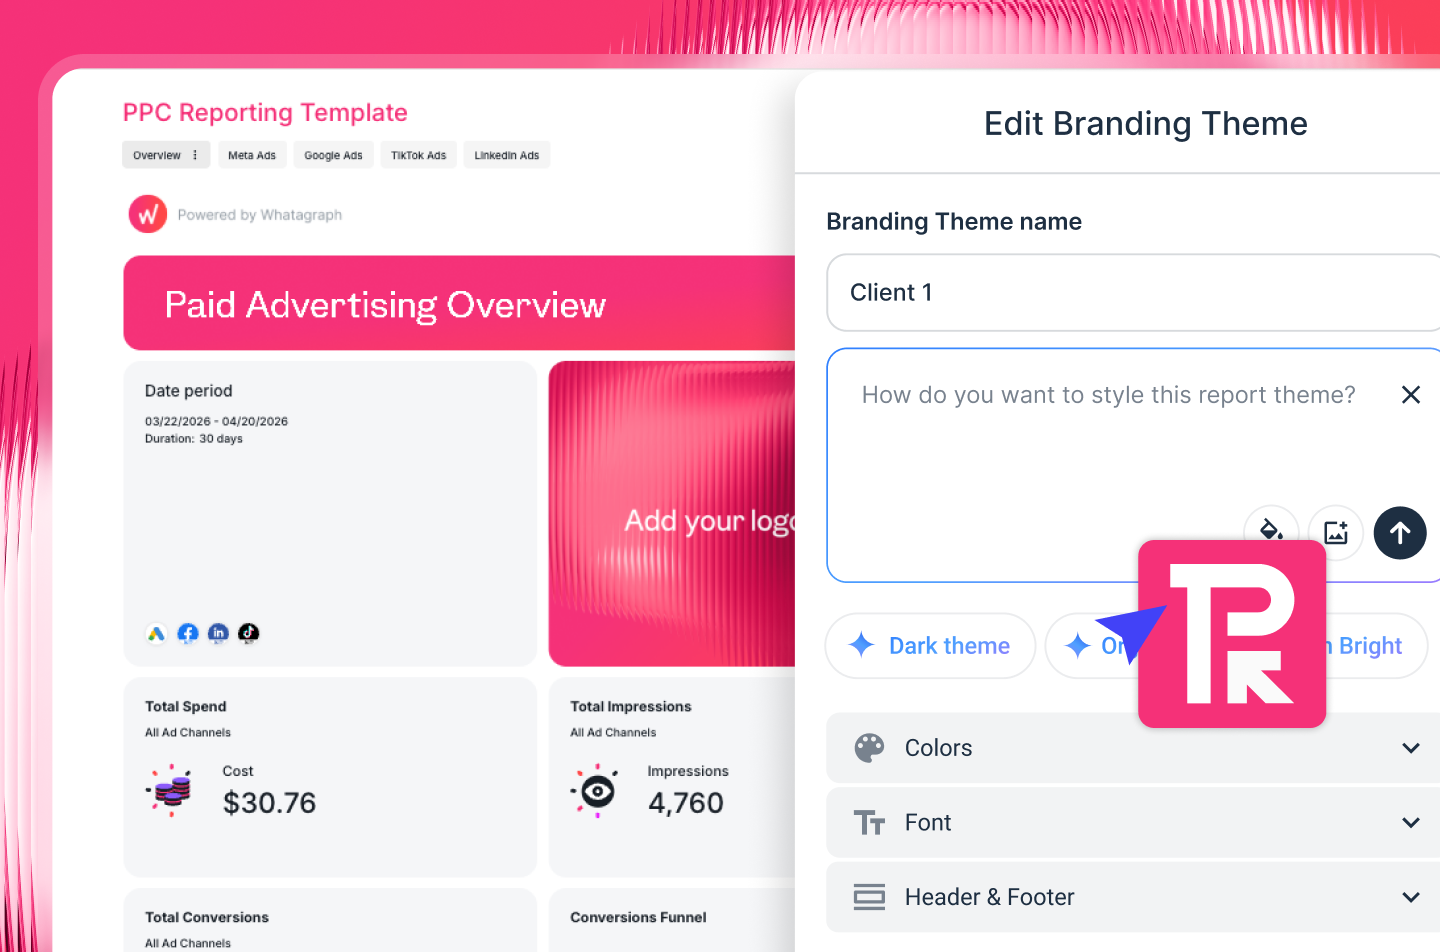
- Brand reports automatically: Upload a client logo or brandbook screenshot, and IQ Themes generates the matching fonts, HEX codes, and icons across the whole report
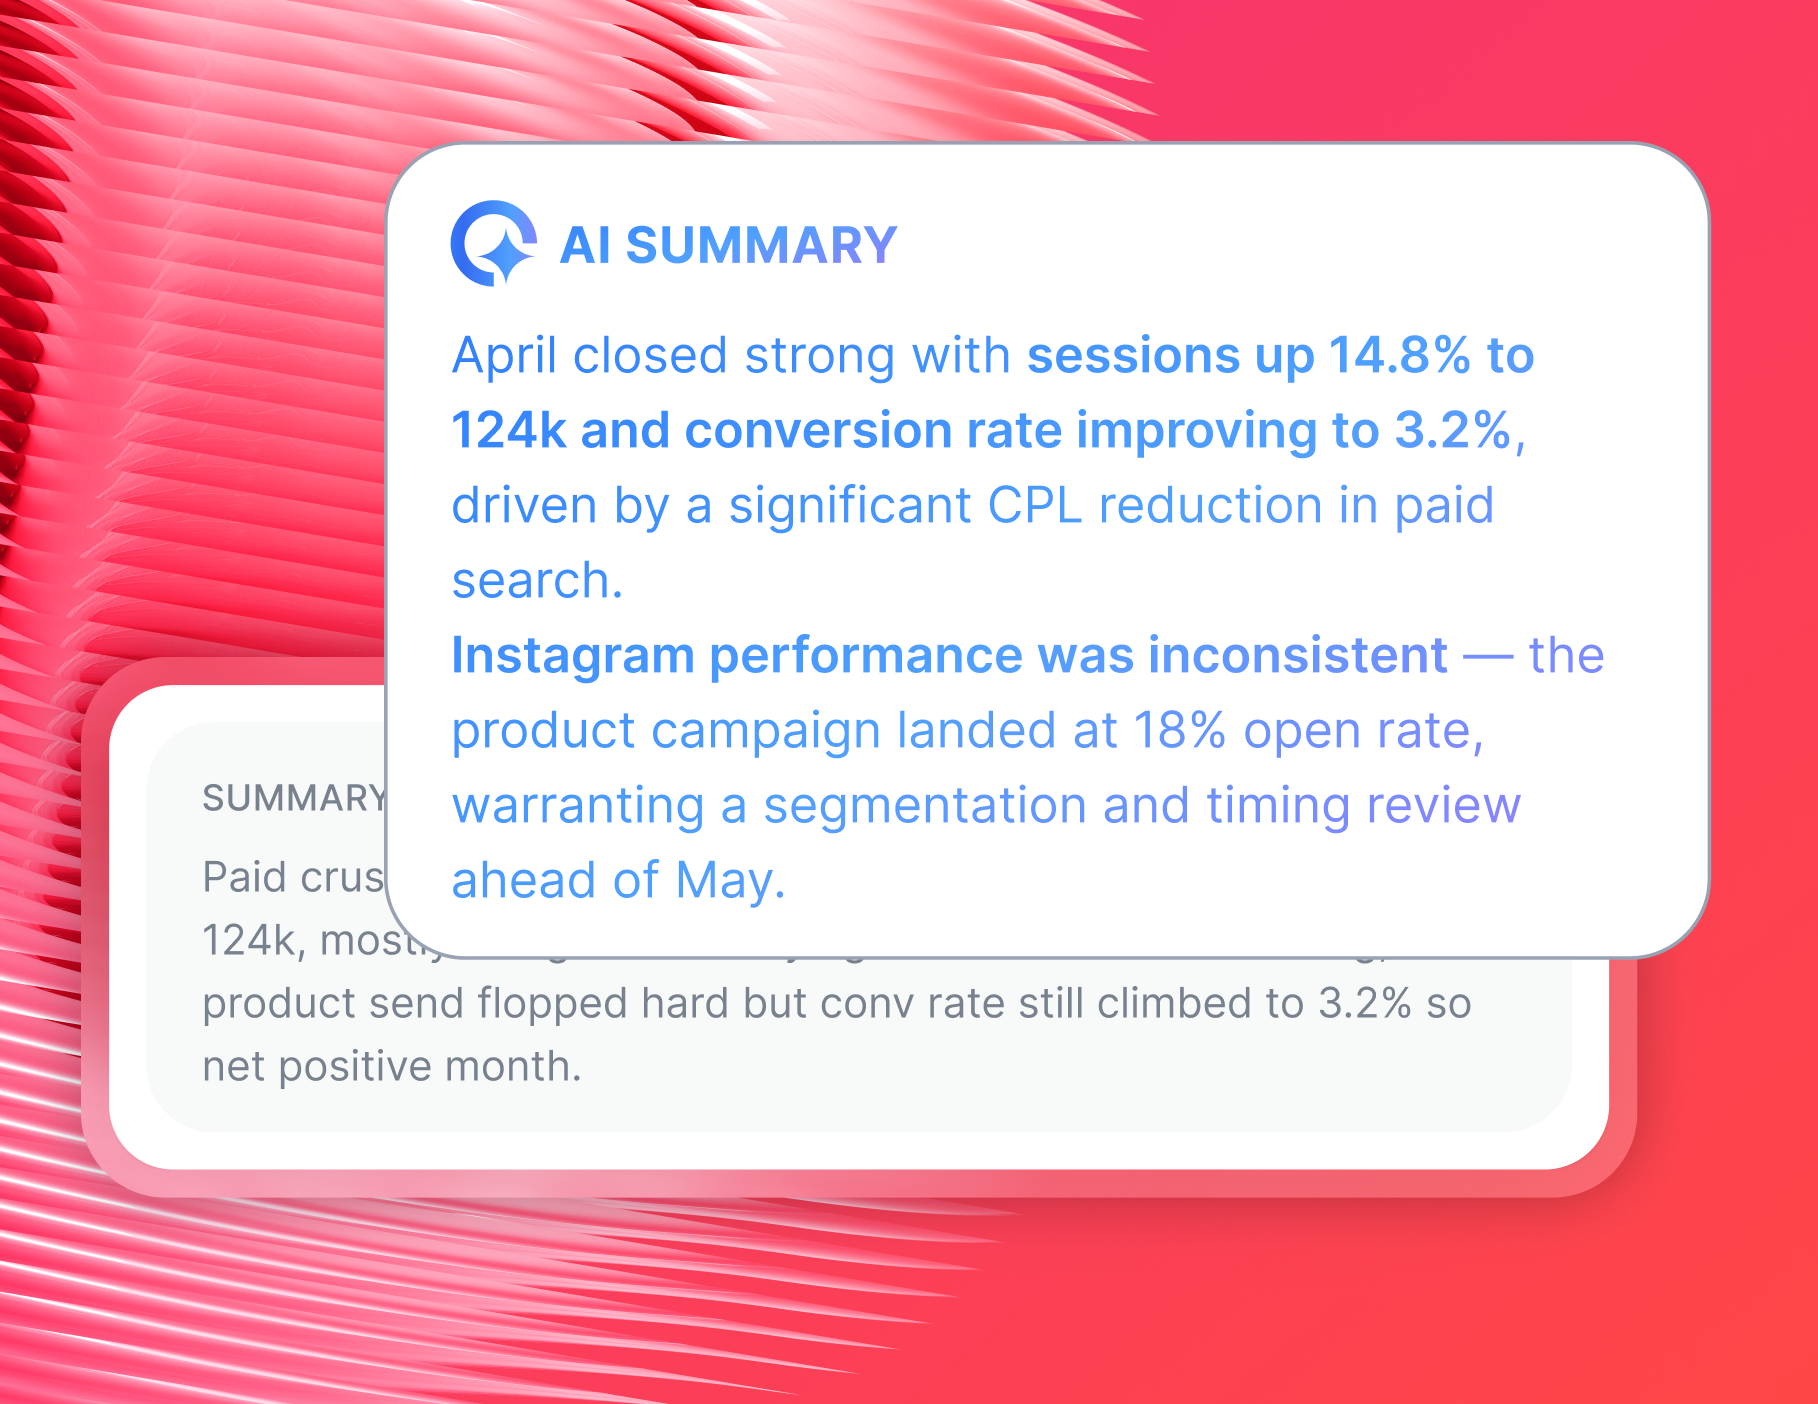
- Write performance summaries: IQ reads the actual data on your report and writes plain-language summaries - no hallucinations, no copy-pasting between tabs. Edit them for that human touch, or send as-is
- Answer questions instantly: Ask IQ Chat, "Which campaign had the lowest CPA last month?" and get an accurate answer in seconds
Whatagraph has also launched an MCP that lets you connect your data to Claude or ChatGPT and analyze your data there.
And it's not just your internal team that benefits - clients can use IQ Chat directly on their reports too.
Whatagraph’s AI cuts down the time our customers have to analyze reports. Say I send a report to a customer, but they don’t really understand it, they can just ask a question, and Whatagraph spits out answers to them right away. - Danielle Roberts, Director of Implementation and Support at Rentable
Whatagraph IQ is what makes building the reports fast, but the data layer underneath it is what makes everything else work.
Here's what else you can do on Whatagraph:
- Connect 60+ marketing channels natively - Google Ads, Meta, TikTok, LinkedIn, Shopify, GA4, Ahrefs, and more. No third-party connectors needed. Data refreshes automatically and always matches the source platform
- Blend data from multiple platforms into one unified view, standardize metric and campaign names across all accounts, and calculate custom metrics - all inside the report environment
- White-label everything: global (all reports), report level, and individual widgets. Custom logos, color schemes, header and footer texts, sender name, and even your own email domain
- Share on any schedule - automated email, Slack, live links, PDFs, CSVs, BigQuery, or Looker Studio
The result is a reporting setup that's accurate, fast, and scalable - whether you're managing 5 clients or 50.
Lars Maat, Co-Founder of Maatwerk Online, experienced this firsthand:
Whatagraph's AI saves time and energy for our marketing specialists. The hours we're saving are just pure profit. We now have the time to focus on more strategic things that help both our agency and our clients grow.
Get started for free with Whatagraph, or explore our paid pricing plans here.
2. Looker Studio - Best for Google-First teams
Looker Studio (formerly Google Data Studio) is a free dashboarding tool that connects natively to Google's ecosystem. If your reporting stack is mostly Google Analytics, Google Ads, and Search Console, and you’re a small business, it gets the job done.
With Looker Studio, you can:
- Build custom dashboards using drag-and-drop visualization components
- Connect natively to GA4, Google Ads, Search Console, and other Google products
- Share live dashboard links with clients or stakeholders
Looker Studio is free for Google sources, but connecting non-Google platforms like Meta, LinkedIn, or TikTok requires paid third-party connectors.
You can learn more about Looker Studio connectors here (and what potential issues they may have).
3. Microsoft Power BI - Best for large teams with a dedicated data team
Power BI is Microsoft's business intelligence platform. It's powerful for organizations that already live in the Microsoft ecosystem and have data analysts on staff to manage it.
With Power BI, you can:
- Connect to a wide range of datasets, data warehouses, and marketing platforms
- Build highly customized dashboards with advanced data visualization options
- Set up scheduled data refreshes for live reports
Power BI has near-endless customization options, but it comes with a steep learning curve - making changes without data expertise is difficult, and it's not built for fast, client-facing agency reporting.
4. Klipfolio - Best for data teams that need a metric catalog
Klipfolio offers two distinct products: PowerMetrics for building a centralized metric library, and Klips for creating custom dashboards and visualizations. It suits larger teams with dedicated data resources.
With Klipfolio, you can:
- Connect to 130+ data sources, including data warehouses and marketing platforms
- Build a curated metric catalog that non-technical team members can pull from
- Create custom dashboards with data blending and scheduled report delivery
Klipfolio is powerful software to create reports, but the learning curve is steep, and Klips are configured in a separate environment from the dashboard itself, which can cause confusion.
5. AgencyAnalytics - Best for SEO-focused agencies
AgencyAnalytics is a client reporting platform designed specifically for digital marketing agencies, with a strong focus on SEO reporting and auditing tools.
With AgencyAnalytics, you can:
- Connect to 80+ data sources and build automated client reports
- Run automated SEO site audits with alerting
- White-label reports and dashboards for clients
AgencyAnalytics works well for SEO and content-focused agencies, but it doesn't support cross-channel data blending - which limits its usefulness for full-service agencies.
3 success stories of Whatagraph's custom reporting solution
If you're looking for proof that custom marketing reporting tools can save time (and money) and help retain clients - here are three agencies that did it with Whatagraph.
1. Peak Seven: 63 hours saved per month, clients retained
Challenges
Peak Seven was building reports manually in Looker Studio - with Funnel and Supermetrics pushing non-Google data in. The setup was unreliable from day one.
Data pulled through incorrectly. Connections broke week after week. Kim Strickland, their Digital Marketing Specialist, spent more time triple-checking numbers than actually analyzing them.
The first report Kim ever built in Looker Studio took 40 hours. Clients were questioning the data. Some were close to leaving.
Solution
After testing TapClicks and Domo, Kim chose Whatagraph. She built a master template for franchise clients reporting on the same channels, then swapped data sources for each new client instead of starting from scratch. Custom formulas combined data from different platforms into one accurate, cross-channel view.
Migration from Looker Studio took a couple of hours.
Results
- 63 hours saved per month on reporting
- Report time cut from 4 hours to 1.5 hours per report
- $9,450 saved per month in reporting costs for clients
- At-risk clients retained
Whatagraph took us to the next level with our clients and within our team. With Looker Studio, everything was muddled. But Whatagraph has opened up transparency and communication. - Kim Strickland, Digital Marketing Specialist at Peak Seven
2. Ampilio: 100+ clients, reports done in one hour
Challenges
Ampilio used Looker Studio for over a decade, but as their client list grew to include large international brands, the cracks started showing.
Their team runs heavily on Amazon Ads - but getting that data into Looker Studio required third-party connectors that broke constantly. Reports were inaccurate. Building new ones from scratch meant hours of manual widget configuration, custom metric setup, and layout adjustments.
For an agency managing dozens of clients across multiple countries, that wasn't sustainable.
Solution
Ampilio switched to Whatagraph and connected all sources natively - including Amazon Ads - without a single third-party connector. They built their first reports using Whatagraph's ready-made templates, then saved customized versions as reusable team templates.
For each new client on the same channels: duplicate the template, swap the data source, tweak as needed. Done in an hour. They also localized reports in English and Swedish using custom widget titles and saved those as separate templates too.
Results
- 100+ active clients managed on the platform
- Report creation time cut to 1 hour
- Zero broken connector issues since switching
- Live links replace static PDFs, giving clients real-time access anytime
Whatagraph's reports are easy to build, visually attractive, and easy for clients to understand. It only takes us an hour to create one report. Even non-tech-savvy people can start using Whatagraph right away - it's that easy." - Elvira Danielsson, Digital Marketing Specialist at Ampilio
3. Maatwerk Online: 100 hours saved per month
Challenges
Maatwerk Online was reporting on 100+ clients using a stack of Supermetrics and Looker Studio. Dashboards loaded slowly, connectors broke without warning, and reports were bloated with metrics clients never looked at.
"Looker Studio was really slow. We used Supermetrics to connect our channels, but sometimes they would just break. Tables didn't load when you tried to refresh the dashboard. It was really annoying," said Lars Maat, Co-Founder at Maatwerk Online.
Solution
The team switched to Whatagraph and built four pillar templates covering eCommerce, Leadgen, Branding, and B2B clients. For 90% of clients, these templates work straight out of the box. Each client gets a fully branded live dashboard with a goal bar showing targets and current performance at a glance.
When Whatagraph IQ launched, Lars was among the first to test it. Specialists now describe the widget they need in plain language, and IQ builds it - no manual configuration required.
Results
- 100 hours saved per month on reporting
- €4,000 saved per year by eliminating Supermetrics
- 100% of Whatagraph's cost recovered through client licensing fees
Whatagraph's AI saves time and energy for marketing specialists. If they need to build reports themselves, it costs them negative energy. But if they can automate or speed it up with AI, it really gives them an energy boost - like 'Hey, this is working really nicely. This is easy. This is going fast.'" - Lars Maat, Co-Founder at Maatwerk Online
How do I create custom marketing reports automatically?
Creating custom marketing reports doesn't have to mean jumping between platforms or spending half your Monday reformatting last week's data.
With Whatagraph's custom report generator, you can go from data connection to client-ready report in under 30 minutes. Here's how.
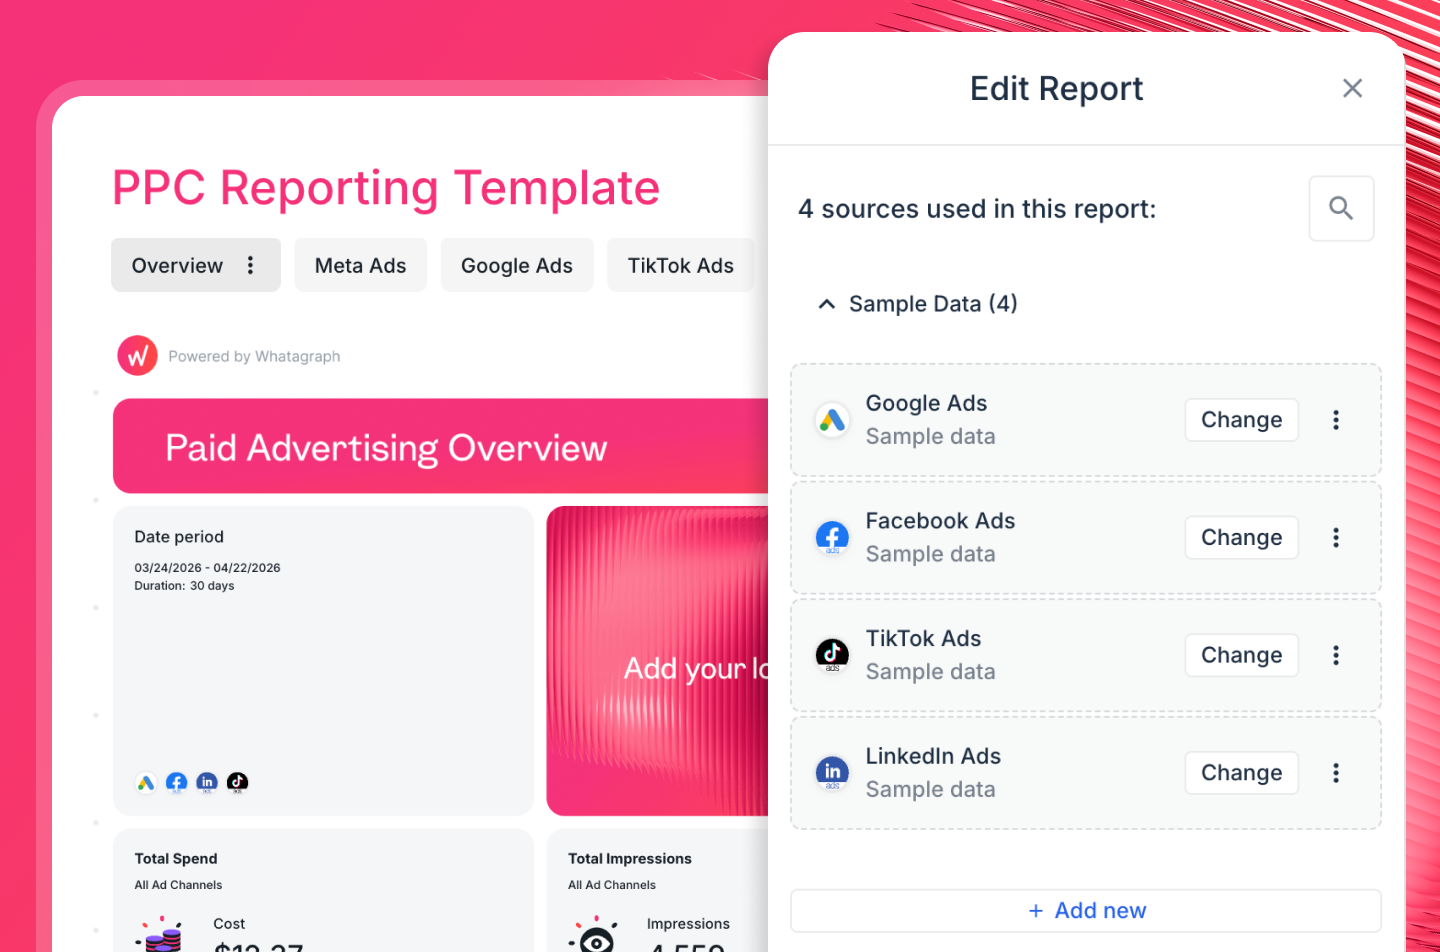
1. Connect your data sources
From your Whatagraph workspace, pick a channel from the integrations menu, authenticate with your account, and you're done.
No APIs, no third-party connectors, no developer needed. Setup takes a few minutes per source.
You can connect data from across your entire marketing stack, including:
- PPC: Google Ads, Meta Ads, LinkedIn Ads, Microsoft Ads, Pinterest Ads
- Social: Instagram, TikTok, YouTube, Facebook
- E-commerce: Shopify, BigCommerce, Magento, WooCommerce
- SEO & Analytics: GA4, Semrush, Ahrefs, SE Ranking, Matomo
- Email: Mailchimp, ActiveCampaign, Constant Contact
- CRM: Salesforce, HubSpot, GoHighLevel
Whatagraph supports 60+ integrations in total. All are native and fully managed - uptime has averaged 99.95% over the past 6 months. If something goes wrong, engineers are notified immediately.
Whatagraph’s reliable, native integrations are built to replace the broken connector experience most agencies know too well.
Funnel and Looker Studio were quite complex, and all the dashboarding work came to me. And whenever we wanted to see data in one of the dashboards, I had to wait for at least 15 minutes because of rate limits. - Linda van Baal, Online Marketing Consultant at YourFellow
With Whatagraph, you connect once, and the data flows continuously.
2. Blend and organize your data
Raw data from five platforms doesn't tell a story on its own. Before building reports, clean it up.
With Whatagraph, you can:
- Blend cross-channel data (e.g., total paid media spend across Google + Meta + TikTok in one view)
- Standardize metric and campaign names across all accounts
- Filter by platform, device, location, or custom segments
- Apply tags and folders to organize by client, account manager, or region
- Create custom analytics & metrics without writing any code
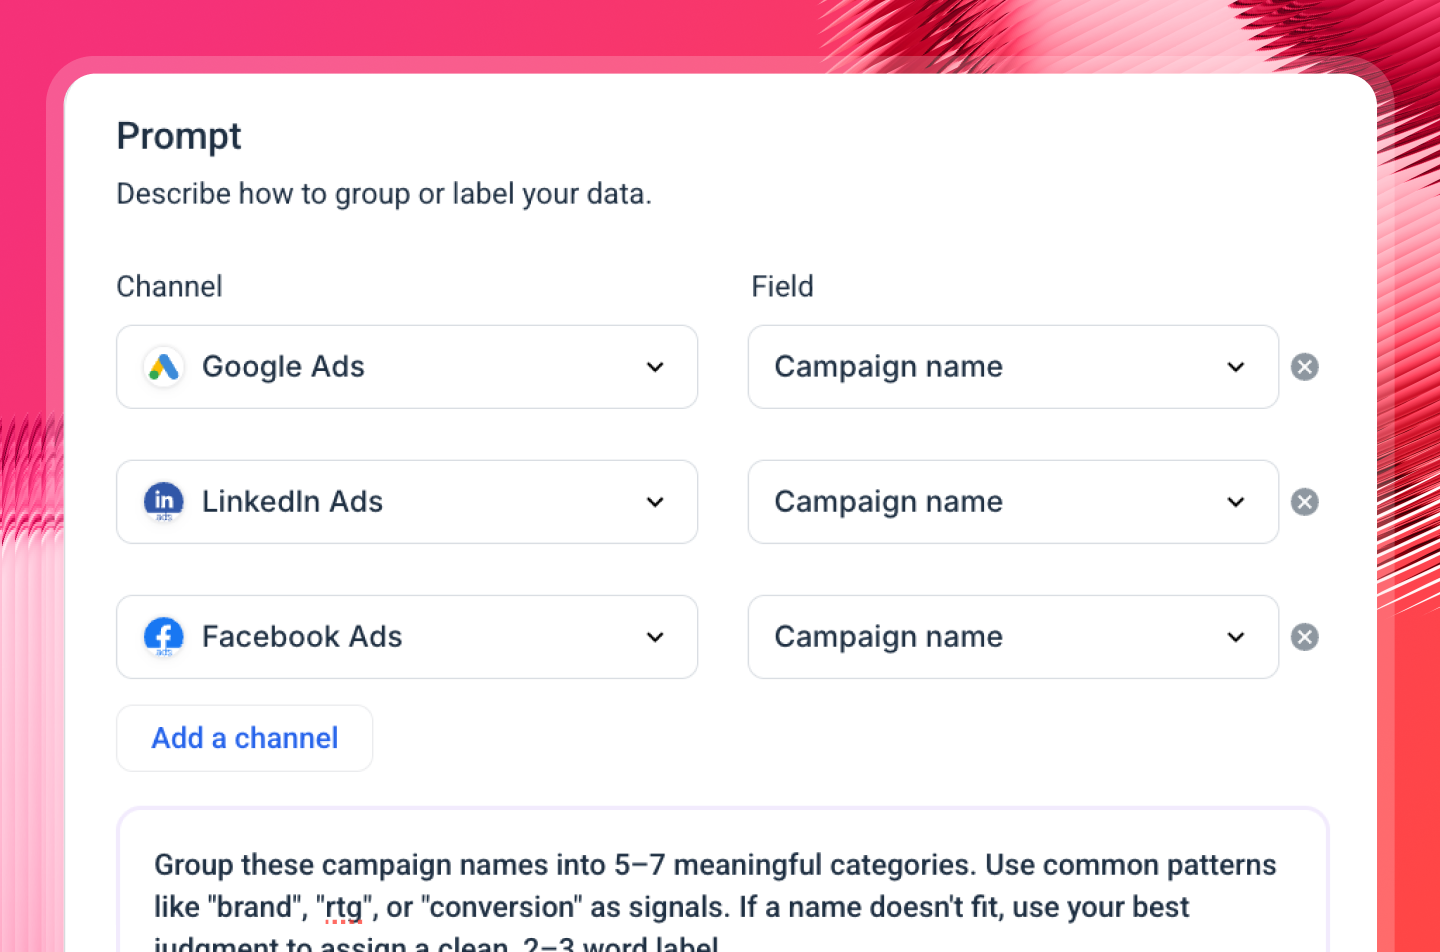
With Whatagraph IQ Dimensions, you don't even need to touch a formula. Just ask AI to:
- Combine data from any channel (e.g., spend from Meta, TikTok, and Google Ads) into one unified metric
- Build custom KPIs like blended ROAS or cross-channel CPA on the fly
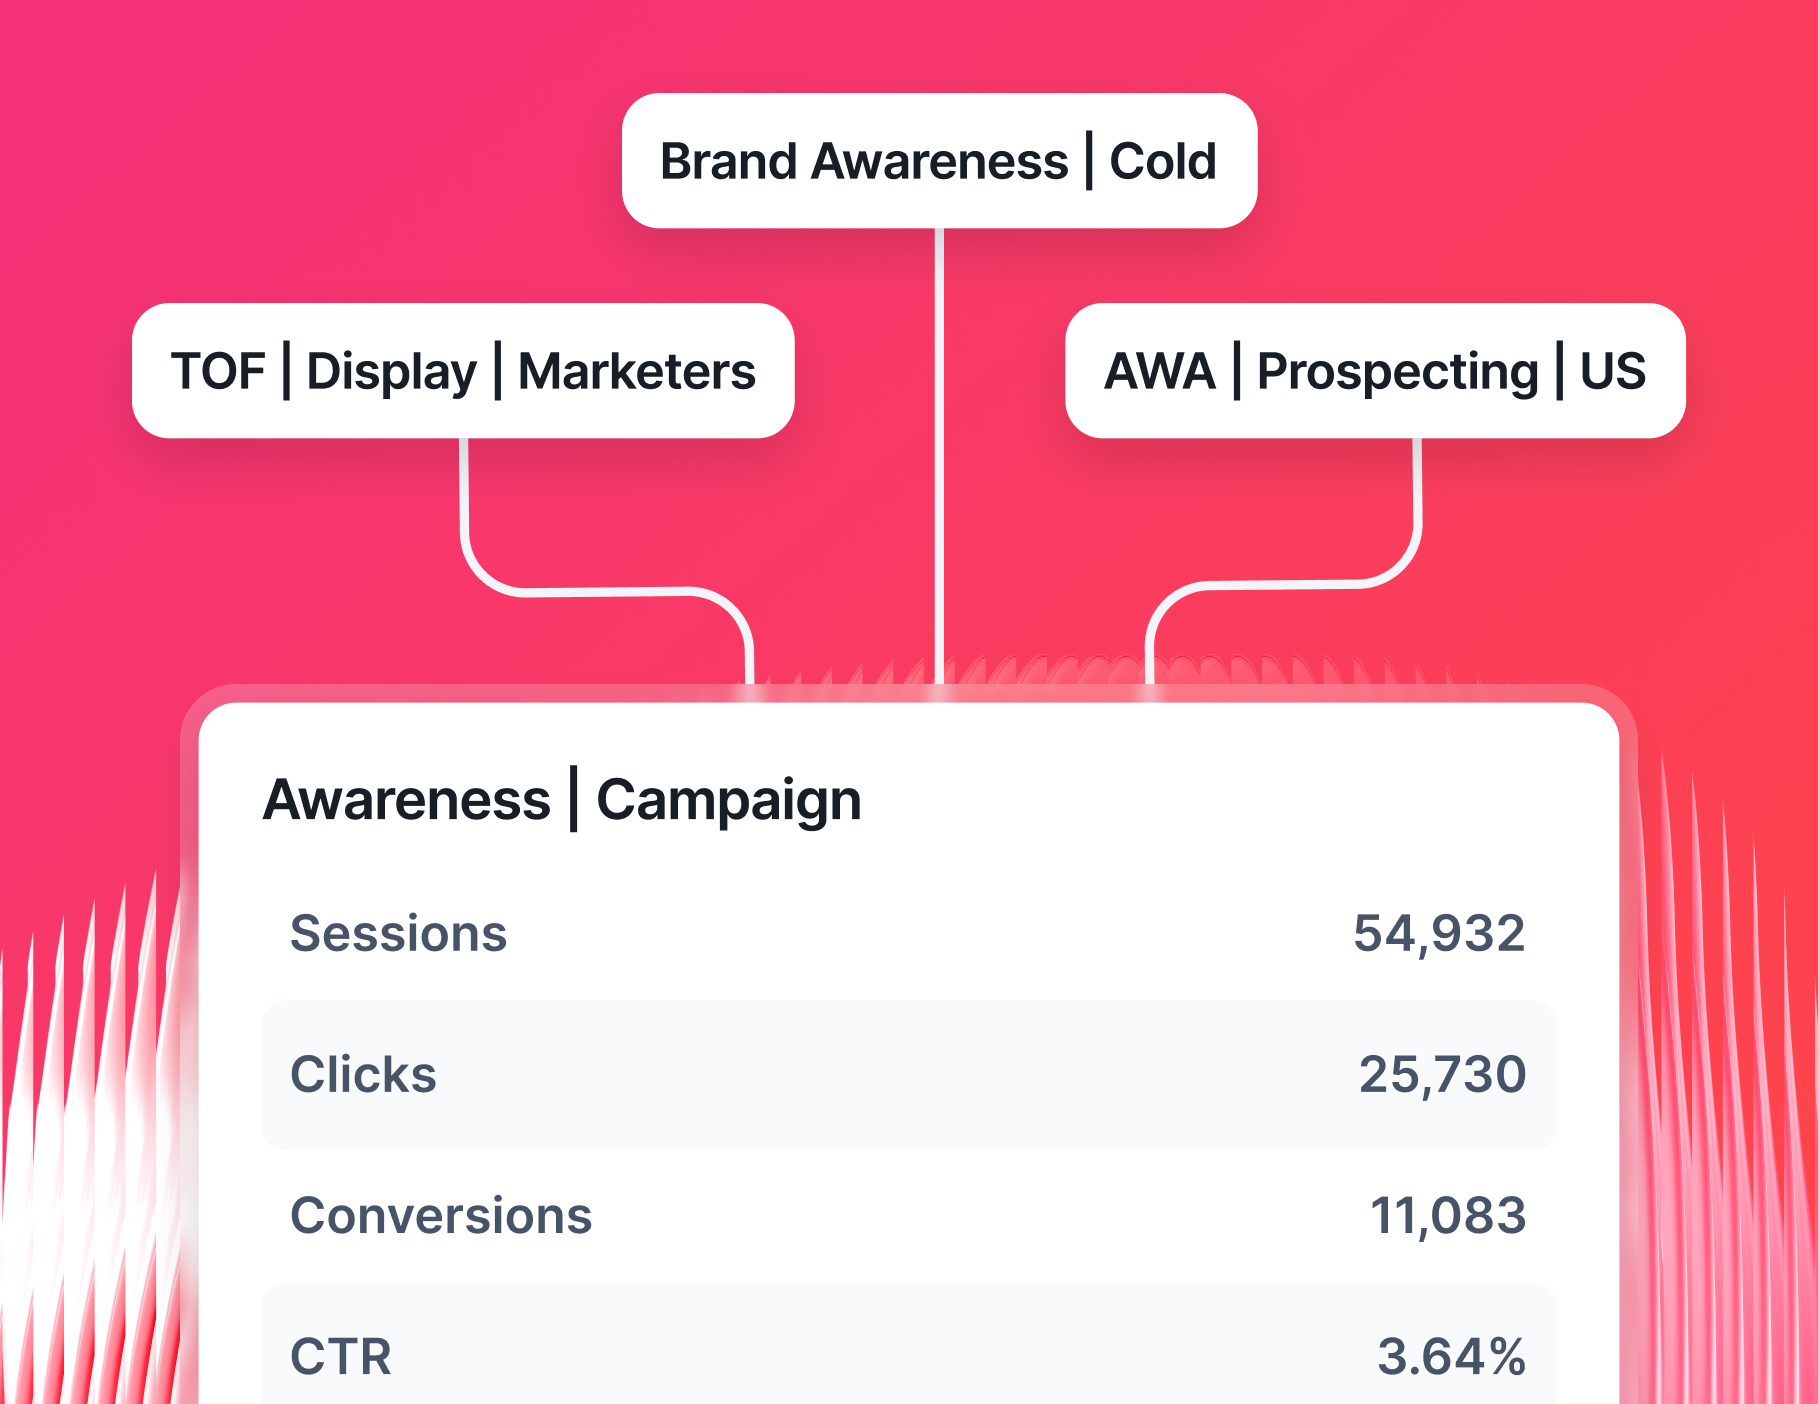
- Group messy campaign names by objective or funnel stage automatically
The bigger your client roster gets, the more the ability to replace manual tasks pays off in hours every week.
Danielle Roberts experienced this firsthand when switching to Whatagraph:
As we scaled, our reporting needs became more complex. We needed a tool that could grow with us and make reporting more efficient. Whatagraph lets us pull in all the data we need, fit hundreds of locations in one report, and break it down exactly how our customers want.
3. Build and brand reports with AI
This is where most agencies used to lose the most time. But not anymore.
With Whatagraph IQ, building a custom client report is as simple as describing what you need:
- Generate full reports instantly: Type your requirements and IQ builds the entire report - charts, KPI widgets, tabs, graphs, and layout included
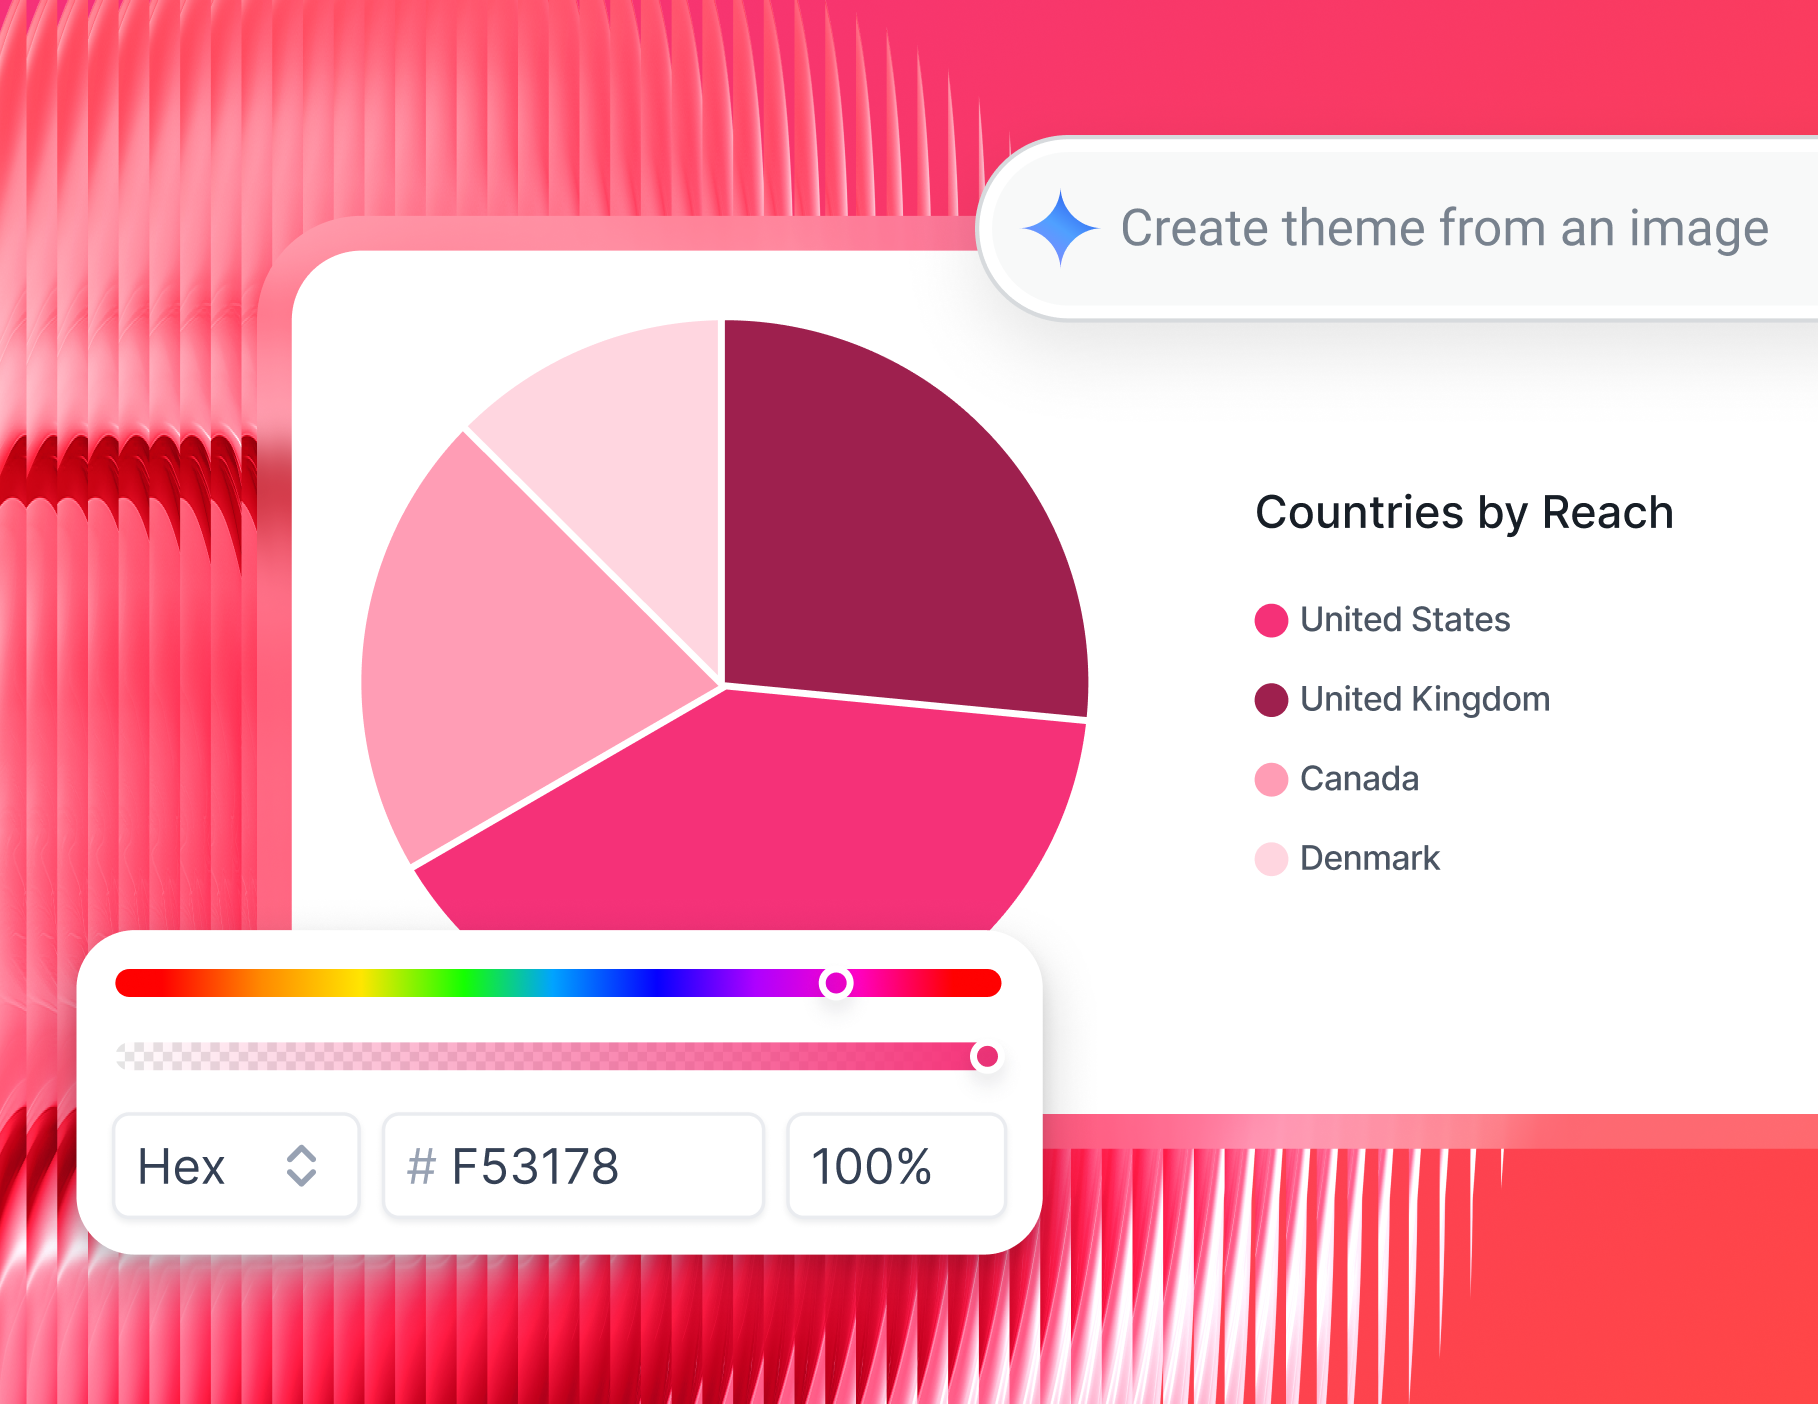
- Brand reports automatically: Upload a client logo or brandbook screenshot, and IQ Themes applies the matching fonts, HEX codes, and icons across the whole report
- Write performance summaries: IQ reads the actual data on your report and writes plain-language summaries - edit them for your own take, or send as-is
IQ also helps to build individual widgets from plain text. André Cardoso from Wise Pirates uses it exactly that way:
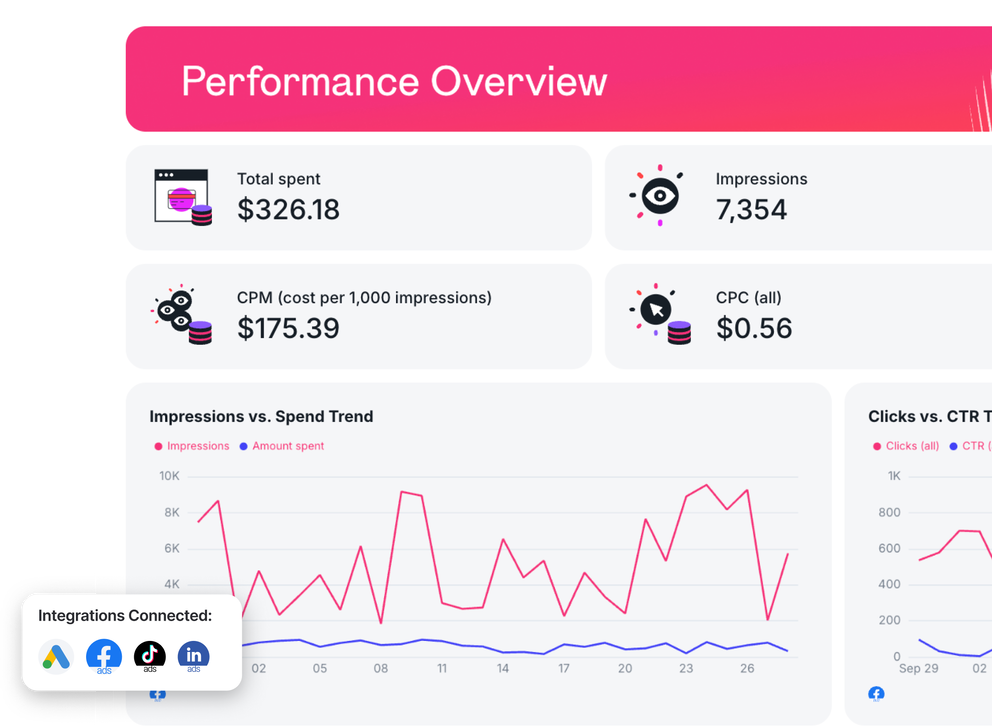
The AI Widget Creator is awesome at creating simple widgets, like number of impressions in Meta, number of impressions in Google Ads, the average CPC, average CPM, and so on." - André Cardoso, Wise Pirates
Want full control instead? Start from a blank canvas and drag-and-drop from a library of pre-built widgets. With every widget, you can change the label, size, icons, chart type, currency, and date range.
When building your custom reports, the goal is to surface what matters - not everything you could possibly track.
A dashboard with 27 million different metrics is often unhelpful or confusing. What I've focused on instead is identifying the few core KPIs that help us quickly spot when something is going wrong in an account - because we want to catch negative trends as early as possible. - Elizabeth Greene, Co-Founder, Junglr
4. Monitor performance with internal dashboards
Client reports are one thing. Your team also needs a live internal view to stay on top of every account without logging into ten different platforms.
On Whatagraph, you can build internal dashboards called Overviews to:
- Track KPIs across all campaigns and clients in one place
- Flag accounts that are underperforming or hitting targets
- Monitor Account Manager workload and performance at a glance
- Set custom spend caps and conversion goals with alerts
Slice by channel, client, region, or manager - whatever fits how your agency is structured.
5. Add AI summaries and answer performance questions
As Alexander Mitrofanov, Senior Paid Media Specialist, Tag Worldwide, concludes, "If your report doesn't include 'what we're doing next,' it's incomplete."
Clients don't want a wall of charts. They want to know: what happened, why, and what's next.
With Whatagraph IQ Summaries, your team doesn't have to write those answers from scratch. It works in three simple steps:
1. IQ reads the data directly on your report and generates a plain-language performance summary.
2. You can choose short or long format, edit the tone, add your own recommendations, or send it as-is.
3. For a bit of human touch, you can edit the summary as much (or as little) as you want.
Try it out here:
For ad-hoc questions - mid-call or mid-meeting - IQ Chat has you covered. Ask anything about campaign performance in plain language and get an accurate answer in seconds.
You can also turn on IQ Chat for clients directly on their live report, so they can get answers without emailing you.
As Martin Sandgaard, Co-Founder, AdsToGo, puts it:
Reporting with human input is 1000x more valuable than an auto-scheduled report. Context and action plans matter more than the numbers, and most clients don't open or understand reports without that context.
With IQ Summaries and IQ Chat, writing these summaries and adding context to your reports is something your team can do in minutes instead of hours.
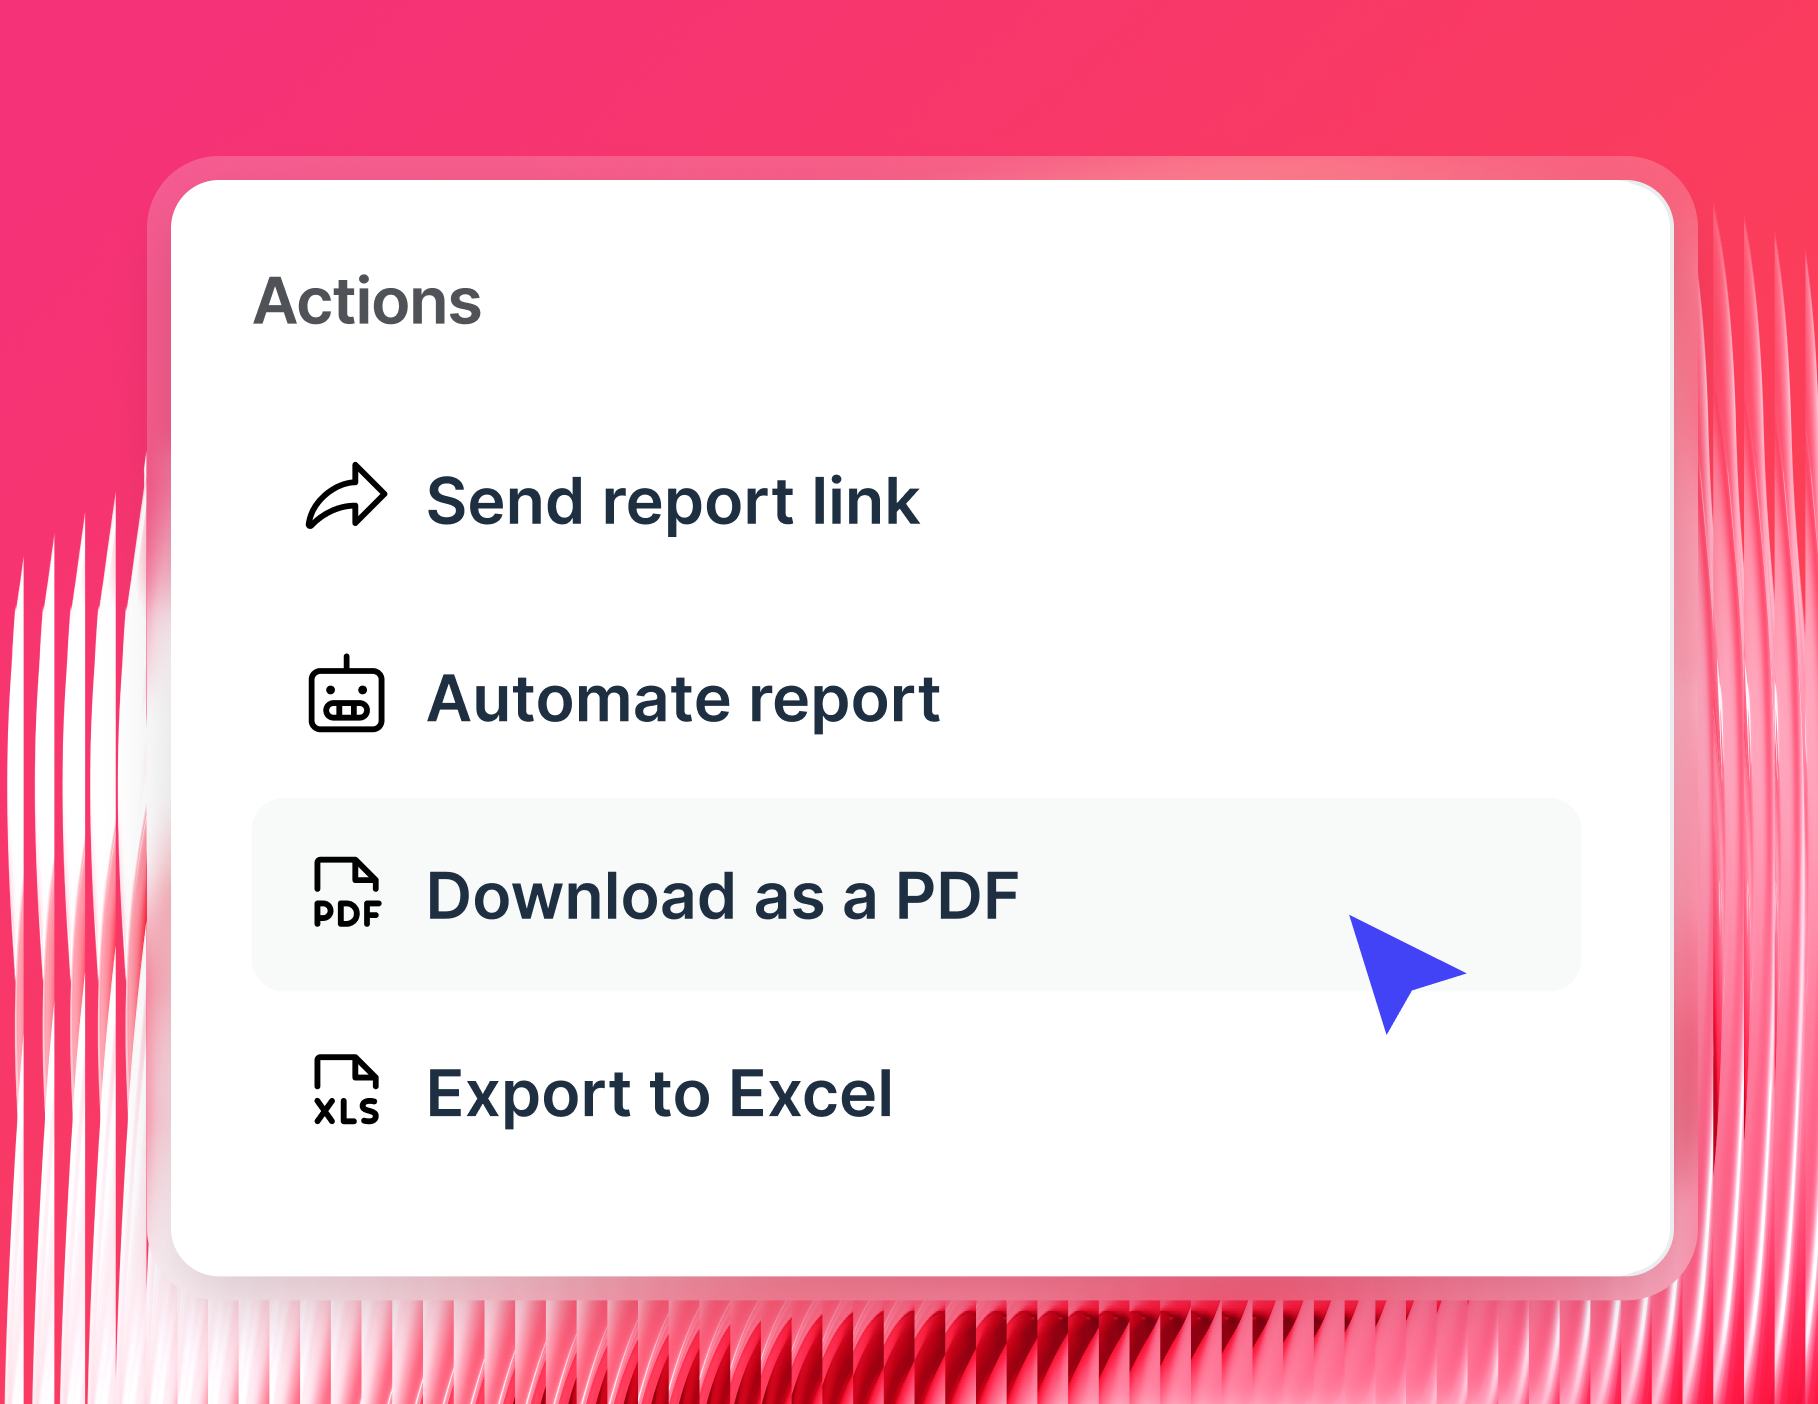
6. Share the report
Once your report is ready, choose how it gets delivered:
- Automated email: Schedule recurring delivery on a specific date, time, and cadence
- Slack: Send reports directly to a team or client channel on a schedule
- Live links: Clients access real-time data anytime - no login required
- PDF or CSV exports: For presentations, archives, or offline use
- White-label delivery: Use your own custom domain and sender details