6 Best Ecommerce Reporting Tools in 2026 and Beyond
I ran a successful thrift store on Instagram with orders coming through DMs, and payments dropped into UPI. But my business “dashboard” was me.
If I wanted to know which marketing campaign actually worked, I had to piece it together myself—payment by payment, post by post. That’s the same struggle many ecommerce businesses face today, albeit with more zeroes…and more tools.
A patchwork of tools lends itself to a thorny problem: according to Splunk, 55% of an organization’s data remains dark.

Jan 02 2026●10 min read


Your sales data sits in one dashboard, your ad spend in another, your email results somewhere else.
I know the risk of picking the wrong ecommerce analytics tool feels heavy…but so does the cost of running blind.
So, in choosing this list, I focused on criteria I would’ve liked in my ecommerce reporting tool for my business:
Criteria | Question to ask |
| Can I see sales data, ads, and email performance in one view? |
| Does it connect natively to the platforms I rely on, or will I be patching gaps? |
| How much of my reporting load will this tool truly take off my plate? |
| Could I get this running quickly without an expert on standby? |
| Will the pricing still make sense as I grow? |
Let’s make your ecommerce data work like it should: clean, connected, and actually usable.
TL;DR: 6 Best Ecommerce Reporting Tools in 2026
Your shortlist of the best all-in-one, easy-to-use, holistic automated reporting platforms built specifically for ecommerce teams:
- Whatagraph: Best for ecommerce businesses that want a fast and easy reporting tool with powerful AI workflows.
- Looker Studio + Supermetrics: Best for data-savvy teams who want full customization and don’t mind piecing together their reporting stack.
- Saras Pulse: Best for omnichannel stores looking to increase customer lifetime value.
- Peel: Best for Shopify stores focused on customer retention, cohorts, and repeat purchase customer behavior.
- Glew: Best for omnichannel stores that need a centralized view of product, inventory, and customer data in one dashboard.
- Heap: Best for teams that want to go beyond “what happened” and understand why users behave the way they do.
1. Whatagraph
Yes, this is our product. Yes, you’re reading this on the Whatagraph blog. But we put it first because we’ve seen too many ecommerce teams burn out trying to “Frankenstein” reports from five tools and two analysts.
Whatagraph earns this billing. Especially now, with Whatagraph IQ—our newest AI-powered launch, we’re making ecommerce reporting painless.
Key features:
- 55+ native, fully managed integrations: Platforms across paid ads, social, SEO, email, ecommerce, analytics, CRM, call tracking, and more—e.g., Shopify, Klaviyo, GA4, Meta Ads, BigQuery, etc.
- Automated, white‑label cross-channel reporting: Complete with password-protected live dashboards and scheduled emails.
- Report customization and interactivity: 15+ widget types (charts, funnels, tables, etc.), brand styling, notes, and multi-tab layouts. Interactive dashboards—hover, filter, click.
- Whatagraph IQ (AI toolkit):
- Generate full reports from a single text prompt.
- Add tabs/widgets via AI—e.g., “Show conversions from Facebook Ads last quarter.”
- Style reports with branded themes using prompts, Hex codes, or uploaded assets.
- IQ Chat: ask data questions and get instant answers; right inside the report.
- Auto‑generating, auto‑updating text summaries with IQ+ when date ranges shift.
So, how does Whatagraph measure up against my five must-have criteria? Let’s find out. (Quickly, I promise.)
1. Unified dashboard for all metrics
You need a single, at-a-glance view of your business performance: sales reports from Shopify, marketing efforts in Klaviyo or Meta Ads, even campaign-level breakdowns—all mapped to the customer journey in one place.
Whatagraph offers 55+ fully managed, native integrations; we bring data from your stores, ad platforms, email tools, analytics, and more into a single source of truth.
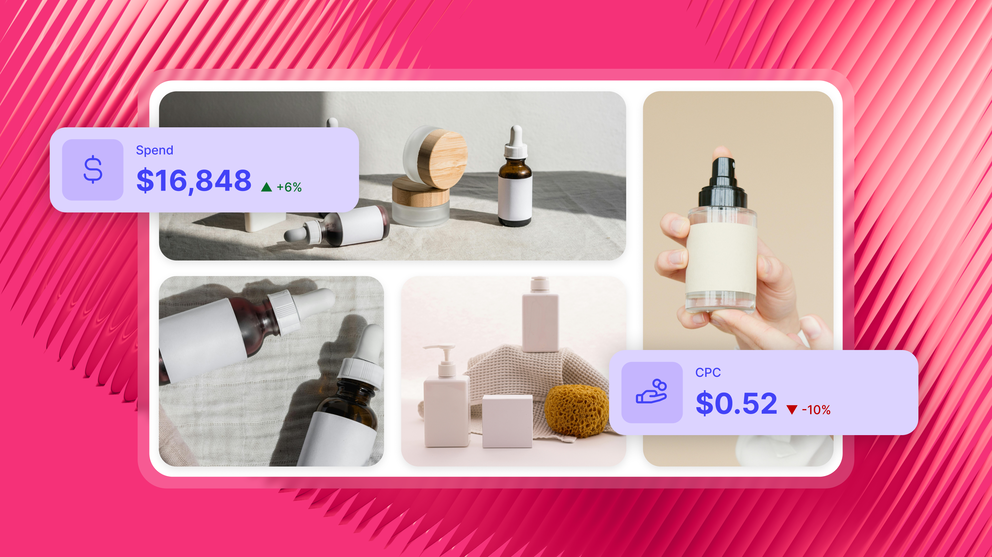
 Aside from quantity, what you get is better context. Because all your data lives in one platform, you can see, for example, how your Shopify or WooCommerce conversion rate interacts with your Reddit Ads ROAS. Or how a spike in Klaviyo email opens ties to a jump in average order value—all in one, visually stunning ecommerce dashboard.
2. Reliable integrations
We’ve got 55+ fully managed, native integrations. The setup takes minutes; the data flows cleanly, and the ecommerce metrics show up like they’re supposed to.
What does that look like in practice?
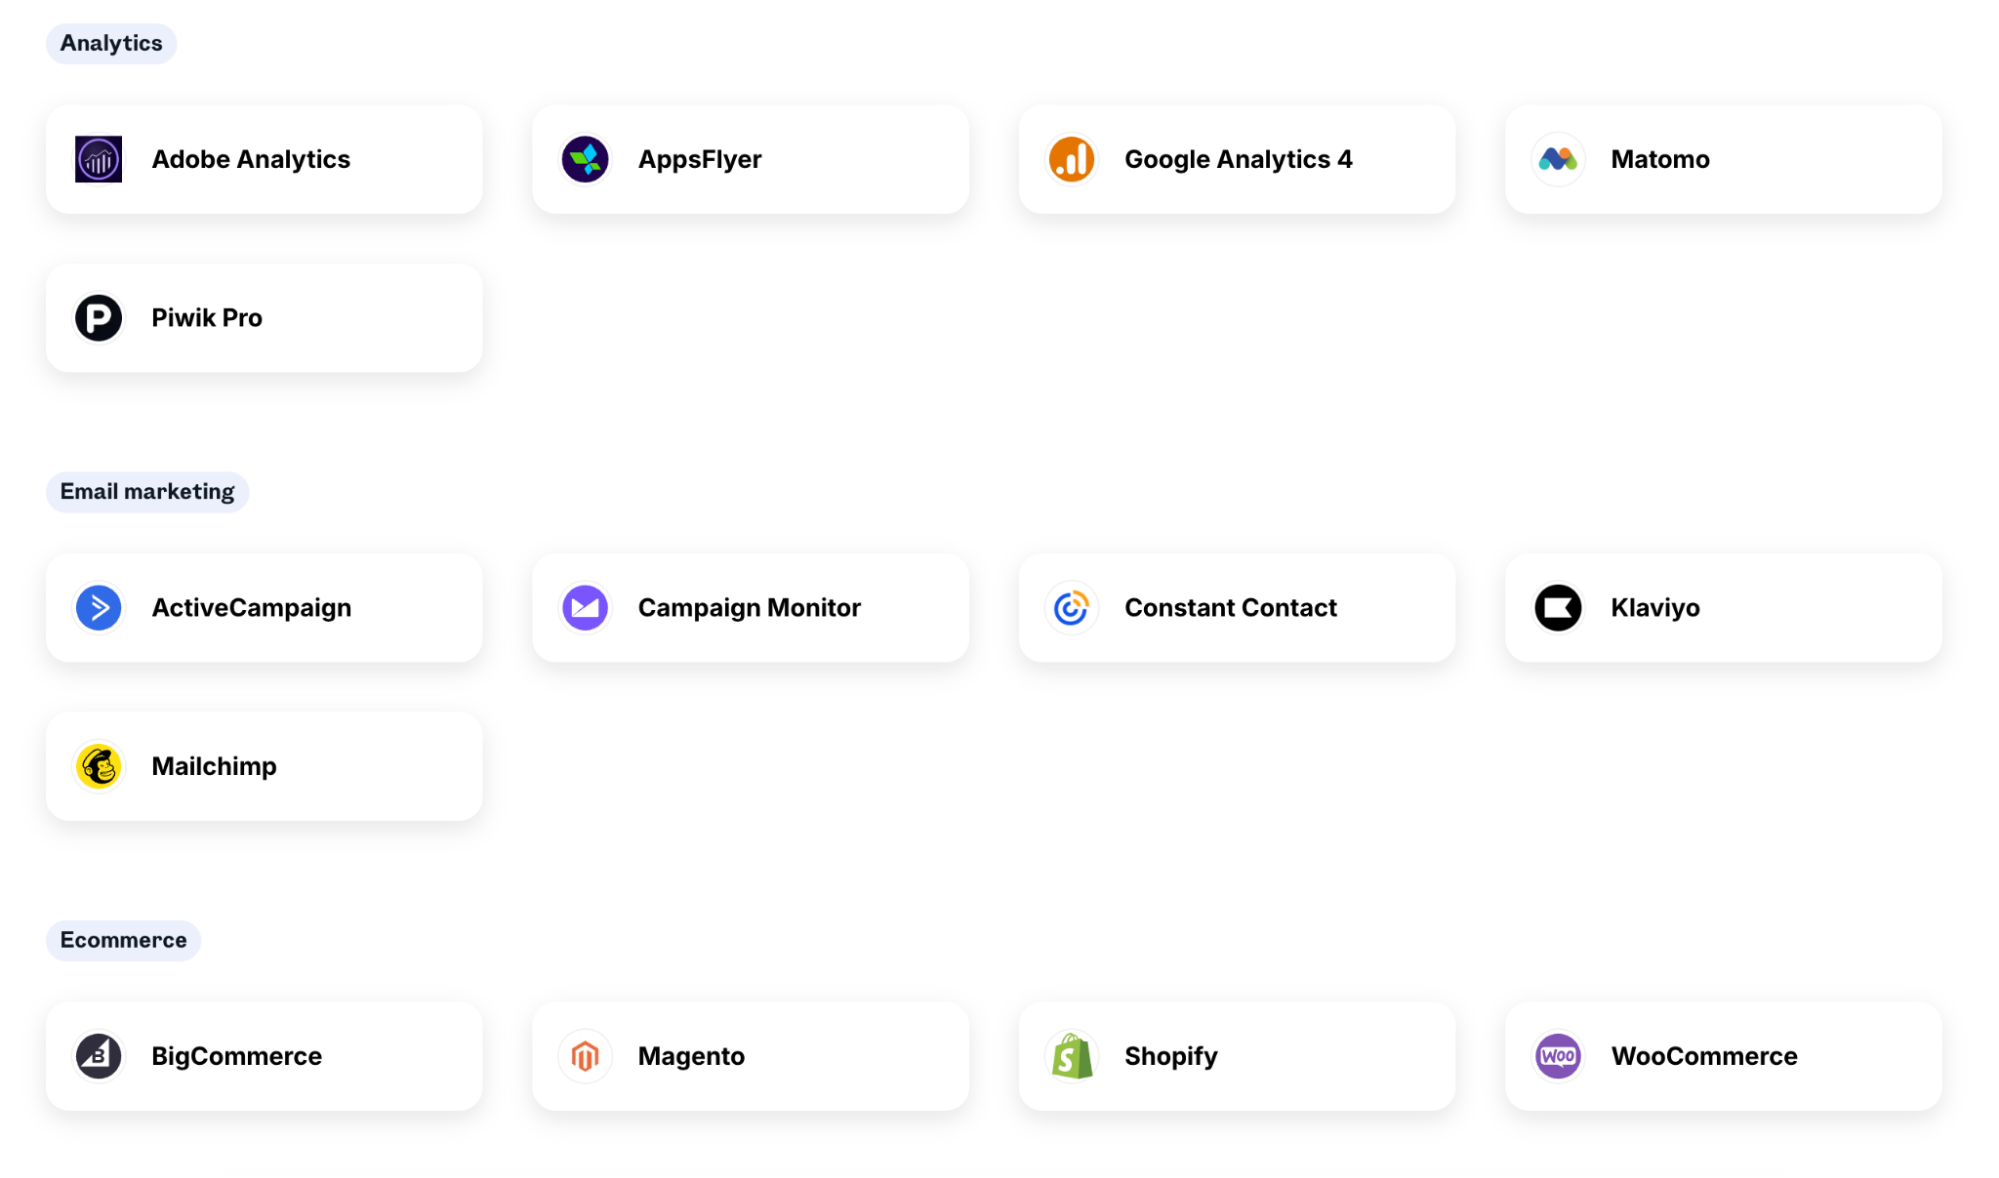
- Shopify, Meta Ads, Klaviyo, TikTok, Google Ads, Google Analytics 4 (GA4)—all connect in clicks.
- Historical data pulls cleanly, so you’re not stuck with half-empty graphs.
- Metrics are pre-mapped, so your ROAS shows up as ROAS—not “custom_metric_4bX9”
- Data updates in real time (or on your schedule).
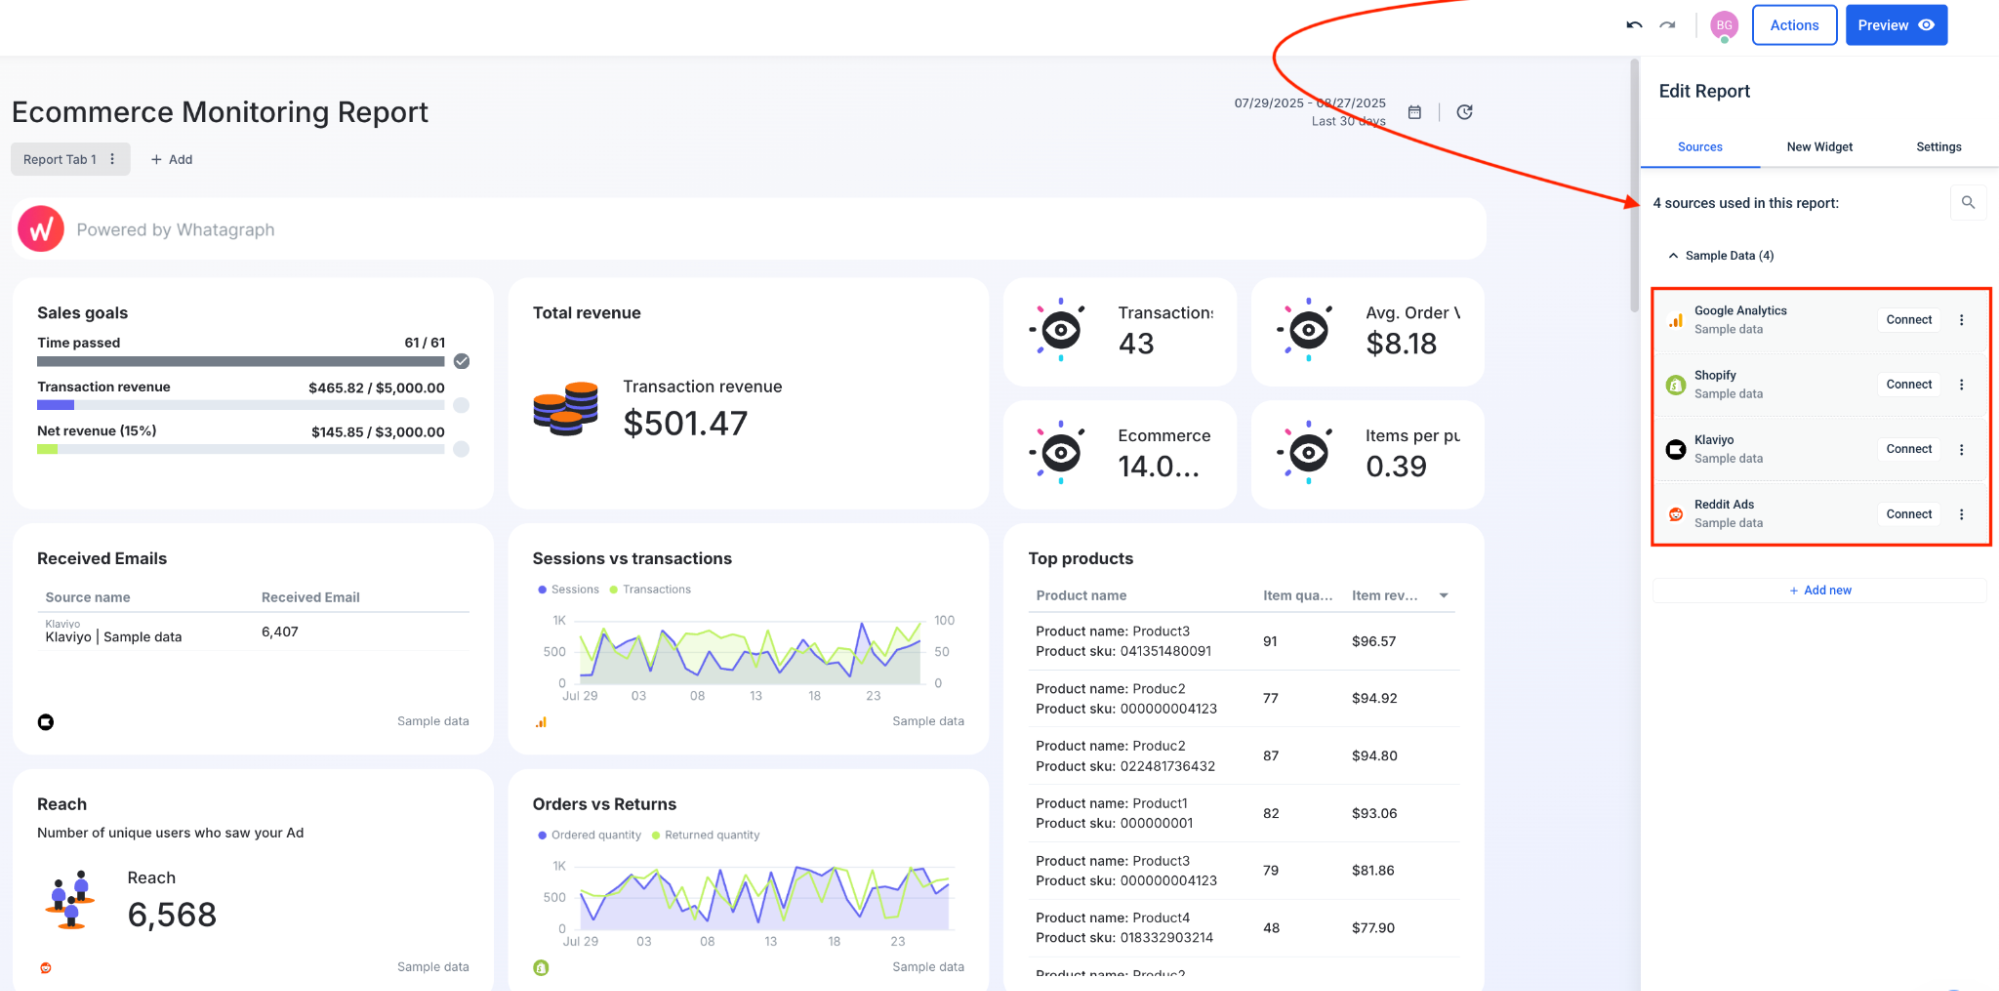
See how easy it is to connect a data source:
And if one of your tools isn’t supported out of the box, you’re not stuck. Plug in Google Sheets for homegrown metrics, use BigQuery for warehouse data, or connect via the Custom API when you’re pulling numbers from a niche platform.
3. Automation that reduces manual work
If your reporting process feels like a second job, it's not scalable…it's not even sustainable.
Whatagraph was already great at automating the basics: scheduled reports, repeatable templates, live dashboards.
Real-life success story: Switching to Whatagraph completely changed the way Kim and her team at Peak Seven handle reporting. What used to take her 4 hours in Looker Studio now takes 1.5 hours or less with Whatagraph. Multiply that across 25 reports a month, and she’s saving 63 hours—every single month. That’s $9,450 saved for her clients.
Whatagraph is now our Bible—both for clients and internal teams,” Kim shared. “It’s also my favorite part of the job—I’m genuinely within Whatagraph 6 out of 8 hours a day.
And now, with Whatagraph IQ and IQ+, the grunt work disappears altogether.
1. Build a full report from one prompt: Go from blank canvas to structured, filter-ready report in seconds. Just describe what you want: “Create a GA4 report showing acquisition and engagement over the last 30 days.”
And boom—key metrics, KPIs, visuals, and filters show up.
2. Add new widgets or entire tabs with a few words: Right-click anywhere and ask for what you need: “Add a line chart showing Facebook conversions this quarter.”
IQ adds it instantly, with the right data source, format, and filters baked in. Or build a whole new tab for a campaign, traffic source, or platform in seconds.
3. Style it to match your brand—automatically: Give IQ your brand color or upload your logo, and it’ll auto-generate a polished, on-brand theme.
Prefer dark mode with blue accents? Ask. Want your charts styled like your Instagram grid? Upload an image and let IQ take the lead. (You can always edit manually later.)
4. Chat with your data: Meet IQ Chat—your personal data assistant inside every report.
Ask:
- “What was our top-performing channel last month?”
- “How does this campaign’s CTR compare to last quarter?”
- “What can we do to improve conversion?”
Get plain-English answers instantly.

5. Normalize messy digital marketing campaign data in seconds: Let’s say you’ve got “Summer Sale,” “Summer-Sale,” and “2024_summersale” all floating around. With IQ Plus, you just give a few examples, and it’ll group everything under one clean custom dimension.
This is what we call intelligent momentum.
4. Ease of setup and use
You want to connect your data, build your report, and get back to actually running your ecommerce store.
Whatagraph gets that.
Here’s what the setup looks like:
- Connect a data source.
- Use our FREE eCommerce report template, start from scratch, or type in a prompt for Whatagraph IQ to take the lead.
- Customize visuals, metrics, and layout with drag-and-drop widgets.
- Schedule it to go out weekly, monthly, or on whatever panic-free cadence you prefer.
I put Whatagraph to the test to show you just how easily you can go from blank canvas to data-driven decision-making in less than three minutes:
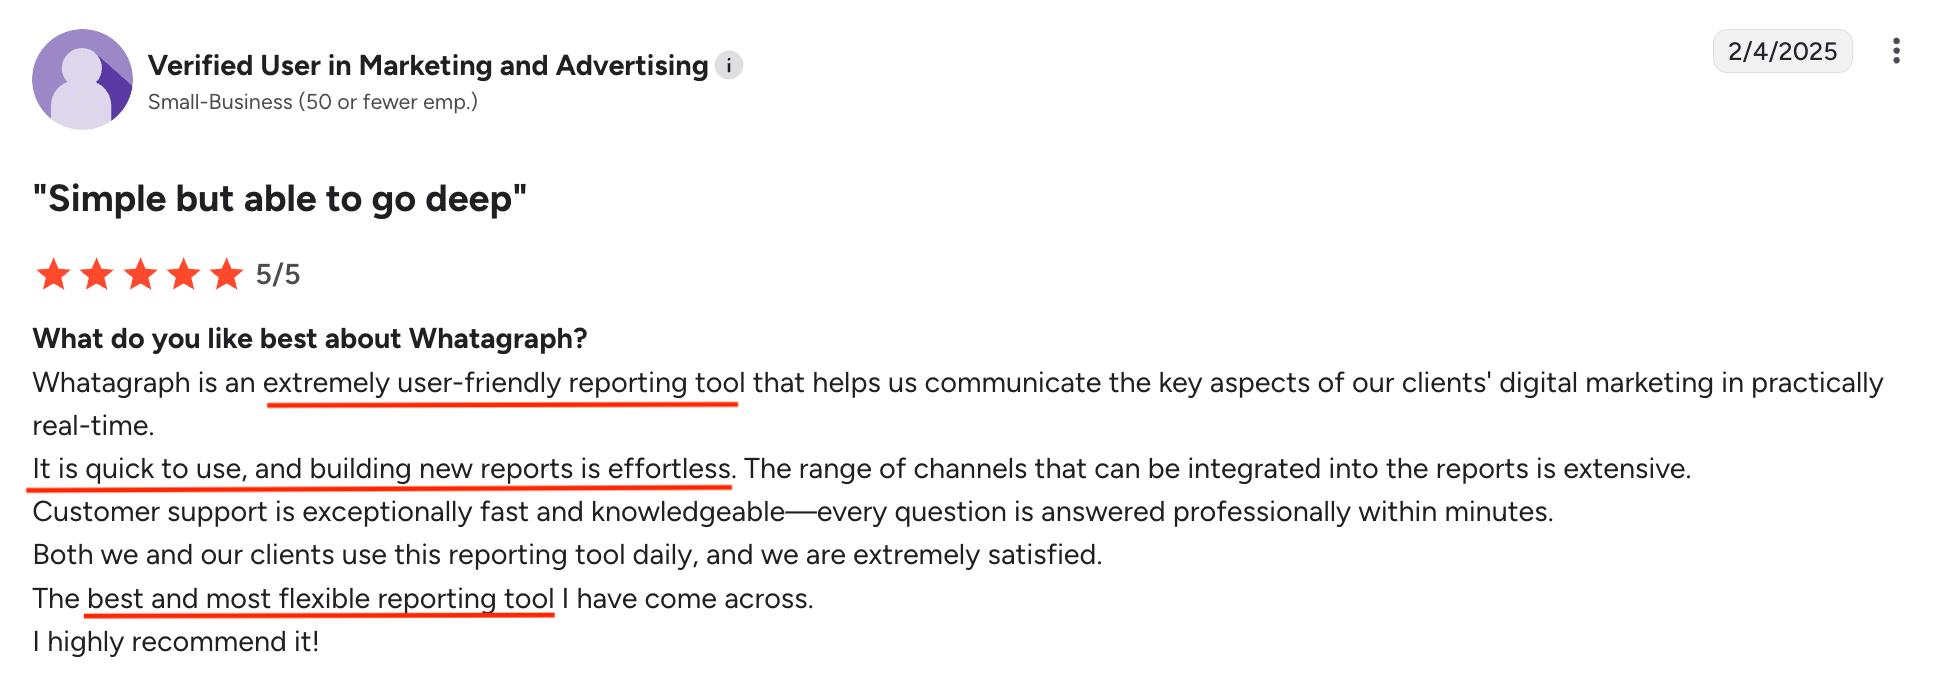
This is the ease of use you feel immediately, because the tool moves as fast as you do. And that’s why recent, verified reviews call Whatagraph an “extremely user-friendly reporting tool”:
5. Affordability and scalability
The wrong ecommerce reporting software will nickel-and-dime you. Or worse, lock you into an enterprise plan before you’re anywhere near enterprise scale.
When you’re running lean, every dollar counts. When you’re scaling, flexibility matters even more.
Here's how Whatagraph makes sure you stay lean:
Whatagraph pricing:
Whatagraph’s pricing is designed around one idea: you shouldn’t pay for seats, you should pay for the data you actually use.
Every plan includes unlimited users and unlimited reports, so your whole team can collaborate without worrying about licenses.
- Forever-free – lets you get started at no cost, with 5 source credits, Whatagraph IQ basics, templates, and live chat support.
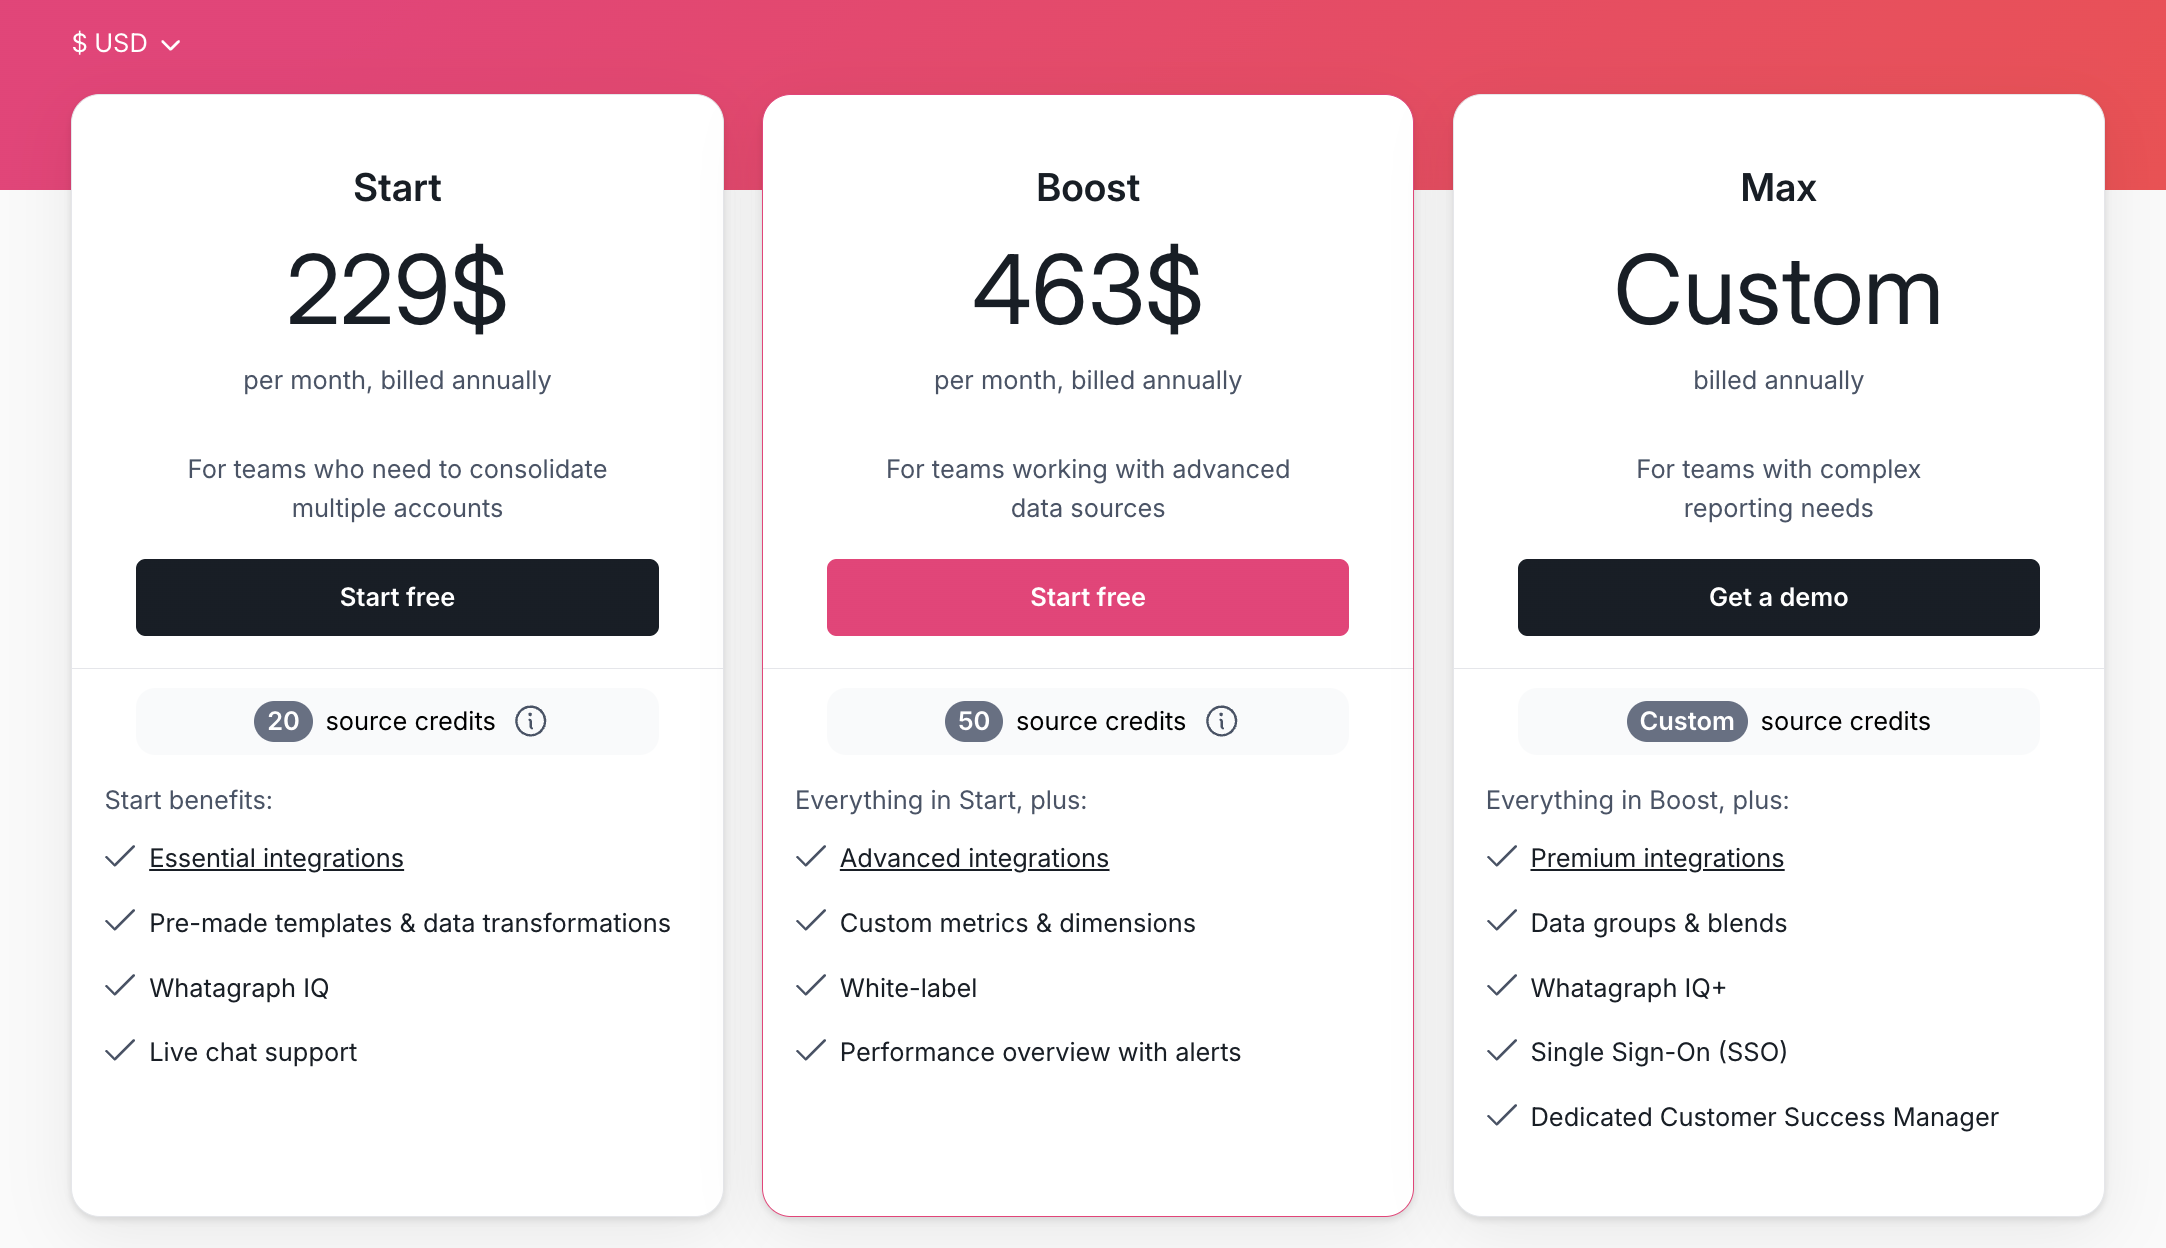
- Start ($229/mo billed annually) – includes 20 source credits and essential integrations
- Boost ($463/mo billed annually) – jumps up to 50 source credits, adds advanced integrations, custom metrics & dimensions, white-labeling, and performance overview with alerts
- Max (custom pricing) – for enterprise/complex teams, with custom source credits, premium integrations, data groups and blends, Whatagraph IQ+, SSO, and dedicated Customer Success Manager
Whatagraph pros:
- AI that saves real time: Build full reports from prompts, add widgets in seconds, and auto-generate insights with Watergraph IQ.
- Quick ramp-up: Most teams can connect data and ship their first report in under half an hour.
- Solid integrations: Shopify, Klaviyo, Meta Ads, GA4, TikTok, and 50+ others connect cleanly and reliably.
Whatagraph cons:
- Not every source is covered natively (yet): Niche or very new platforms may still require a Google Sheets or API workaround.
- Pricing fit depends on scale: Freemium makes it accessible, but larger setups still represent a thoughtful investment.
Start free with Whatagraph today.
2. Looker Studio + Supermetrics
Looker Studio plus Supermetrics is the classic reporting DIY combination.
Key features:
- Supermetrics connectors: 138 marketing channels, ecommerce platforms, ad data sources, and lesser-known tools like Criteo or Outbrain.
- Custom dashboards: Full control over charts, layouts, and formulas. Or you can get started with Supermetrics templates for Looker Studio.
- Free core tool (Looker Studio): Only pay for Supermetrics licenses.
- Data warehousing options: Push data into BigQuery or Sheets before your data visualization.
On its own, Looker Studio (formerly Google Data Studio) is free, flexible, and deeply customizable. Build dashboards from scratch, design every chart to your liking, and share reports seamlessly within the Google ecosystem.
Pair it with Supermetrics, and the stack levels up. Suddenly you can pipe in Shopify, Meta Ads, TikTok, Klaviyo, and 100+ other platforms. Supermetrics does the heavy lifting on data extraction, Looker Studio does the data visualization, and together they give you the freedom to build virtually any dashboard you can imagine.
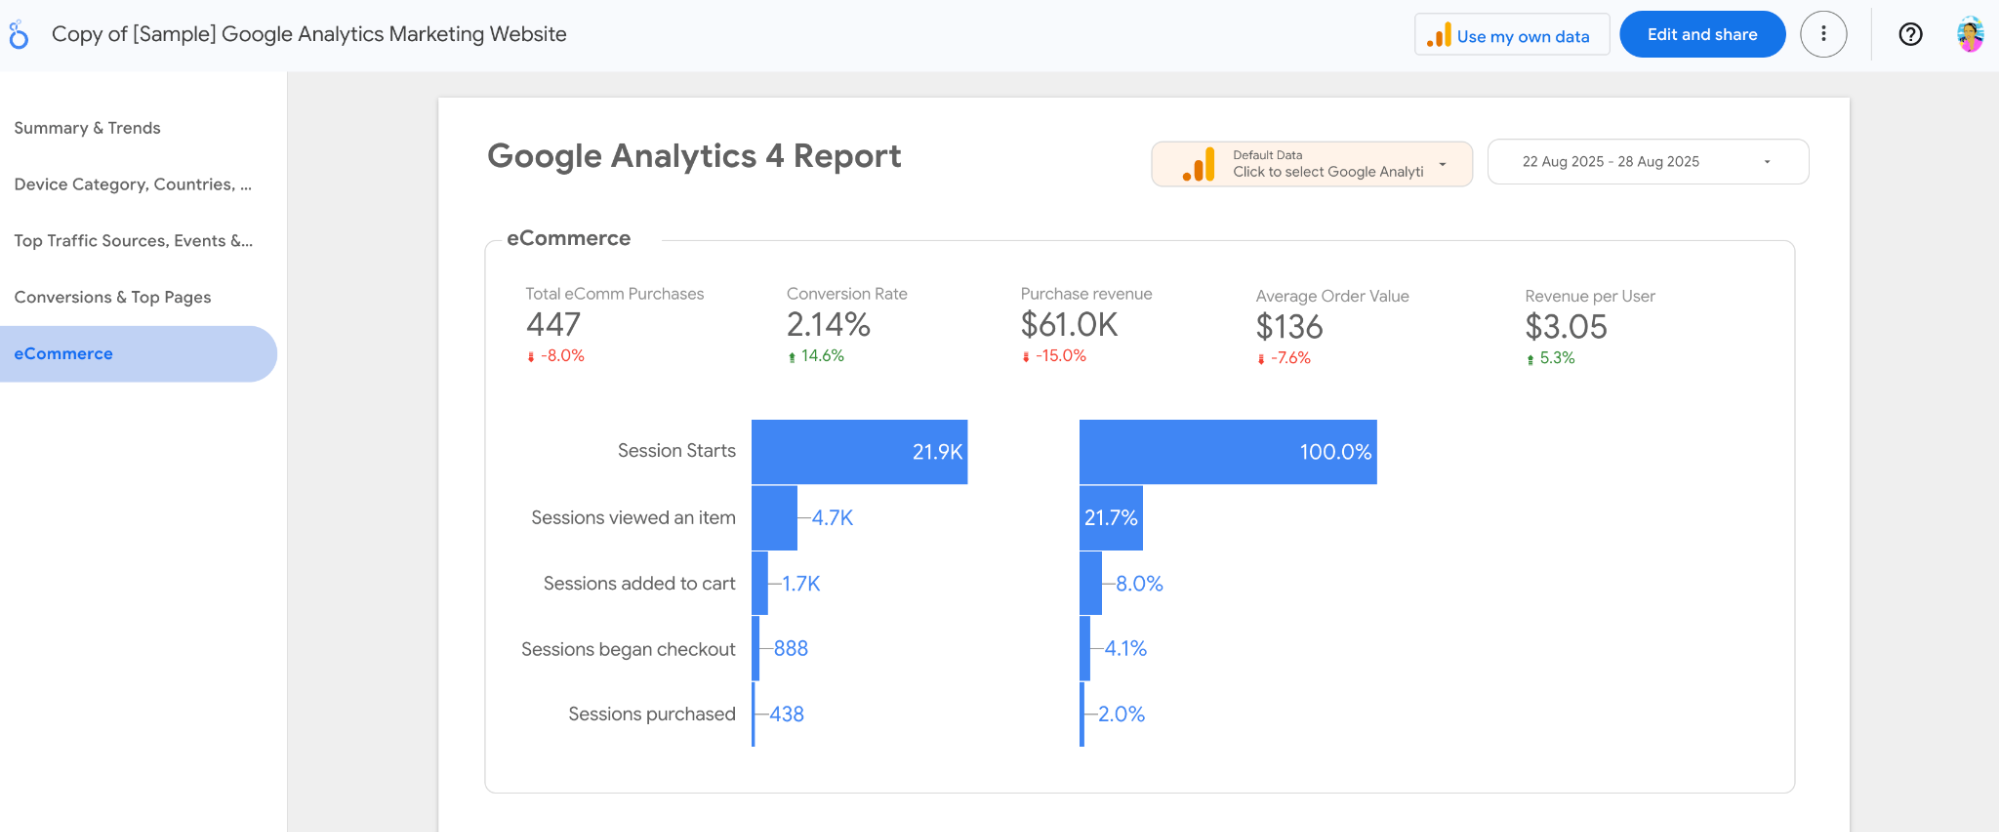
But when you pick this stack, you’re really picking two tools and the relationship between them. For example, I tested a Supermetrics Instagram Business template in Looker Studio.
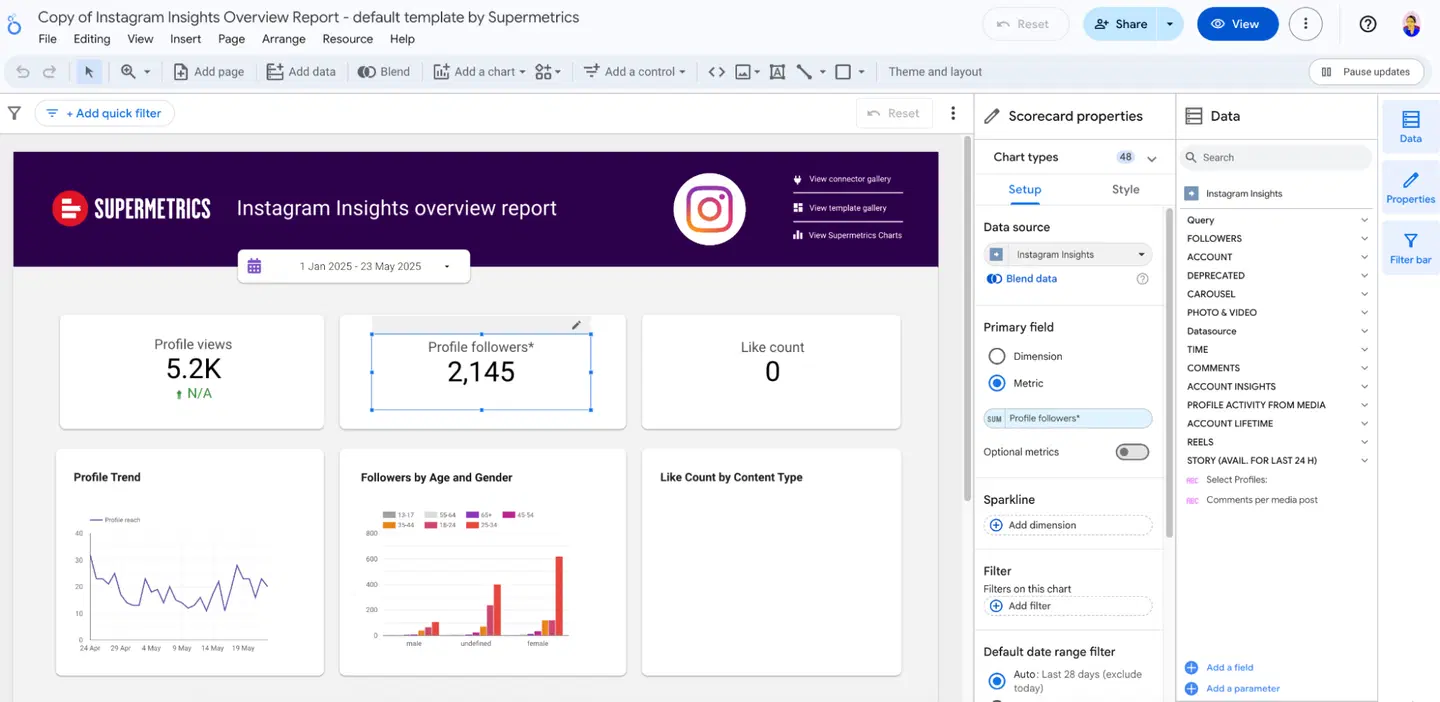
The data pulled in fine at first—but because you’re managing both the connector and the visualization, there’s always that lurking question: can I trust this report?
That’s the catch. Connectors break. API limits shift. Suddenly your “real-time” dashboard is showing stale or incorrect data. And in ecommerce, where you need to optimize ad spend or catch a conversion drop-off in real time, you don’t have the luxury of second-guessing.
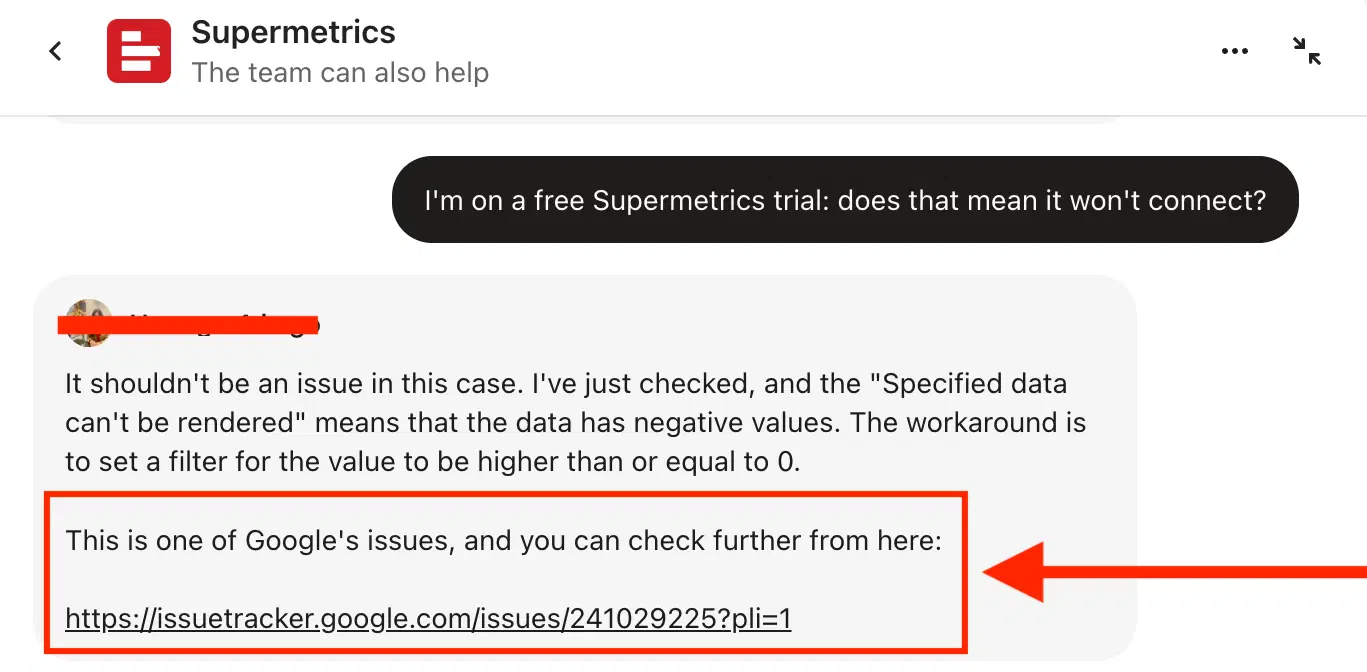
Plus, when something falls apart, who do you call? If a Supermetrics connector is clearly broken—say, their sidebar throws an error—then fine, Supermetrics support is your first stop.
But most of the time, it’s not that clear. I once asked why my GA4 data wouldn’t load in reports. The answer was that “it’s a Google issue.” I was pointed to Google’s documentation and left to figure it out myself.
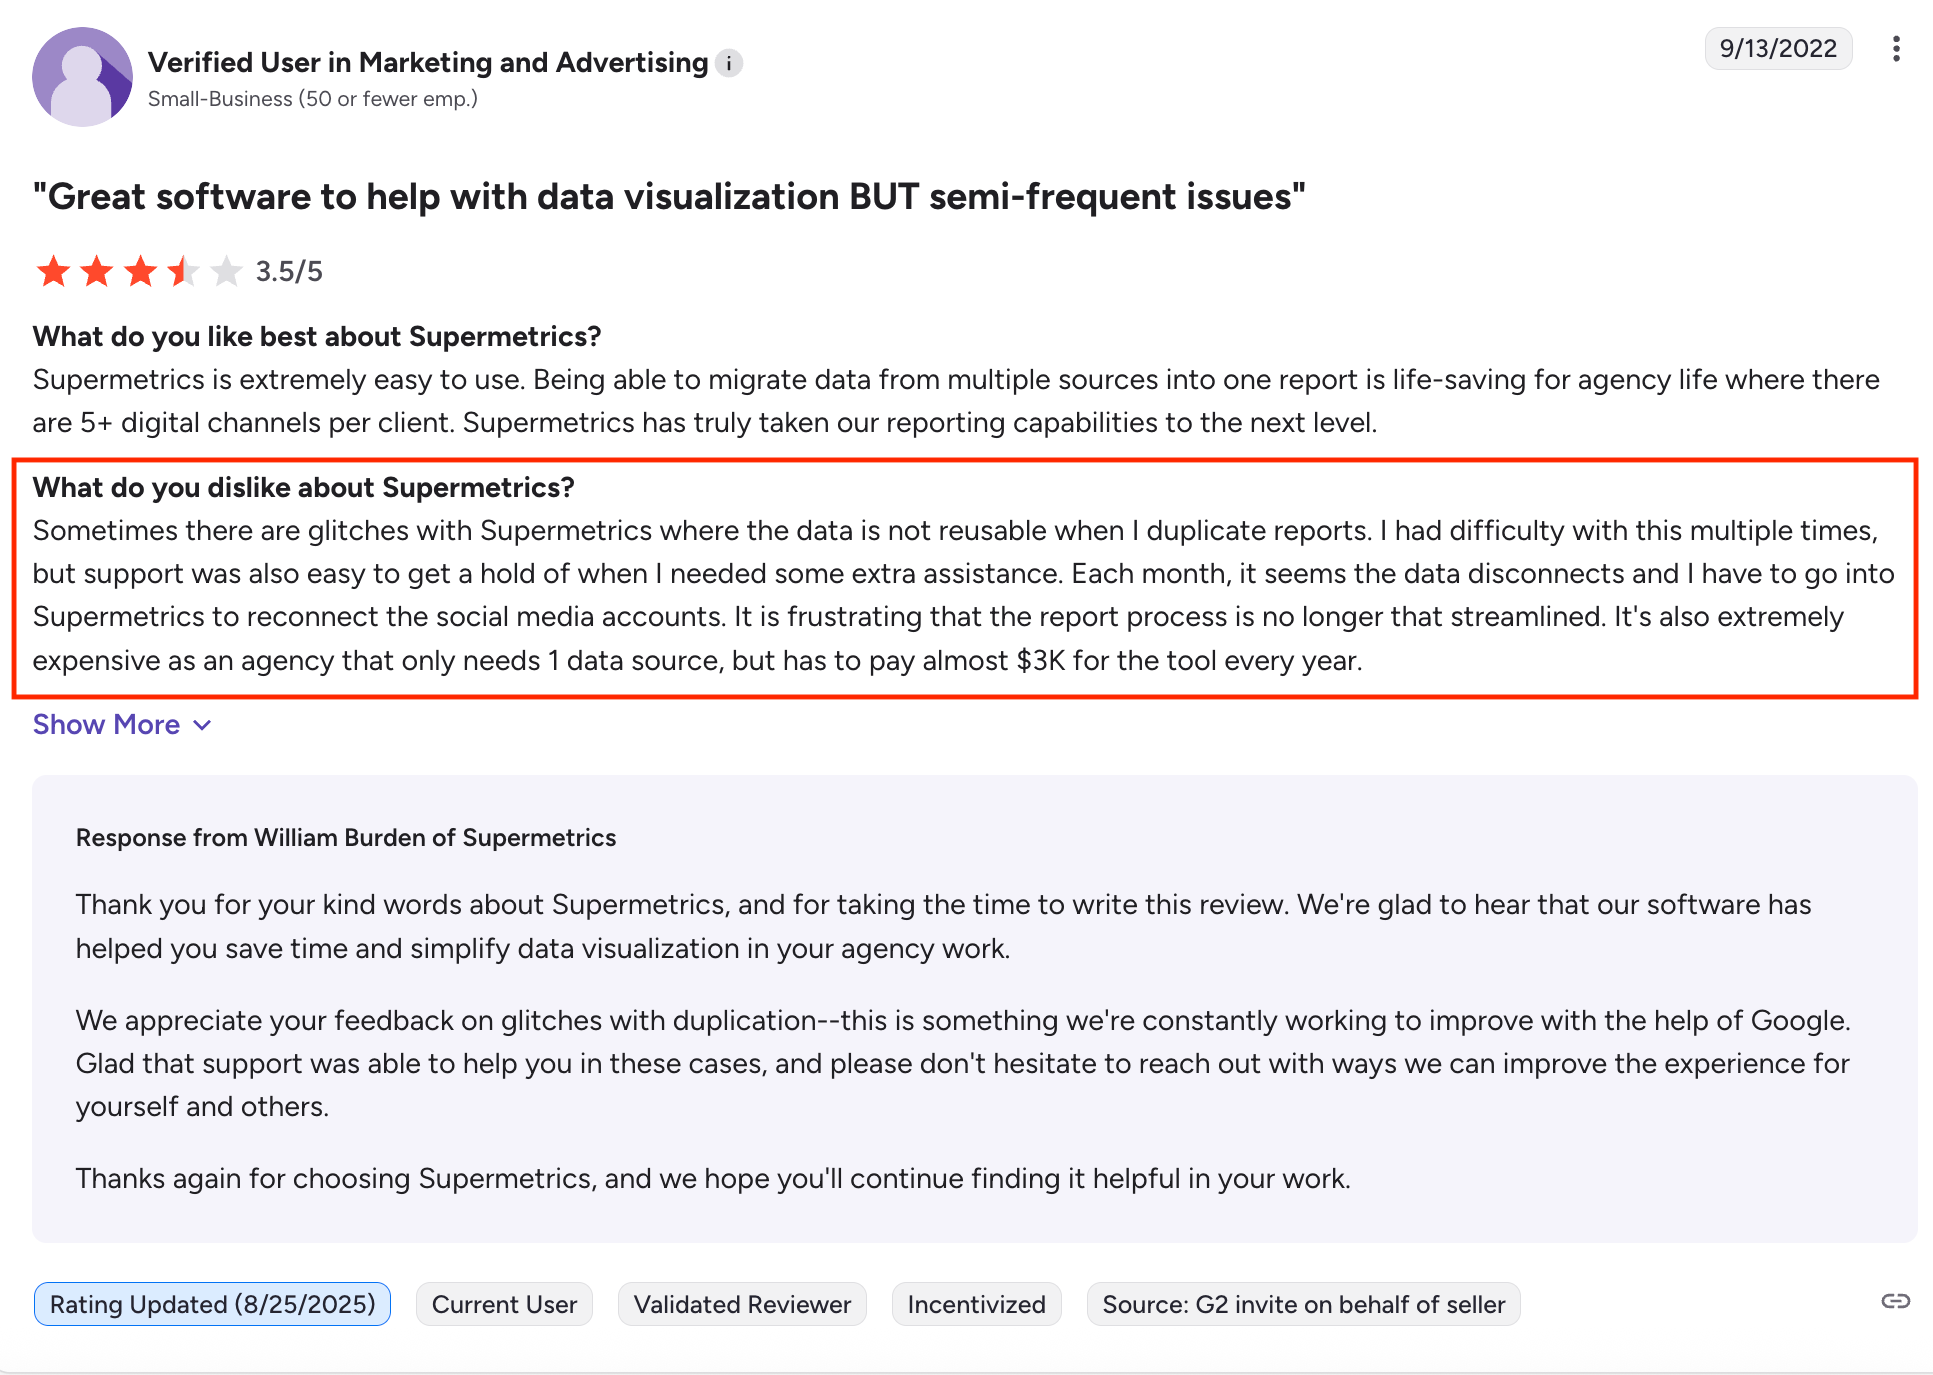
And I’m not alone in my frustration with this DIY combination. In the most recent review for Supermetrics on G2, here’s what a verified user shared:
“Each month, it seems the data disconnects and I have to go into Supermetrics to reconnect the social media accounts…It's also extremely expensive as an agency that only needs 1 data source, but has to pay almost $3K for the tool every year.”
Looker Studio + Supermetrics pros:
- Cost-efficient starting point: Looker Studio itself is free (at first), so you only pay for the connectors.
- Report templates available: Supermetrics provides prebuilt templates to accelerate setup for common marketing + ecommerce reports.
Looker Studio + Supermetrics cons:
- Two tools, two moving parts: Supermetrics is just the pipe; Looker Studio is the dashboard. Both need to work together; and they often don’t.
- Not real-time friendly: In ecommerce, where campaigns shift daily or even hourly, laggy or unreliable data makes optimization risky.
Looker Studio + Supermetrics pricing:
Looker Studio offers three pricing editions, with quotes, not exact pricing, provided by Google sales:
- Standard: Includes 1 production instance, 10 standard users, and 1,000 query-based API calls/month.
- Enterprise: Adds enhanced security and higher API call limits (up to 100,000/month).
- Embed: Designed for external analytics at scale, supporting up to 500,000 API calls/month.
Supermetrics’ pricing starts at:
- Starter: $29/month (billed annually): 1 destination, 3 data sources.
- Growth: $159/month (billed annually): 1 destination, 7 data sources, 2 users
- Pro: $399/month (billed annually): 1 destination, 10 data sources, 3 users, advanced features like data transformations.
- Business (Custom): Enterprise-grade, with API access, data warehousing, unlimited users, and premium support; pricing on request.
Customer success story: From Looker Studio + Supermetrics to Whatagraph
For Tanja Keglić, Performance Marketing Manager at Achtzehn Grad, reporting was a grind. On Looker Studio, large datasets crawled. Reports took forever to load. “We wanted to see our data quickly, but Looker Studio took so long to load,” she shared.
And connecting non-Google platforms meant paying extra for Supermetrics. But instead of relief, it added friction.
“It’s such a pain to reconnect a lot of sources and accounts with Supermetrics—and it takes so much time, which you don’t have when you want a quick report,” Tanja explained.
On top of that, Looker Studio capped data blends at 5 sources per report. For Tanja, that wasn’t enough.
Switching to Whatagraph changed everything.
We don’t have any connection issues on Whatagraph at all. We just connected the platforms once, and that was it. Whatagraph is also very fast when loading the data.
For Achtzehn Grad, the switch translated to 5+ hours saved per new report. And a reporting stack that finally matched the speed of their clients.
This is how you know you’ve outgrown Looker Studio.
3. Saras Pulse
Saras Pulse is built to answer the questions that keep enterprise operators up at night:
Are your fulfillment partners meeting SLAs? Where are bottlenecks—from order to last-mile delivery? What’s the true cost-per-order, and is your routing logic eating into margins?
Key features:
- Customizable dashboards: Tailored to the metrics your teams actually need, whether it’s campaign ROI, SLA compliance, or order routing costs.
- Bring your own business intelligence tool: If you prefer Tableau or Power BI, Saras Pulse plugs right in, so analysts don’t need to abandon their workflows.
- Massive connectivity: 5,000+ APIs supported and 200+ prebuilt connectors, covering everything from marketing platforms to logistics partners.
Saras Pulse isn’t the fast, lightweight reporting fix for startups; it’s the infrastructure layer for enterprise brands that need a single source of truth across thousands of data points. If your growth is outpacing your reporting, this is the kind of system that keeps marketing, operations, finance, and compliance aligned.
One thing to note: Unlike Whatagraph, Looker Studio, or Peel, Saras Pulse currently has no verified reviews on G2, Capterra, or Software Advice. That doesn’t mean it isn’t powerful; it just means you won’t find the same volume of peer feedback when evaluating it.
So, why is Saras Pulse on this list if it’s so new and has no reviews?
Because it reflects a shift in how enterprise brands are approaching reporting.
The ecommerce market is moving beyond plug-and-play dashboards; large omnichannel retailers want infrastructure that can: unify operational, marketing, and logistics data in one model; and deliver compliance-ready, analysis-ready datasets without heavy engineering work.
That’s the gap Saras Pulse is aiming at.
It’s not for everyone—and definitely not for small stores—but the free trial makes it possible for enterprise teams to test whether that kind of backbone is the right next step.
Saras Pulse pros:
- Enterprise-ready: Built for omnichannel brands juggling ecommerce, offline, logistics, and compliance.
- Operational depth: Dashboards that track fulfillment SLAs, routing costs, compliance metrics, and more.
Saras Pulse cons:
- New to market: Launched in March 2025, so it doesn’t have the battle-tested history of longer-standing platforms.
- Implementation lift: While powerful, setup may require more IT or data support compared to plug-and-play reporting tools.
- Enterprise fit: Likely overkill for smaller ecommerce teams; better suited for large, complex operations.
Saras Pulse pricing:
Here’s what Saras Pulse offers as of writing:
- Growth Plan starting at $250/month (billed annually): For growing omnichannel brands bringing in $1M–$10M in annual revenue, this tier includes: full access to standard features and all prebuilt data sources, managed data warehouse, up to 10 users, with live chat and email support, 1-day data recency and full historical history, enterprise-level security (SOC 2, MFA), SQL access.
- Enterprise Plan (custom): Advanced sources and features, including custom business logic and visualization, unlimited users and scheduled reporting (push to Slack or email), support over Slack, dedicated account manager, and 1:1 onboarding, option to bring your own data warehouse, full compliance, automation, and security baked in.
4. Peel
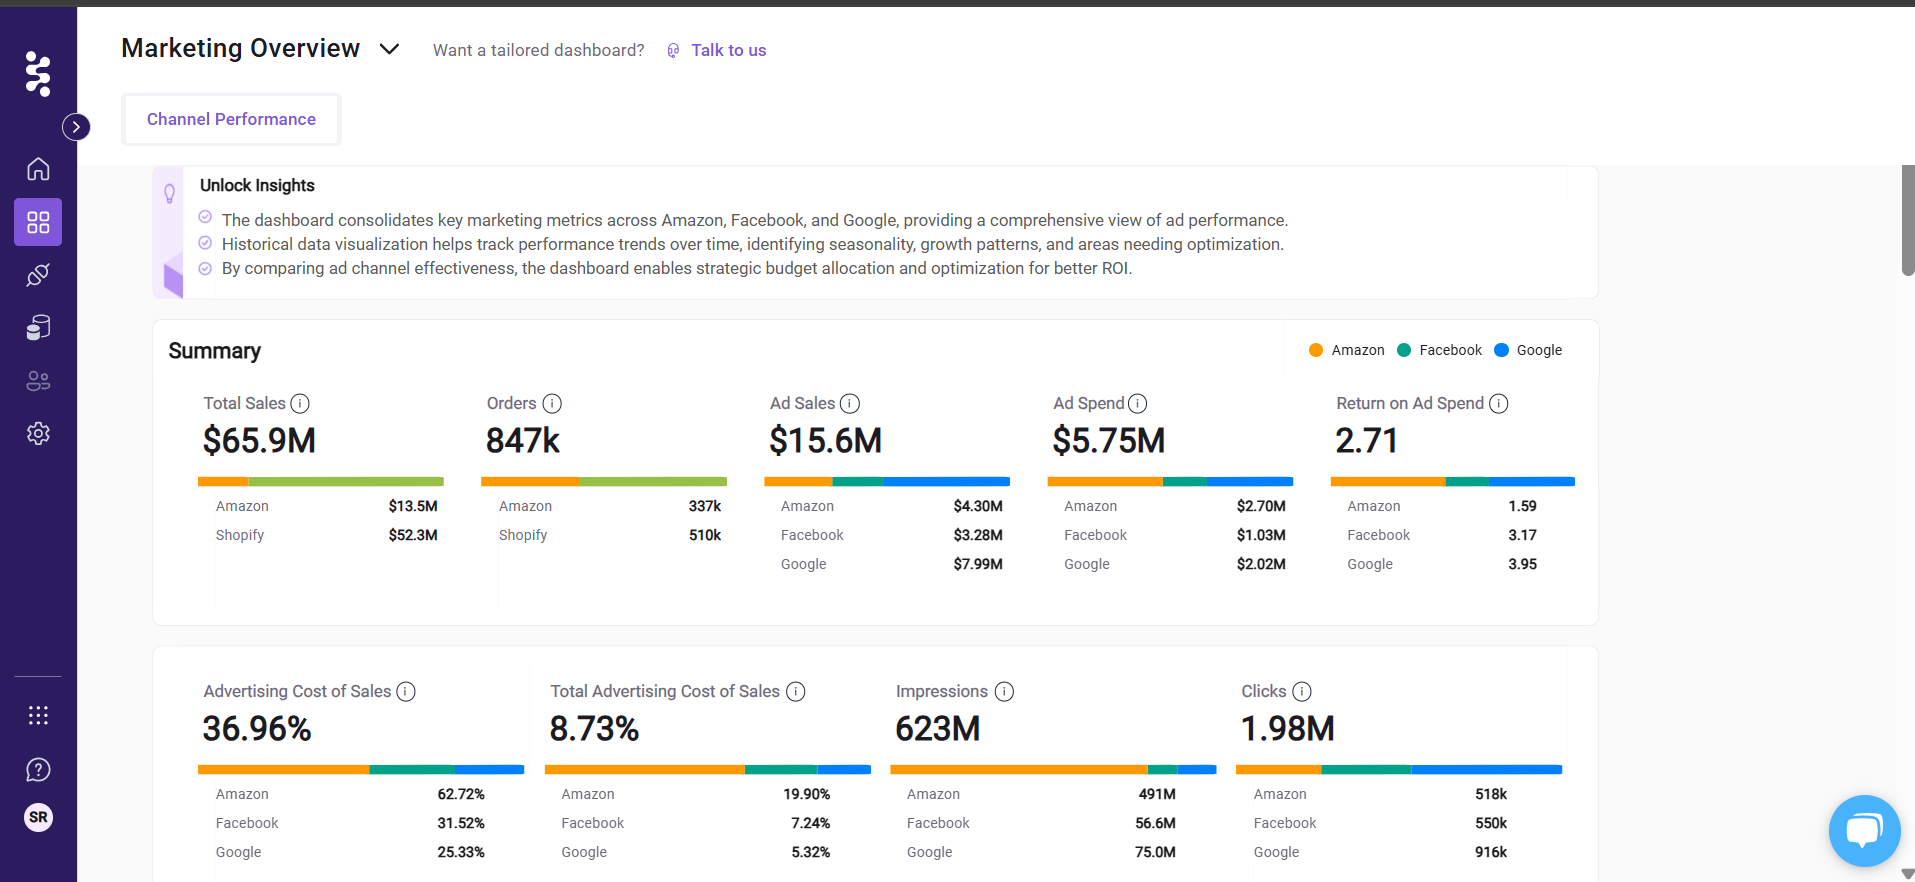
Most analytics tools stop at “what happened.” Peel is built to tell you “who’s coming back, why, and how to keep them.”
Key features:
- Audiences dashboard: Build hyper-specific customer groups with dozens of filters (tags, discounts, attribution channels, locations, and more).
- Customer segmentation: Slice any metric (AOV, repeat rate, lifetime value) by the filters that matter most.
- Product performance: Spot which products resonate with customers at different journey stages. Use it to plan bundles, upsells, or subscription pushes.
- Channel attribution: Peel uses Shopify’s native tracking plus UTM/referrer data to give you revenue attribution that you can tie to cohorts and retention, not just one-off sales.
- Marketing metrics: Link retention to campaigns.
Peel isn’t trying to serve every market under the sun. The tool is crafted with feedback from thousands of DTC brands, and it shows in the UX.
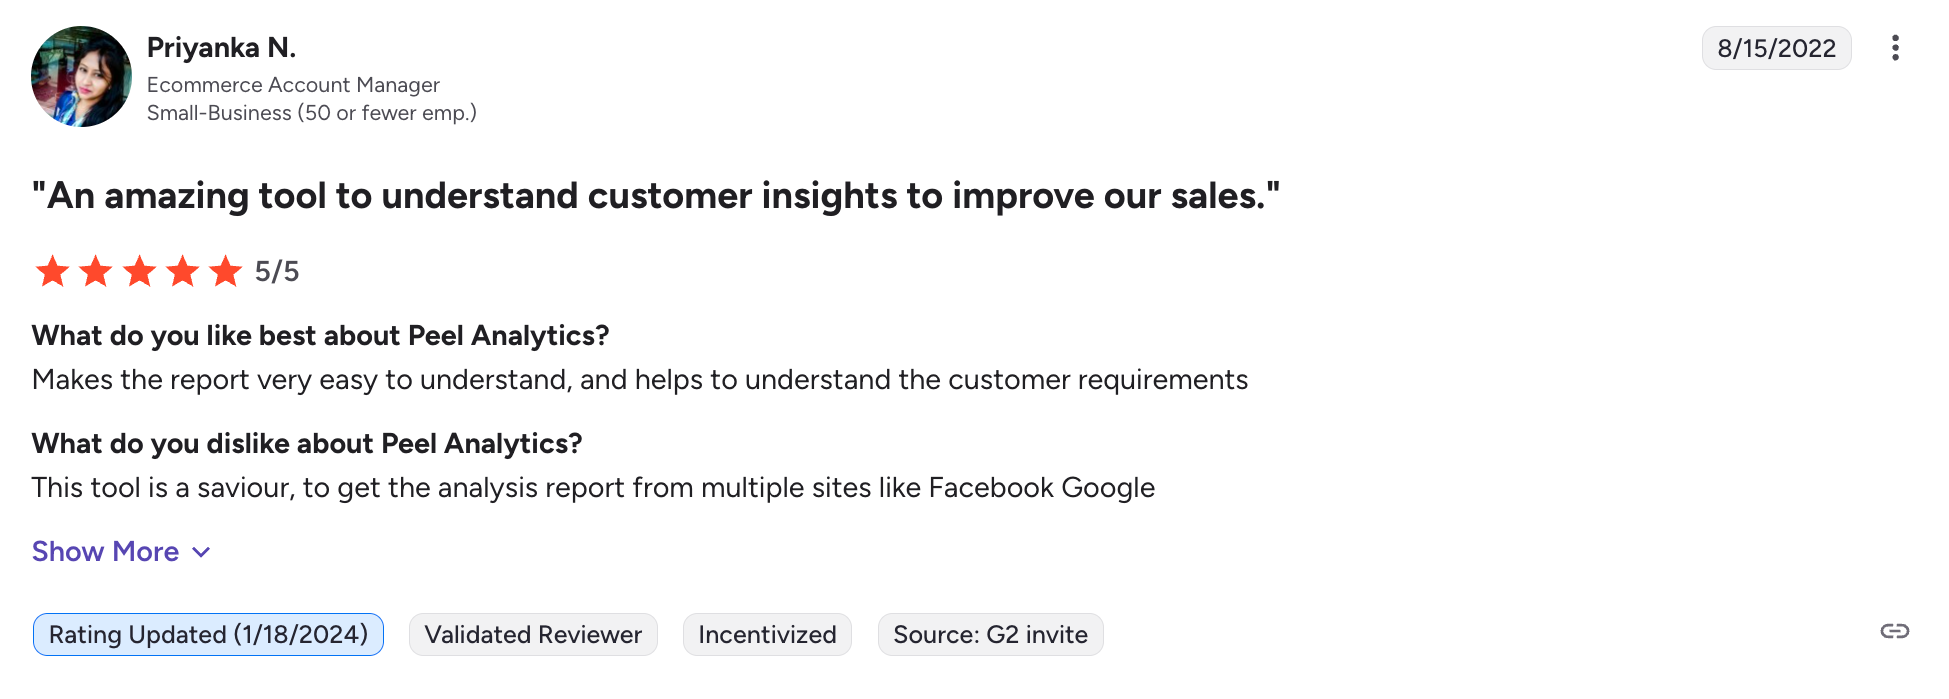
That’s why customers are responding to its promise:
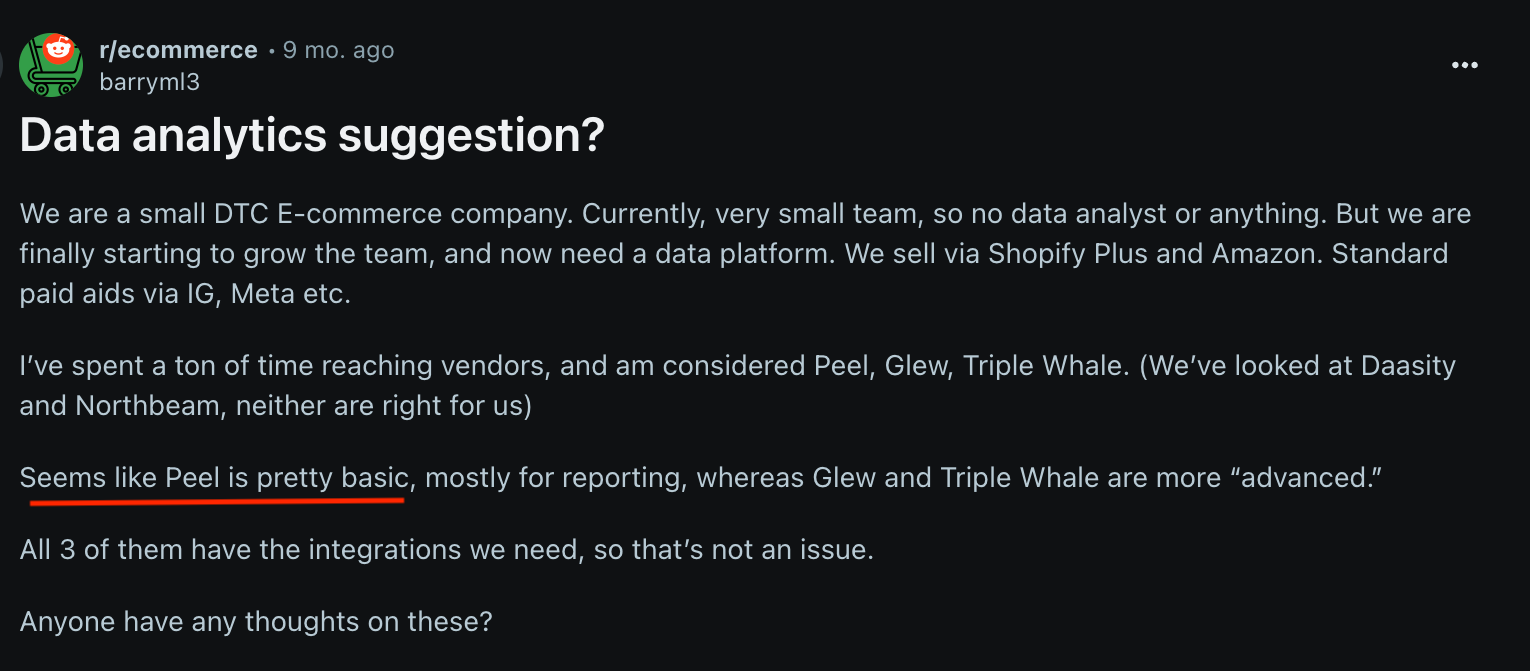
But even among Peel’s “ideal” customers—small DTC ecommerce companies selling through Shopify Plus and Amazon—some users feel it doesn’t fully live up to the pitch.
“Seems like Peel is pretty basic…”
Peel pros:
- Built with feedback from thousands of DTC brands: So the workflows reflect real merchant needs.
- Audience dashboard makes segmentation intuitive: Also syncs straight into Klaviyo, Attentive, or Facebook Ads.
Peel cons:
- Perception of being “basic”: Some DTC operators find Peel’s segmentation and attribution closer to basic reporting with filters than advanced marketing analytics.
- Shopify-centric: Works best if you’re in Shopify’s ecosystem; data integrations outside it can feel limited.
Peel pricing:
Peel’s pricing is structured by order volume, with tiers scaling as your DTC brand grows.
- Core from $179/month (billed annually): For brands processing up to ~6,000 orders/year. Includes all core connectors (Shopify, Amazon, GA4, Meta, Klaviyo, Attentive, etc.), 30+ cohort KPIs, segmentation, dashboards, automated insights, and Snowflake data access.
- Essentials from $449/month (billed annually): Supports ~16,000 orders/year. Adds higher reporting capacity, all connectors, and automated Slack/email digests.
- Accelerate from $809/month (billed annually): For larger brands handling ~29,000+ orders/year. Includes everything in Core + Essentials with expanded data usage, custom reporting, and more automated exports.
- Tailored (Enterprise) custom pricing: For 62,000+ orders/year. Designed for enterprise-level DTC brands needing tailored reports, unlimited connectors, and white-glove support.
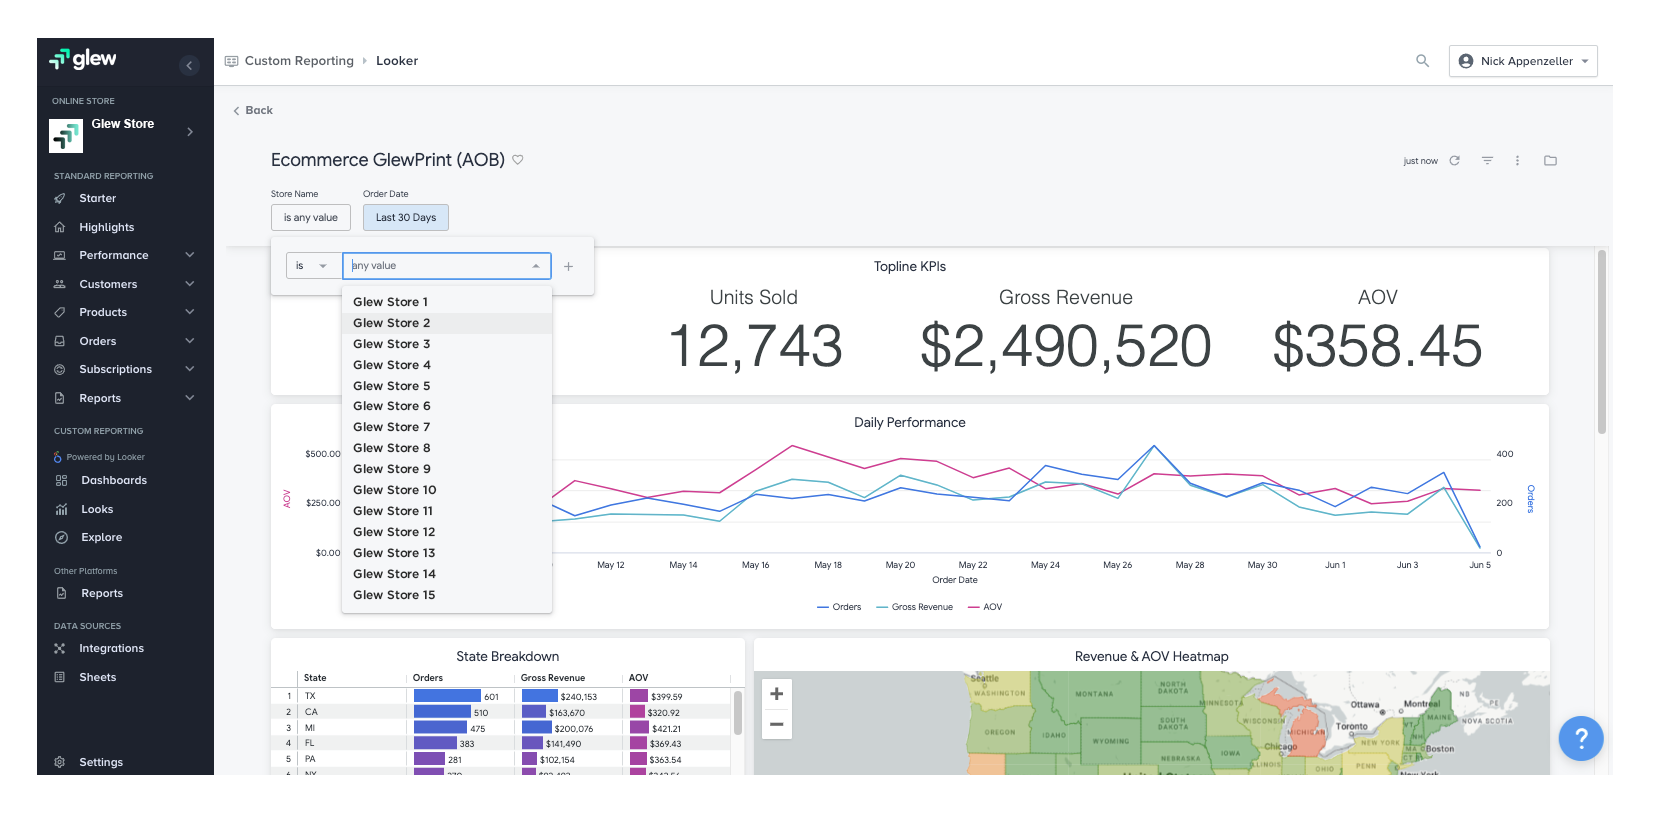
5. Glew
If Whatagraph is built for speed and Peel for retention, Glew sits in the middle ground: a multichannel analytics platform that emphasizes daily visibility, subscription insights, and scalable custom reporting.
Key features:
- Daily snapshot: Wake up to an email with the previous day’s KPIs: sales, orders, revenue, AOV.
- Scheduled reports: Automate delivery of any report daily, weekly, or monthly. Send them to your team or clients, view offline, or keep them in your inbox.
- Subscription analytics: Track MRR, churn, retention, and profitability at a granular level.
- Custom reports + Commerce Data Cloud: Glew’s backbone is its Commerce Data Cloud, which means you can model custom reports or build enterprise-grade analytics applications as you scale.
- Ecommerce dashboards: Out-of-the-box dashboards covering sales performance, marketing performance, customers, and product performance.
For some brands, like GoPure Beauty, Glew has been a “game-changer”—especially for leaders tasked with pulling data from multiple sources into a single BI layer:
“Glew.io has exceeded our expectations in every way.” —Source
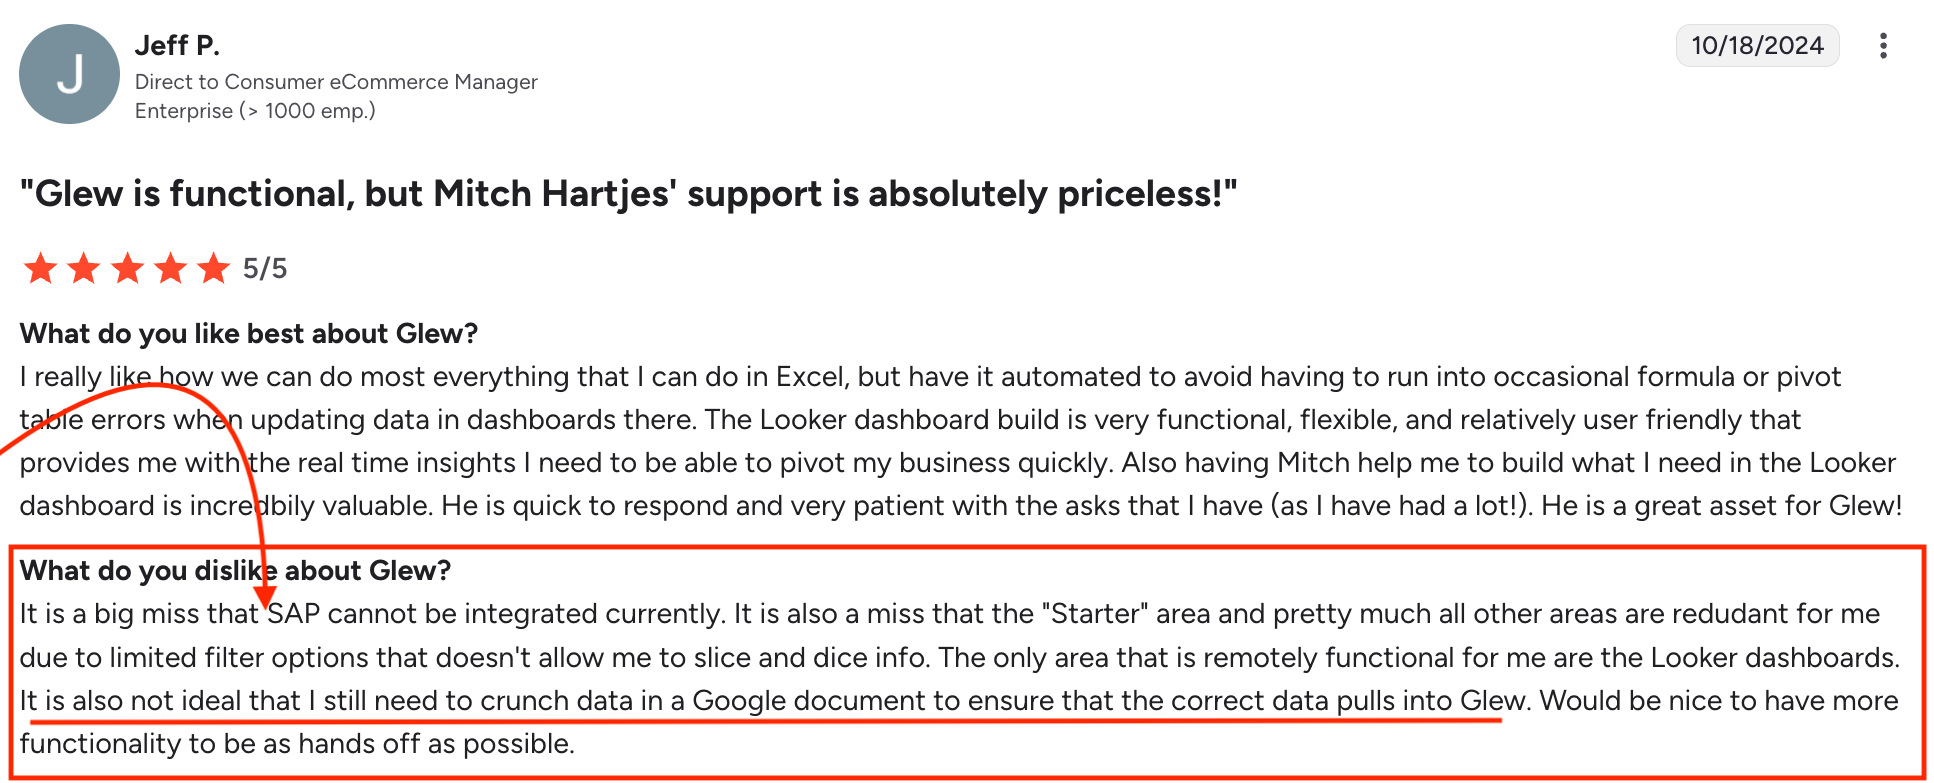
But there are notable detractors. For example, Jeff P., a DTC Ecommerce Manager points out that enterprise integrations are limited (e.g., no SAP), filtering can feel shallow, especially in the “Starter” dashboards, and Looker dashboards feel like the only reliable surface, leaving the rest of the interface underwhelming.
Glew pros:
- Proven value for mid-market brands: Praised publicly by companies like GoPure Beauty for simplifying multi-source reporting.
- Day-to-day cadence: Instead of starting every morning by logging into five dashboards, Glew drops a daily snapshot of yesterday’s KPIs right in your inbox.
Glew cons:
- Enterprise gaps: No SAP integration (a blocker for larger stacks).
- Data accuracy checks: Some users still validate data manually in Google Sheets before trusting the output.
Glew pricing:
Glew doesn’t publish exact pricing on its site. Instead, it outlines two tiers:
- Glew Pro (for teams that want advanced reporting with 250+ KPIs and prebuilt segments); and
- Glew Plus (for teams that need a managed data pipeline, warehouse, and bundled Looker license).
According to G2 user data:
- Average time to implement: 1 month
- Average ROI: 14 months
- Average discount: 8%
- Perceived cost: High ($$$$ out of $$$$$)
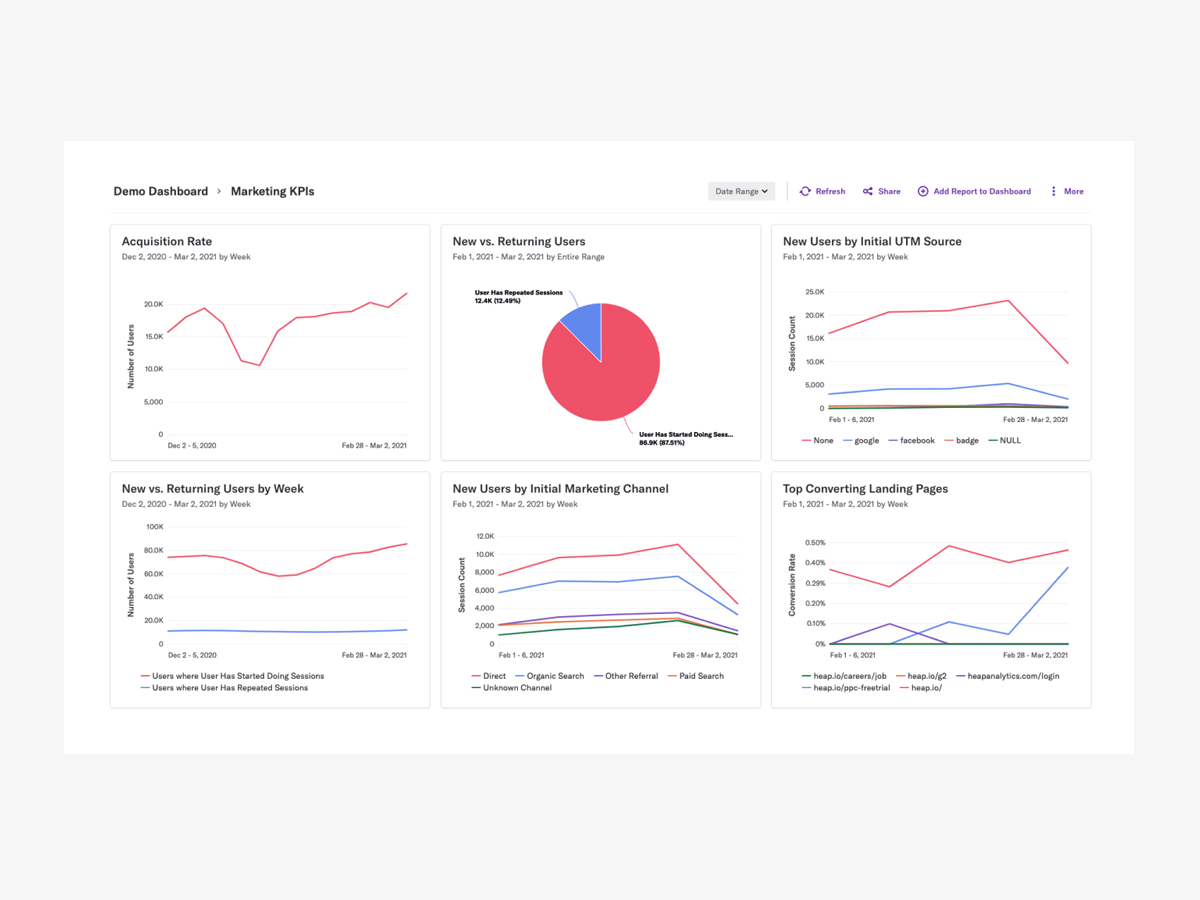
6. Heap
Most tools in this list tell you the output: revenue, ROAS, churn. Heap flips it around. Instead of asking you to predefine every event you want to track, it captures everything by default—clicks, swipes, form fills, drop-offs—straight out of the box.
Key features:
- Automatic capture: A single snippet records the full digital journey across web and mobile. Retroactively query anything without starting from zero.
- Friction alerts: Heap’s data models flag when users are getting stuck, even if you weren’t watching that behavior.
- Session replay: Actually watch what the user did (or didn’t do) and connect the dots.
- Structured data: Everything comes pre-organized, which means you’re spending less time cleaning events.
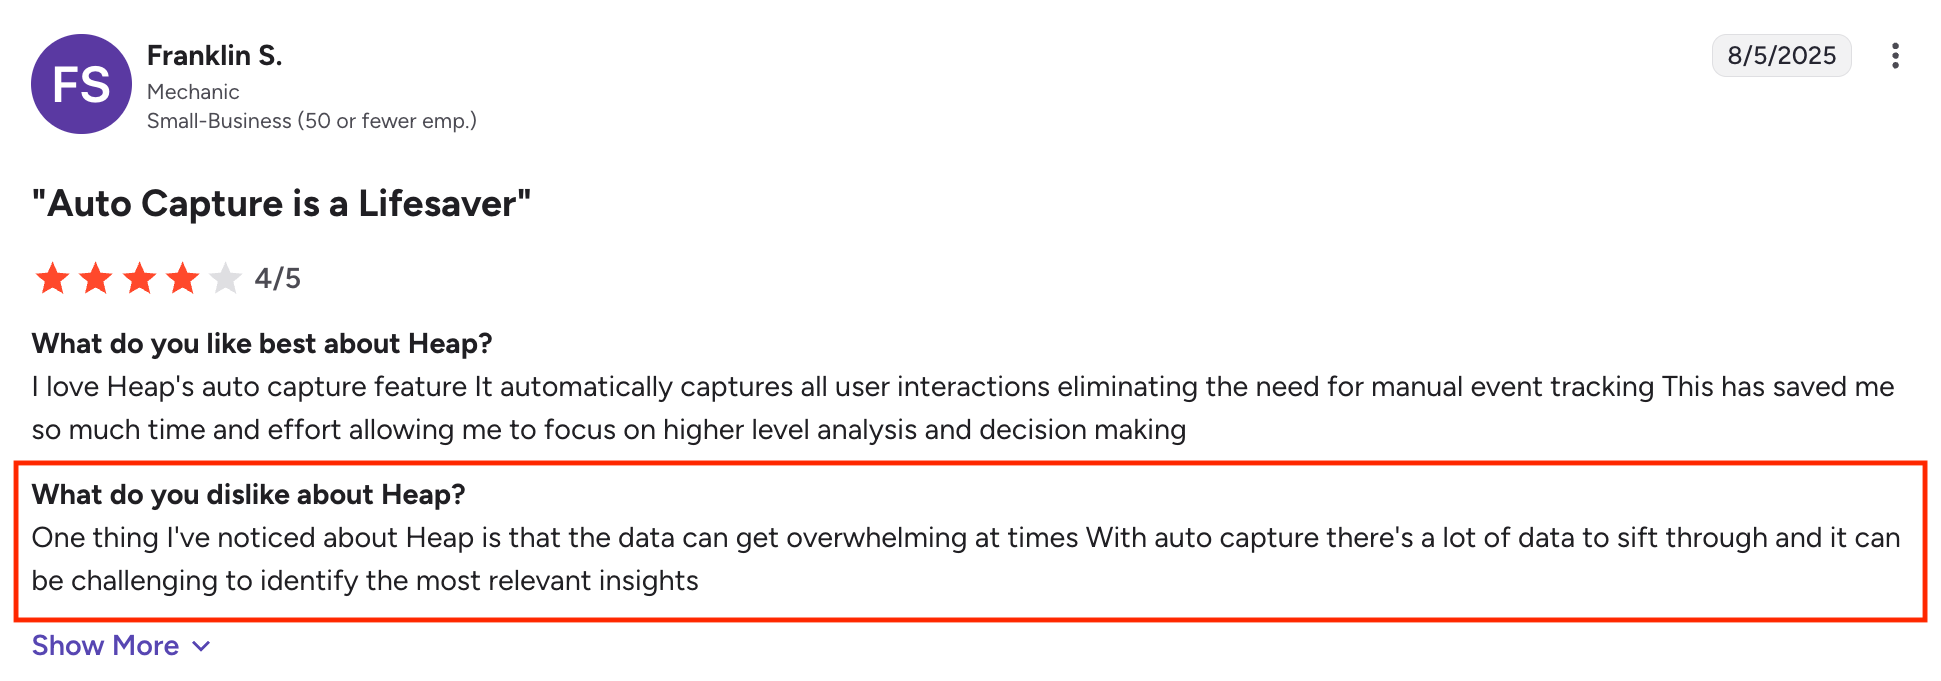
Users consistently highlight auto-capture as Heap’s strongest differentiator. As one reviewer put it, the auto-capture feature has “saved a ton of time” and given them a far more complete picture of user behavior.
But that firehose of data has a downside. Out of five recent reviews in 2025, three mentioned feeling overwhelmed by the volume of events, like this one:
Heap pros:
- Auto-capture saves time: Every interaction is logged automatically, so you’re never starting from scratch.
- Complete behavioral picture: Because nothing slips through, you can go back and retroactively analyze interactions you didn’t think to track.
Heap cons:
- A longer ramp-up time: Teams new to behavioral analytics may find it takes time (and discipline) to turn raw event data into actionable insights.
- Filtering could be stronger: While you get everything captured, drilling down to the insights that matter can feel clunky.
Heap pricing:
Heap doesn’t publish pricing on its website—you’ll need to talk to sales for that. But here’s what we do know:
- Free: Up to 10K monthly sessions. Includes core analytics, unlimited enrichment sources, and 6 months of data history.
- Growth: Adds AI-powered chat (“Sense”), unlimited users/reports, chart customization, CSV exports, and 12 months of data history.
- Pro: Custom session pricing. Includes account analytics, engagement matrix, report alerts, and optional session replay.
- Premier: Custom session pricing. Enterprise-level features like data warehouse integration, behavioral targeting, advanced permissions, dedicated CSM, and regional storage.
According to G2 insights, Heap’s Growth plan pricing starts around $3,600/year.
My Final Take
If you want to experiment (Looker Studio + Supermetrics), if you prefer to DIY at scale (Glew), or if you’re ready to go enterprise-first (Saras Pulse), the tools are there.
If you’re a Shopify brand that needs reports for retention (Peel), or a team that needs to get to the why behind behavior (Heap), those are worth exploring too.
But if your priority is to get set up quickly, generate reports that are white-labeled, client-ready, and instantly shareable—then, as a former thrift store owner—I’d recommend starting with Whatagraph.
Join the businesses and marketing agencies that save 30%–70% of their reporting time every month with Whatagraph. Starting September 2025, the freemium plan means you can test its functionality in your world—without spending a cent.
Published on Aug 29 2022
WRITTEN BY
Brinda GulatiBrinda Gulati is a fractional content marketer and freelance writer who specializes in data-driven storytelling and writing easy-to-understand, informative content for humans. She has two degrees in Creative Writing from the University of Warwick, and believes that above all, stories are a deeply human endeavor. She has two dogs, knows thrifting spots, and loves afternoon naps.