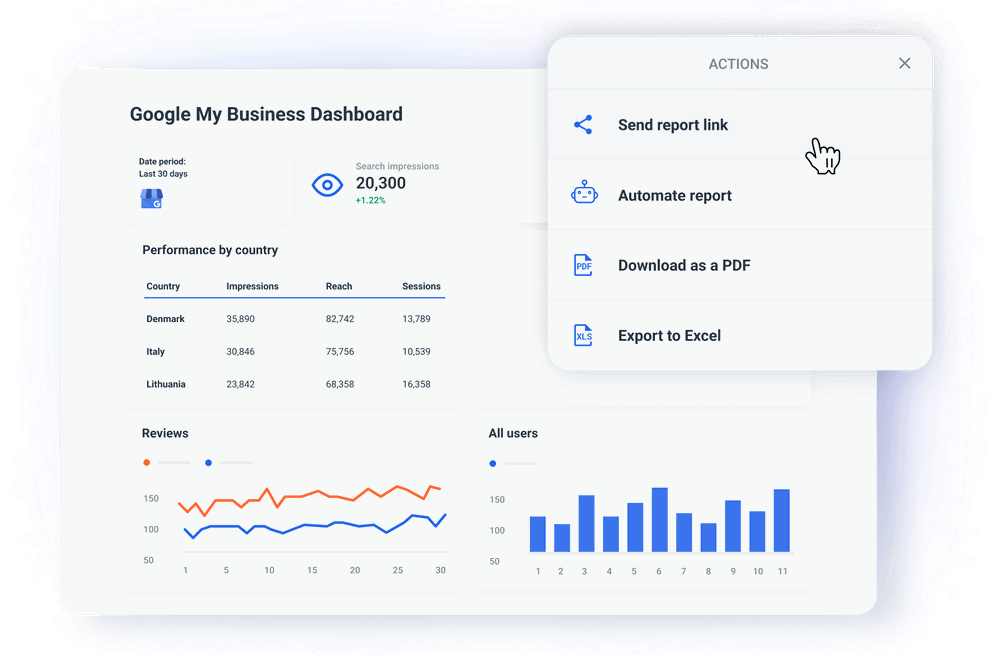
How to Create a White-Labeled GMB Dashboard in 6 Steps?
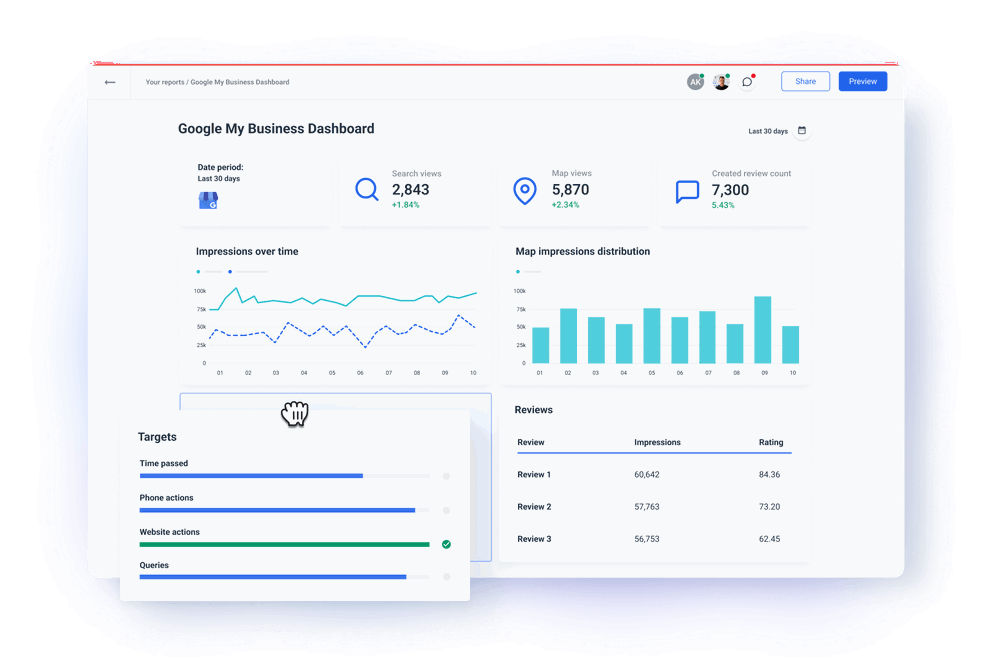
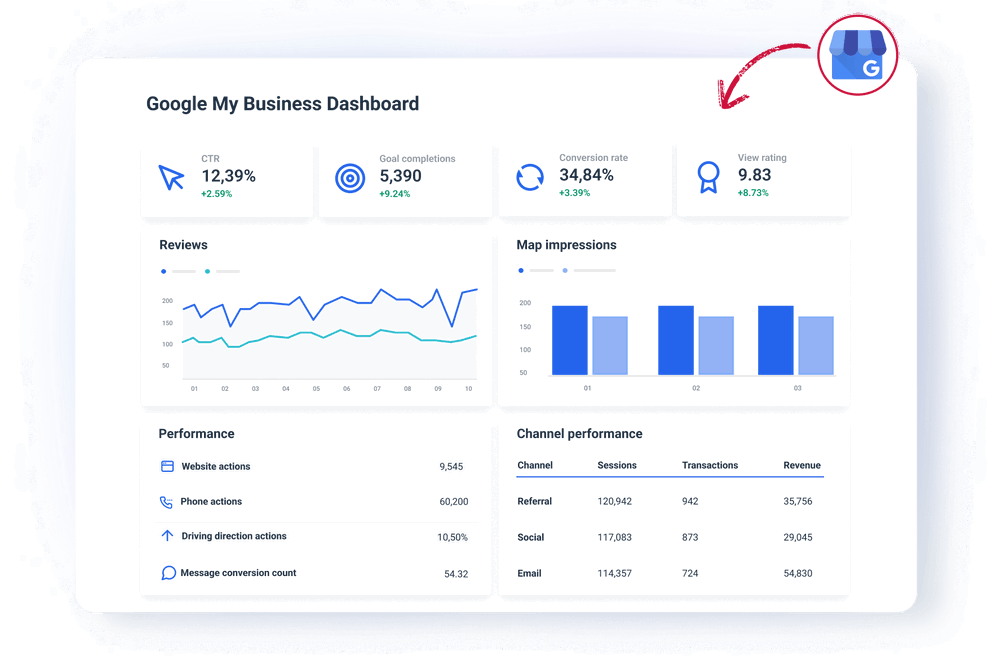
A white-labeled GMB dashboard allows marketing agencies to deliver branded, professional live reports that reflect the agency’s identity while informing clients of their performance on Google My Business.
Here are six simple steps to create a fully customizable white-label GMB dashboard.
1. Choose a dashboard tool that supports white labeling
First, you need to select a reporting platform that allows you to create white-label dashboards. Here are some great options to consider:
- Whatagraph — best overall, group dashboard editing, custom domain, easy to scale
- Looker Studio — free, but full white labeling requires some workarounds
- DashThis — quick and simple customizations but difficult to scale
- AgencyAnalytics — solid white labeling features but no bulk dashboard edits
- Supermetrics — has white labeling options through Looker Studio
We don’t easily give us credits where they are not due, but Whatagraph is hands down the most straightforward dashboard reporting tool you can get.
And we’re not going to talk about how easy it is to connect all data to Whatagraph. Or how quickly you can create any dashboard with drag-and-drop widgets. You know all this already.
But why Whatagraph?
- Customize any dashboard in minutes: Building a custom GMB dashboard doesn’t take hours for every client. Personalizing the existing GMB dashboard template with your or the client’s branding only takes a few minutes.
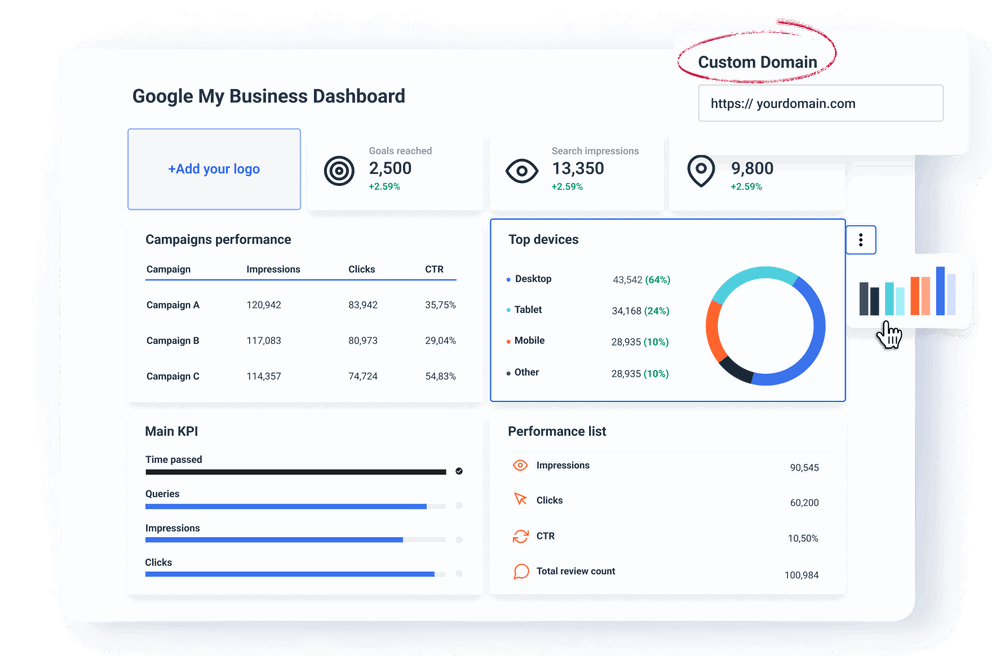
- Remove any mention of Whatagraph: You can easily replace Whatagraph’s branding with your agency’s logo, brand name, colors, and text style. Customize headers and footers.
- Make the dashboard look like your website: When we say colors, we mean true colors. Pick the exact color code from the palette and make every dashboard look like a part of your website.
- Create different visual themes: You have a big corporate client you want to impress? Personalize the dashboard with their branding and colors to show the extra steps you are ready to take as an agency. Choose a global visual theme for your agency and create multiple themes for different dashboards or even widgets.
- Share dashboards on a custom domain: Use a custom domain that includes your agency name to host each dashboard. Clients won’t see “whatagraph” mentioned anywhere and think you built the whole thing yourself.
- Custom email address: If your client prefers PDF reports, send them scheduled reports from a custom email address and using a custom subject line.
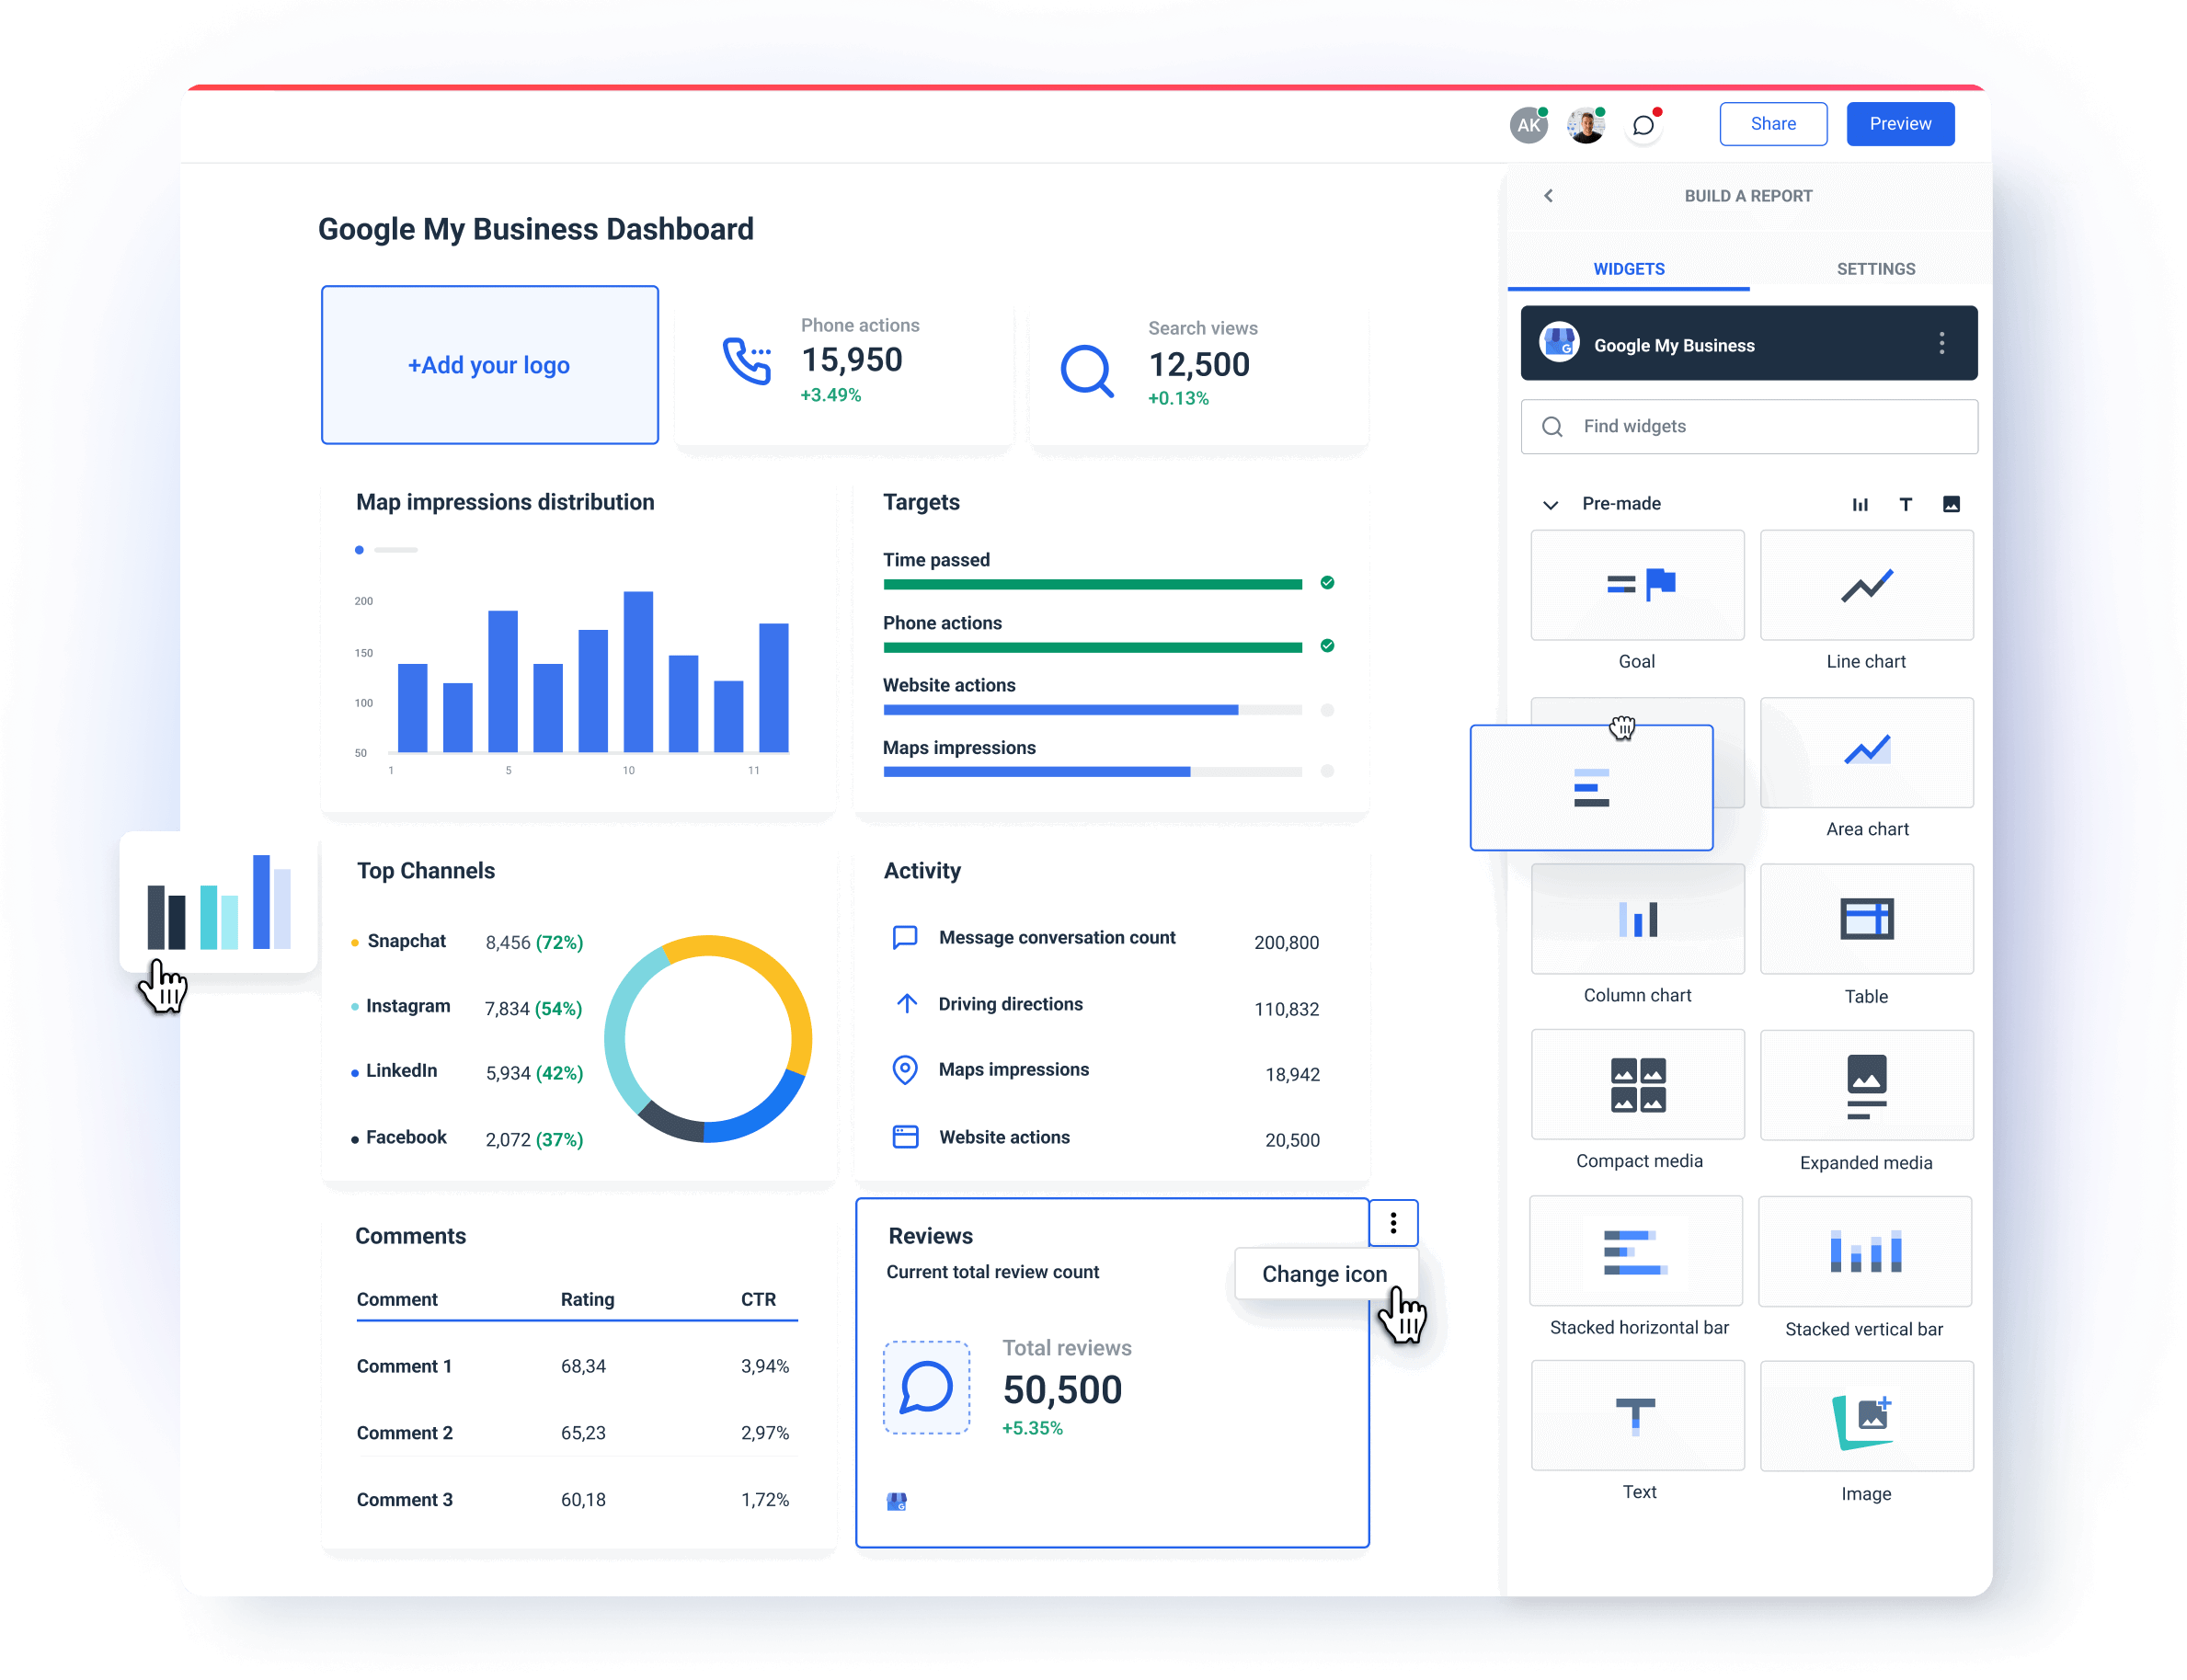
Now you’re ready to personalize your dashboard. Here are some of the best white label practices from agencies.
2. Customize your GMB dashboard — best practices
The goal of creating white-labeled dashboards is to show the professionalism of your agency and meet the unique needs of your clients. Here are some of the best practices:
- Customize branding elements: Start with replacing the dashboard provider’s logo with yours or your client’s one. Use the brand colors throughout the dashboard. Whatagraph even allows you to customize the color of chart fields.
- Use consistent fonts: Match the fonts to your agency’s (or your client’s) brand style guide to maintain a consistent and polished look.
- Create branded templates: With Whatagraph, you can save almost anything you create as a custom template. Prepare standardized templates for each client that keep the same layout, branding, and structure.
- Tailor metrics to client goals: What works for one client may not work for another. In Whatagraph, you can highlight specific metrics that matter most to your client.
For a local business, this might include GMB search impressions, phone calls, and reviews. An eCommerce client might first want to see conversion rates and average order values, etc.
- Simplify data display: Clients appreciate clear, easy-to-understand visuals. Avoid overwhelming them with unnecessary metrics or complex data.
Drew Cove, Senior SEO Manager from DigitalParc, strongly believes in speaking to clients in terms they can understand.
“A lot of time it’s the CEO or president that is also the sales manager or the lead tech person. We’re pretty well accustomed to working with that kind of clients and the biggest thing about that is speaking to them in terms of what they know. Many times, early in campaigns, it’s usually me learning the communication style and marketing expertise that person has. What does this person know? How can I explain to them something they don’t know?”
We can’t agree more with Drew. That is why Whatagraph dashboards are so easy to tailor to the needs of different clients.
If you can show real progress right away and explain it in familiar terms, your clients will consider you more of a partner than a service provider.
3. Provide actionable insights
No client wants to see just raw data. They can easily export that from their Google My Business Profile (GBP). They need to understand what that data means for their business.
Include:
- Contextual insights: Whatagraph’s text widget makes it very easy to add annotations or summaries right next to a graph or table, so you can explain to your client what is happening there and why.
- Recommendations: Where appropriate, offer actionable insights or next steps based on data. For example, if GMB views are down, suggest optimizing the listing with new images or posts.
With comments and recommendations, your dashboard turns into a valuable decision-making tool.
4. Make the dashboard user-friendly
No matter how fresh or impactful the data, clients won't use it if the dashboard is difficult to understand.
We often hear this from agencies who are switching from our competitors to us — clients don’t read their reports.
Luckily, Whatagraph has everything you need to avoid that and build a dashboard to the highest UX standard:
- Clear navigation: Organize metrics logically and use simple menus or tabs to separate different sections, such as the executive summary, traffic, acquisition, SEO, etc.
- Data visualization: Our charts, graphs, and value widgets present complex data in a simple way. Your clients can hover over specific fields to uncover more info.
- Mobile-friendly design: Make sure your dashboard looks good and works well on mobile phones. Many clients may check reports on the go, so the mobile experience should be just as effective as the desktop version.
If clients can use the presented data more easily, they are more likely to appreciate the value your agency delivers.
5. Add more sources to your dashboard
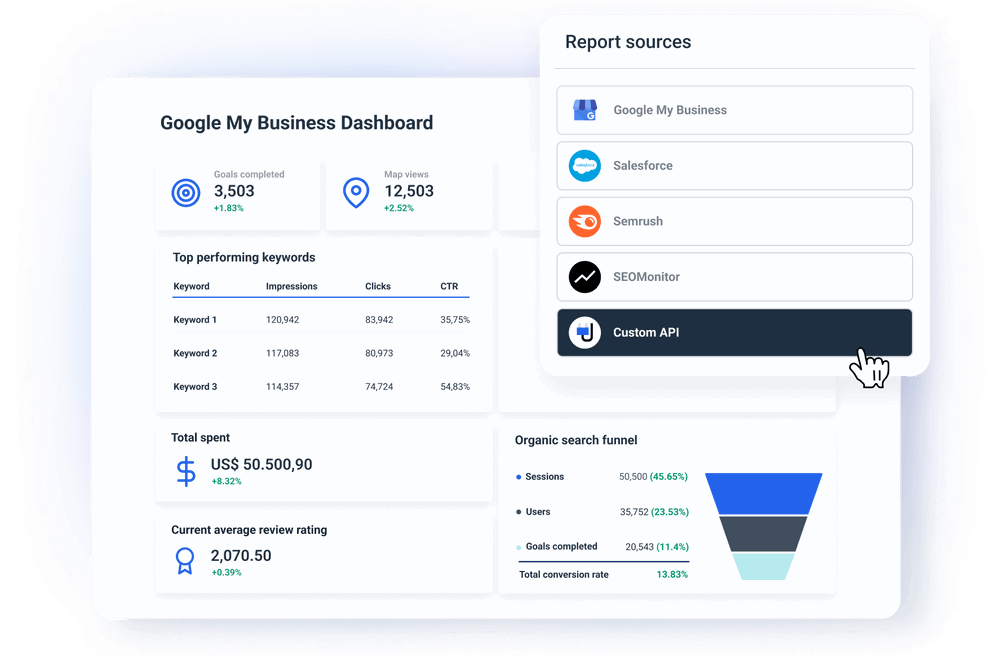
Integrate your dashboard with more digital marketing sources to show clients the big picture of their performance. Combine the GMB data with:
- Google Analytics and social media platforms: This way you can track local SEO together with website traffic and engagement from organic and social media.
- PPC apps: For clients running campaigns on several channels, include performance data from Google Ads, Facebook Ads, etc.
- CRM or sales data: So the clients can track the direct impact of your marketing efforts on their business.
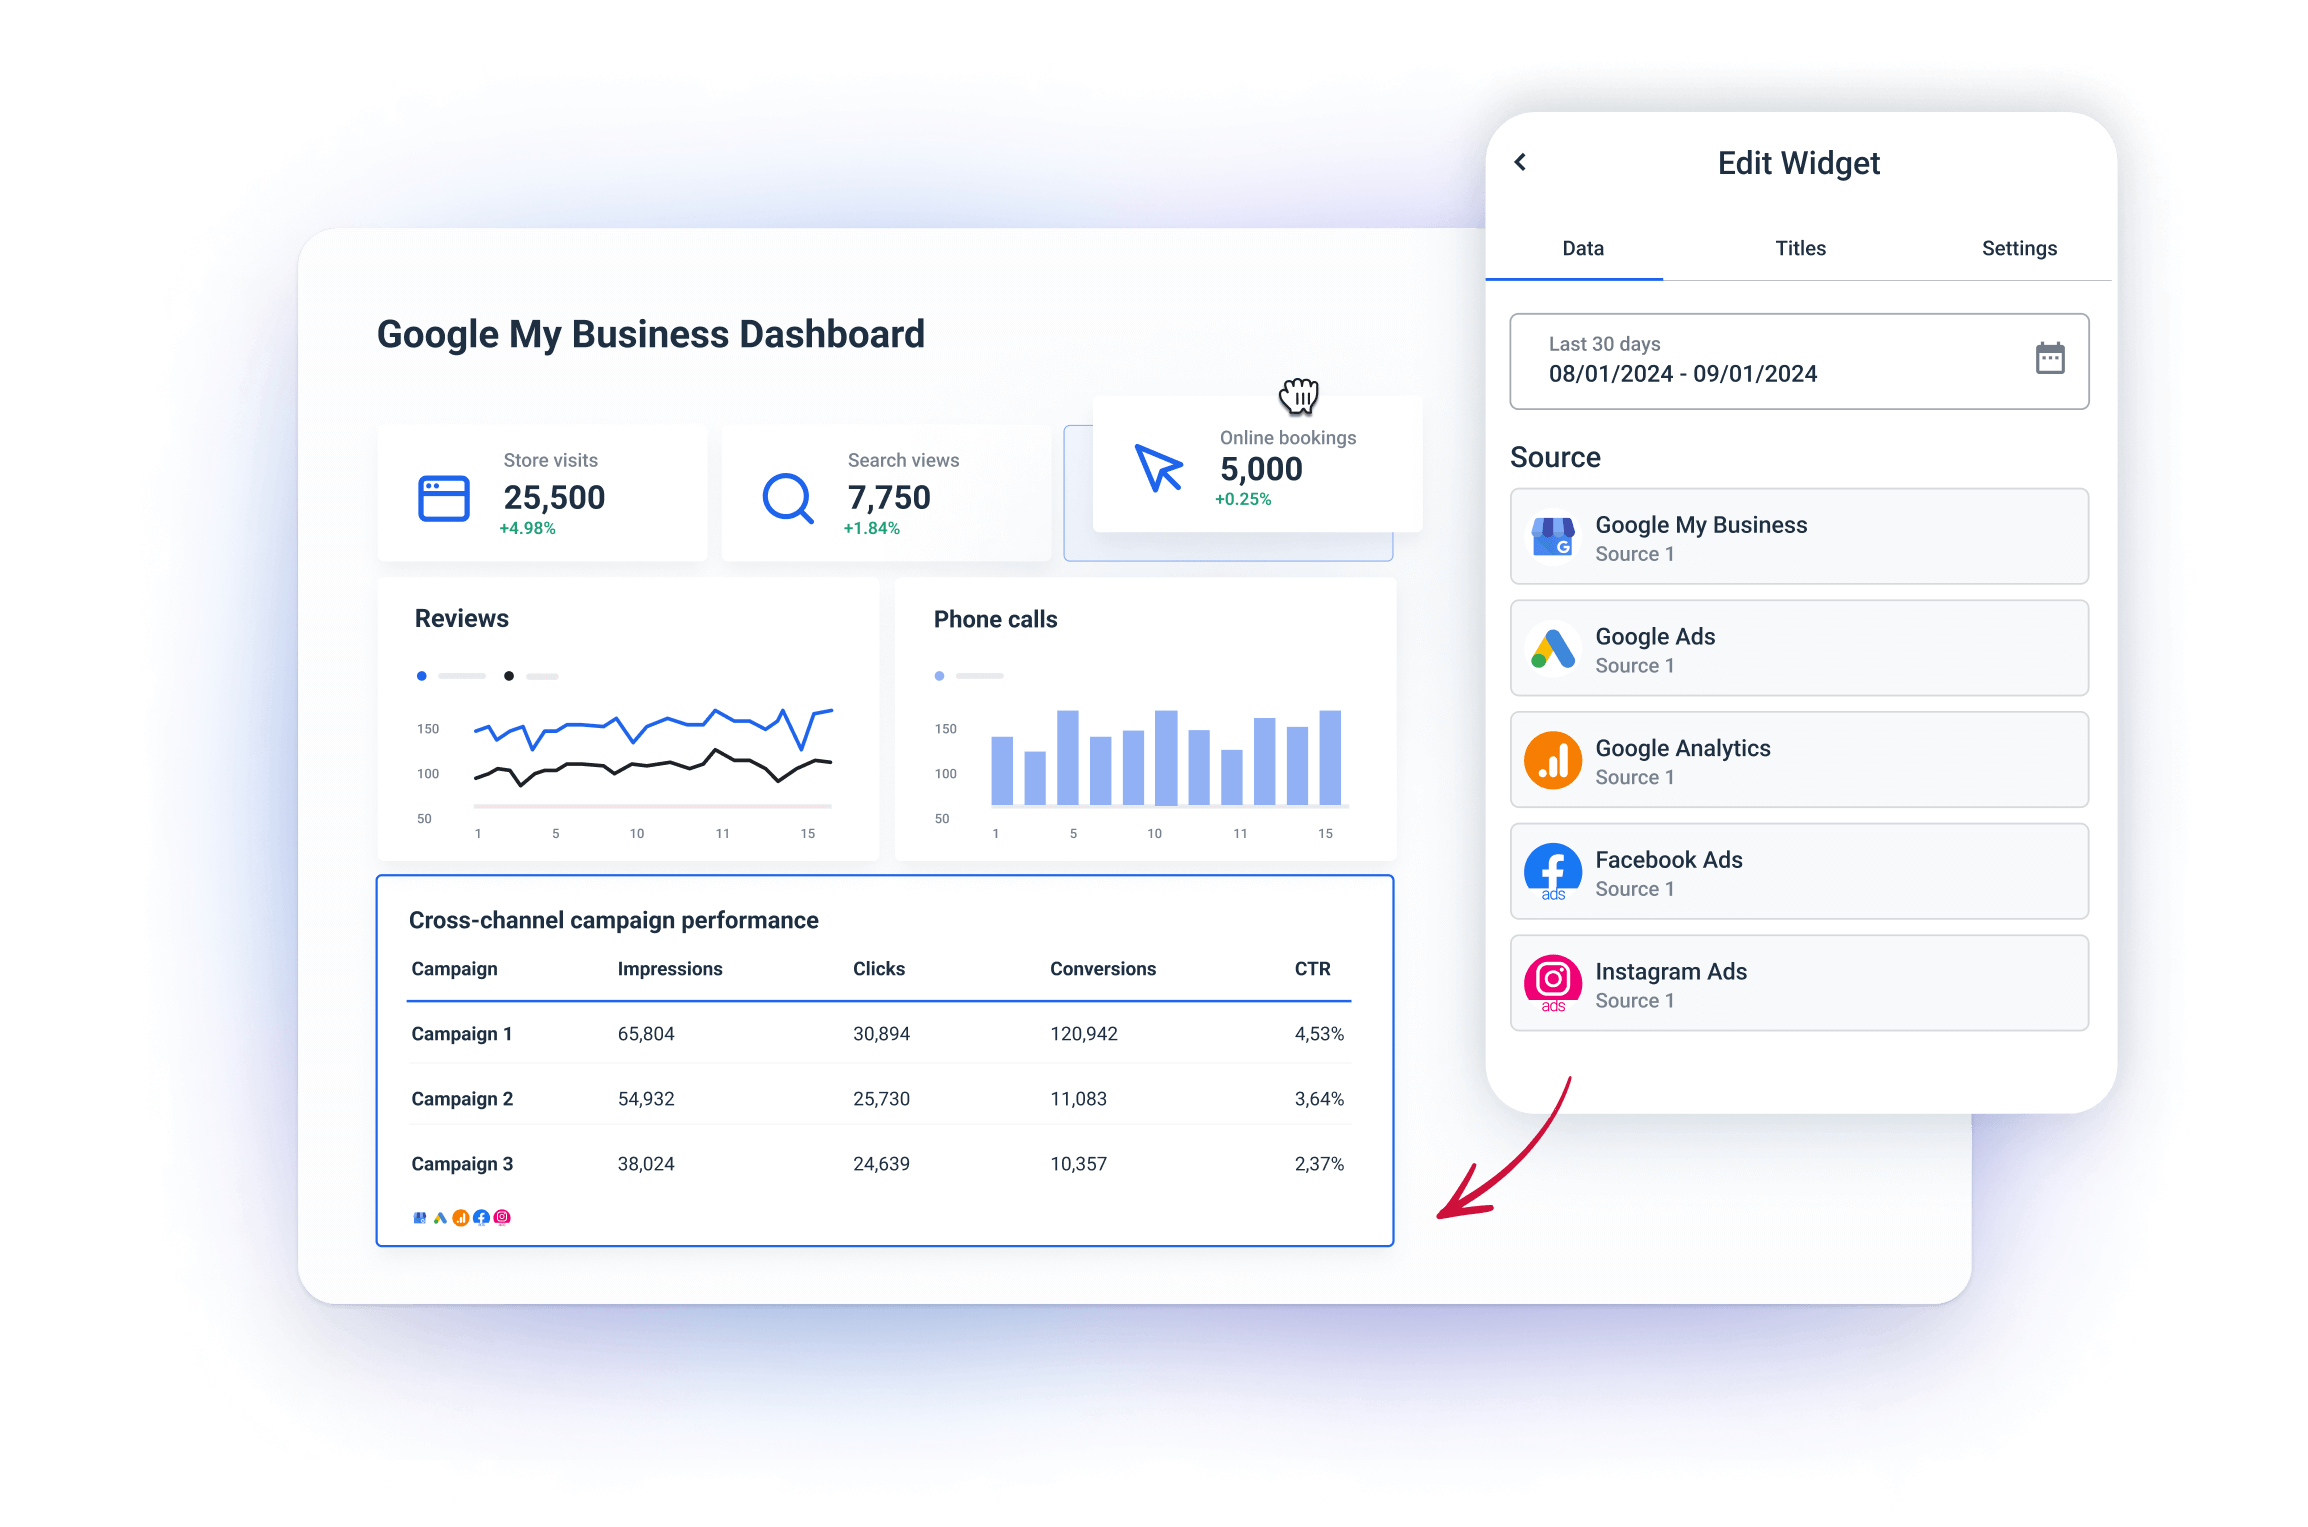
A cross-channel dashboard provides a bird' s-eye view of performance. This allows clients to see how different channels contribute to overall business goals.
6. Regularly update and maintain dashboards
Make sure to update the dashboards with the latest features and insights, as this shows the client that you're keeping pace with the latest trends and developments.
- Add new metrics as client needs evolve: If your client starts a new marketing campaign or focuses on a new goal, update their dashboard to reflect these changes.
- Keep the data accurate: The integrations and data sources should work correctly and deliver accurate results. (You won’t have this issue with Whatagraph)
- Ask for feedback: Client feedback helps you never lose their needs out of sight. Ask about what they want to see added or changed in the dashboard.
Regular dashboard updates show your client that you are proactive about providing the best possible reporting experience.
How Should You Structure Your GMB Dashboard?
A well-structured dashboard helps clients see the value of your services and track the effectiveness of their GMB listings. Here's how to structure a client-friendly GMB dashboard:
1. Key performance indicators overview
Start with a high-level overview of the most important KPIs related to GMB performance. This section should provide a snapshot of how well the client’s business is performing in local search. Include:
- Search Impressions: The number of times the business listing appeared in Google search results.
- Maps impressions: The number of times a business listing appears in Google Maps search results.
- Current Average Review Rating: The average star rating for the business.
- Current Total Review Count: The number of customer reviews for the selected period.
This section provides clients with a quick executive summary of their GMB performance. It helps them understand the overall effectiveness of their local SEO at a glance.
2. Customer actions and goals
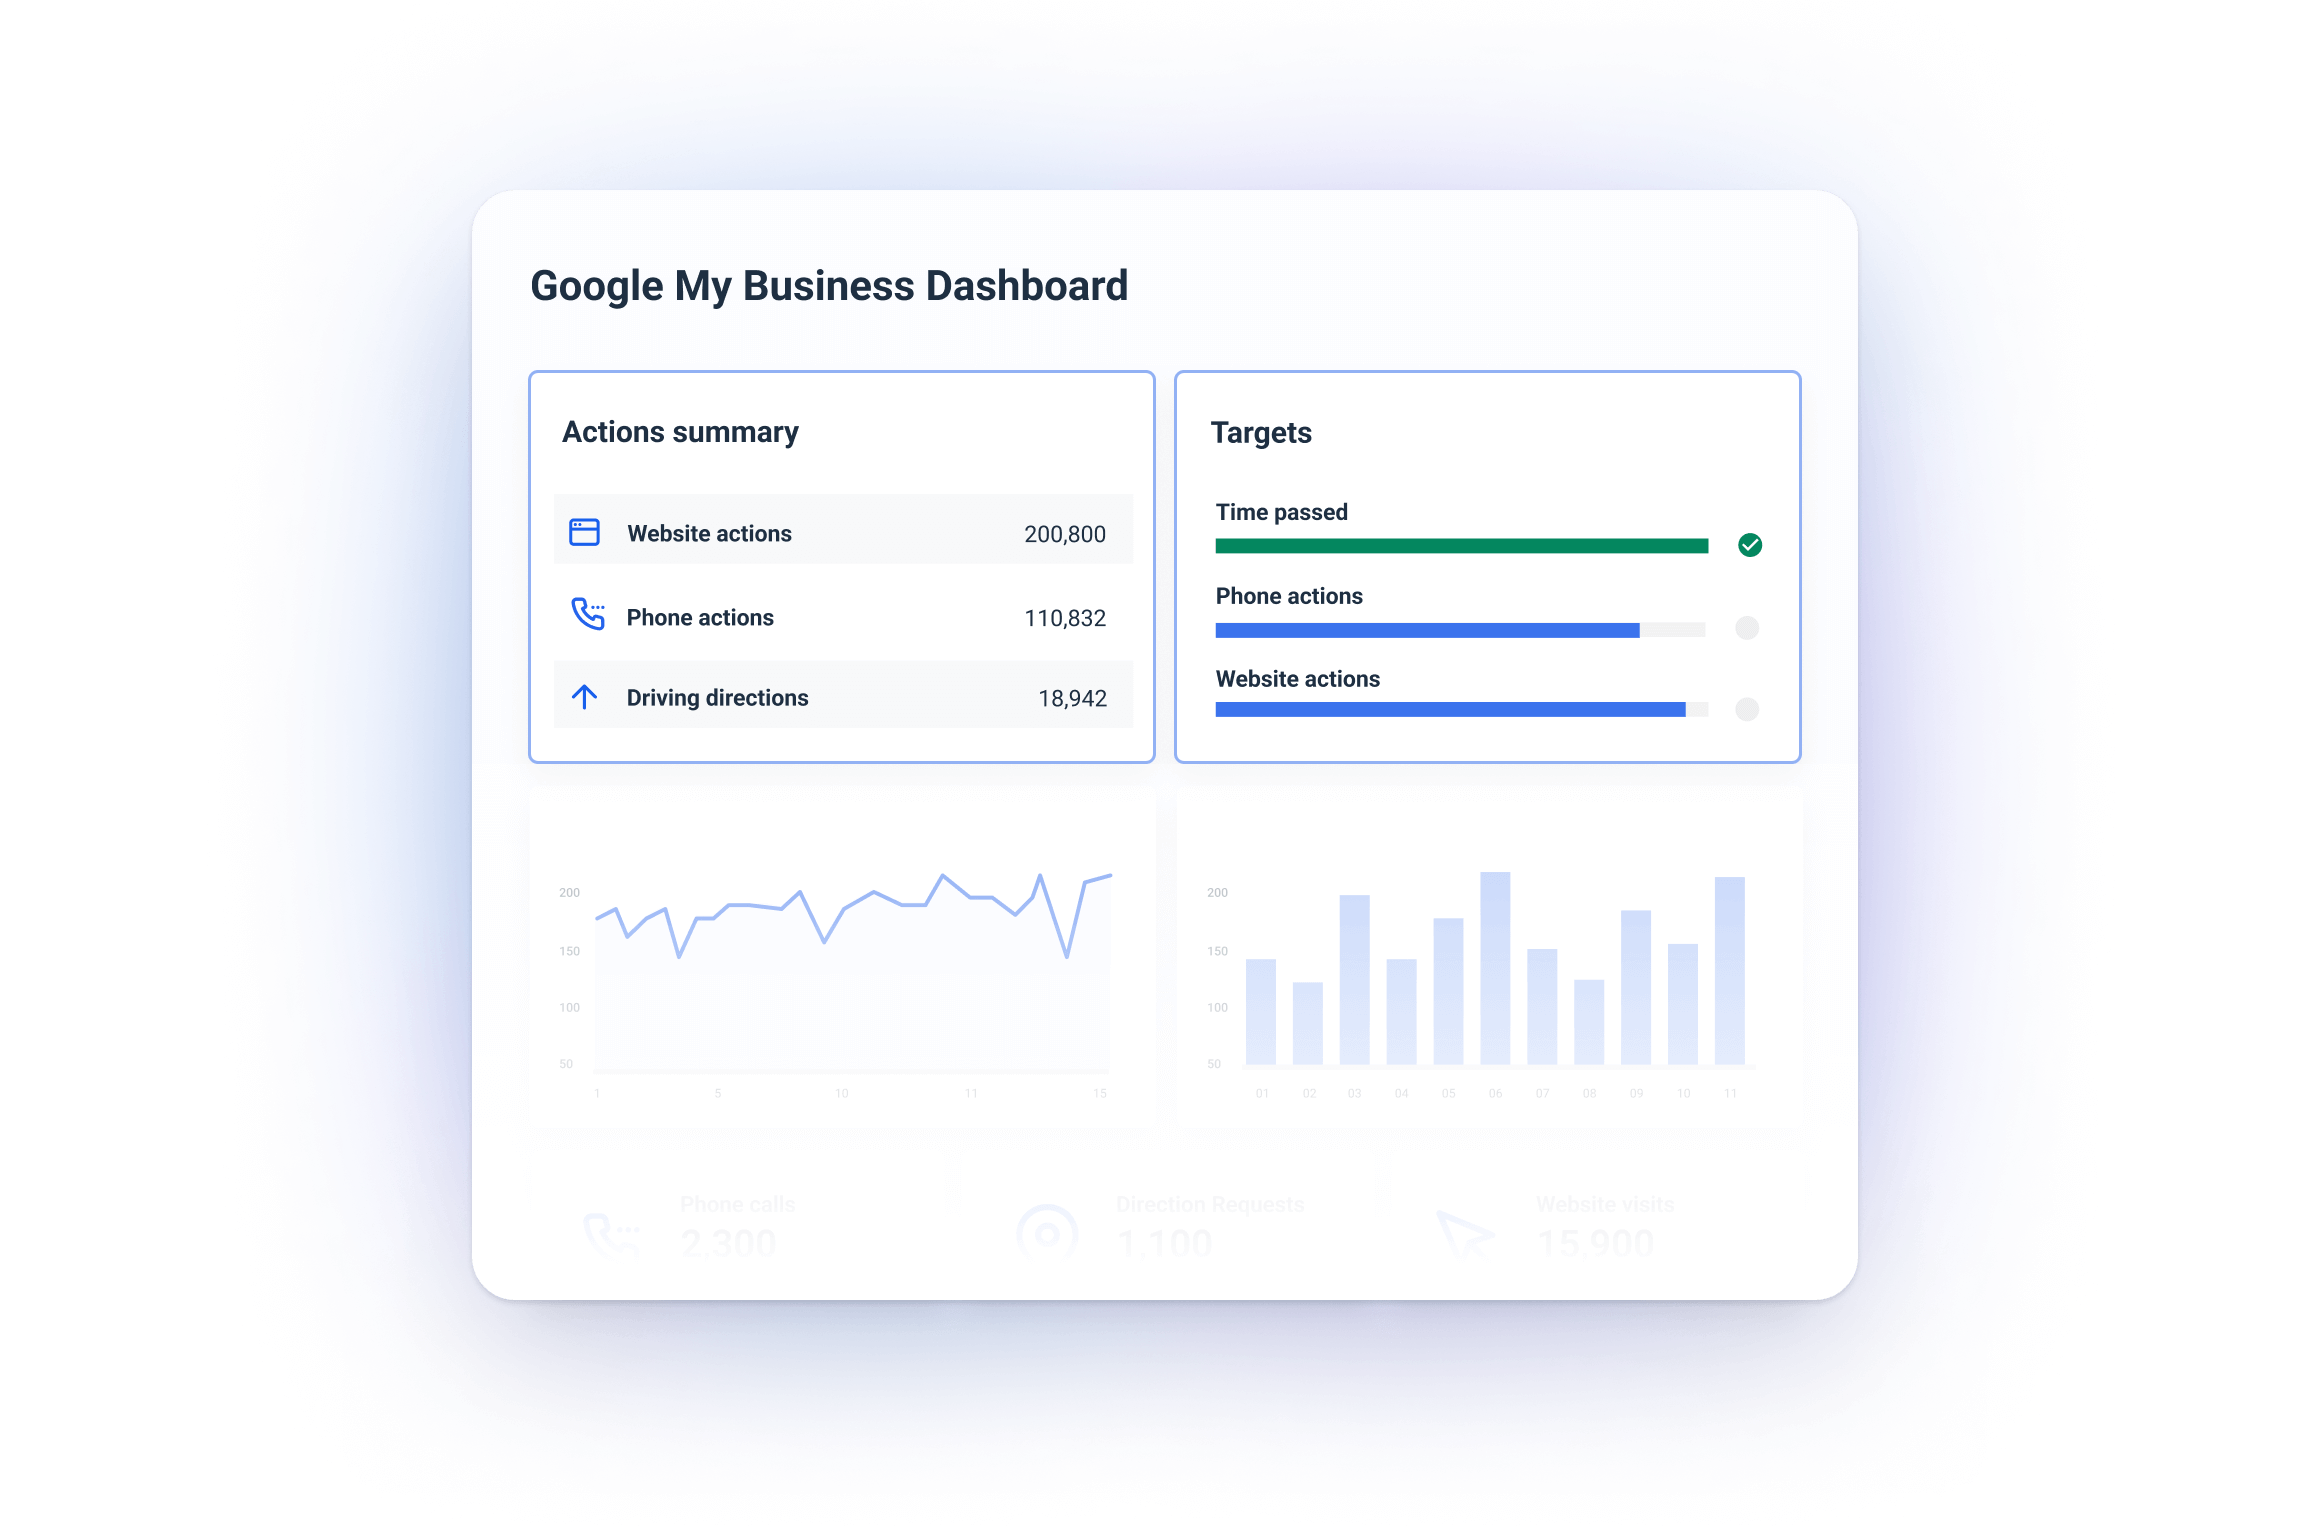
In this section, provide a breakdown of customer actions taken from the GMB listing. Include the following metrics:
- Website Actions: The number of clicks from the GMB listing to the client’s website.
- Phone Actions: How many users called the business directly from the listing.
- Driving Direction Requests: The number of times users requested directions to the business.
This is also a good place to use Whatagraph’s goals widget. It shows the completion of the goals you agree with your client for added transparency and accountability.
3. Customer reviews and ratings
Reviews are one of the most important parts of GMB performance. This section should highlight:
- Review Count: Total number of reviews the business has received.
- Average Rating: The overall star rating of the business.
- Recent Reviews: Include a snapshot of the most recent reviews with customer feedback.
- Review Sentiment Analysis (optional): If possible, provide an overview of the overall sentiment (positive, neutral, or negative) of the reviews.
Clients need to know what customers are saying about their business. Positive reviews boost credibility, while negative reviews need to be addressed to improve customer experience and local SEO.
Best Practices on Sharing White-Labeled GMB Dashboard with Clients
Busy clients don’t want to wait for reports or manually log into the platform to see their performance. That’s why your white-labeled dashboard should include:
- Automated data refreshing: Whatagraph dashboards auto-update with the latest data in near-real time, so your client’s can always have fresh insights. This saves your team time as it reduces the number of client requests.
- On-demand insights: Make sure the clients can check their numbers at any time, 24/7 from any device, without waiting for a report or email from you.
- Secure access: Give each client private password-protected access to their dashboard to improve data security and confidentiality.
