BigQuery Integration

Expand your data management abilities beyond the current Whatagraph integrations. Connect, organize, visualize, and share insights from any marketing data source via a fully managed Google BigQuery integration. Effortlessly connect your BigQuery account and use it as a source in all reports and dashboards. Discover insights in large data sets while keeping your historical data safe from deprecation.
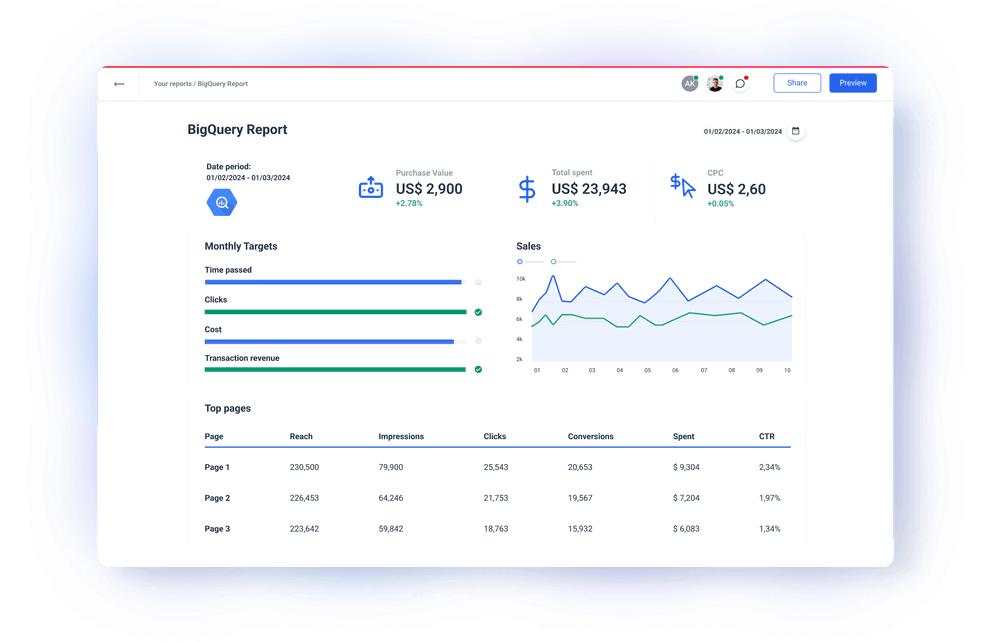
Google BigQuery Reports in a Few Clicks
58K+
reports built monthly
45+
native integrations
2000+
pre-made widgets
Trusted by 1,000+ marketing agencies and brands around the world
Lactogal - Logo with stylized leaf-like graphic to the left of the brand name.
Wise Pirates - A gray W-shaped design and a small gray circle on a black background.
Ticketmaster - The Ticketmaster logo.
Seo Sherpa - A logo displaying mountain graphic and text "seo sherpa"
Property Guru - Image completely black.
Awestruck Logo - The word "AWESTRUCK" in a bold, dark-colored sans-serif font on a black background.
Brand Logo 7
Rentable - The Rentable logo featuring a house inside of a square to the left of the company's name.
Brand Logo 9
Brand Logo 10
Brand Logo 11
Lekker Bikes - Logo featuring a stylized tulip and the word "Lekker" in outlined letters.

A direct no-code data connection to BigQuery API

Icon for Connect
Connect
Connect to your sources with a stable, native integration that doesn't break. No extra connectors or set up needed.
Icon for Organize
Organize
Manage and transform your data without a single line of code. Ask AI to create custom blends, metrics, and dimensions.
Icon for Visualize
Visualize
Ask AI to create stunning reports from your cross-channel data in seconds. Customize reports instantly from just a screenshot or a prompt.
Icon for Share and automate
Share and automate
Share a link to live report with interactive data and date range picking. Schedule report send out customizing emails and notifications to review.

Bring your data from anywhere to Whatagraph via a fully managed BigQuery Connector
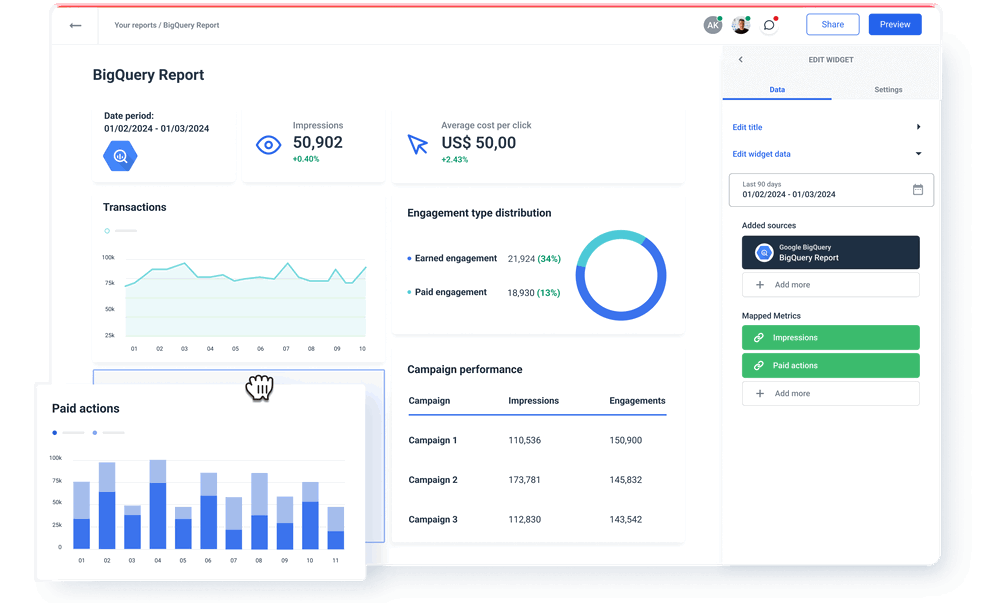
Stay one step ahead of the volume and complexity of your marketing data. Organize and visualize the essential metrics from all your sources in Whatagraph while leveraging the versatile connectivity of the Google Cloud Platform. Creating a lot of client reports on Google Analytics 4, Google Ads, and Google Search Console. Overcome any API quota limits imposed by Google by moving the data to BigQuery via our no-code Data Transfer and use the codeless connection to BigQuery API to visualize the data in any Whatagraph report. Our BigQuery integration can process large amounts of data quickly, enabling marketing agencies to perform complex data analysis in real-time.
Google BigQuery Report

Explore marketing automation and custom report features

Icon for Linked reports
Linked reports
Create team templates and connect as many reports as needed. Never again manually edit hundreds of similar reports one by one.
Icon for Overview reports
Overview reports
Monitor your overall performance across regions or accounts and find new opportunities for growth.
Icon for Data blending
Data blending
Combine metrics from multiple data sources in a widget or table to track cross-channel campaigns in one place.
Icon for Custom branding
Custom branding
Implement custom color themes and logos. Remove all mentions of Whatagraph and connect your custom domain.

Frequently Asked Questions

All your questions answered. And if you can’t find it here, chat to our friendly team.

What is Google BigQuery for marketers?

BigQuery is Google's fully managed, NoOps, low cost analytics database. With BigQuery you can query terabytes and terabytes of data without having any infrastructure to manage or needing a database administrator. BigQuery uses SQL and can take advantage of the pay-as-you-go model.


Marketers can use BigQuery as a painless way to connect any data they have to a marketing data platform. Whatagraph allows you to connect BigQuery source to any report or dashboard you create.

How do I create a report with BigQuery data?

Creating reports with BigQuery source data is simple if you use Whatagraph. 


1. Just as with any other integration, connect your account. 


2. The standard data source menu will appear where you need to select the data set.


3. Click Connect in the upper right corner.


4. Go to the report menu and click +New Report.


5. Select the connected datasets as sources and drag and drop the visualizations you need.


6. Select the report type, dimensions, and metrics for each widget you use.


7. Once you’re happy with your report, share a link or automate sending via scheduled emails.


Thanks to the pre-built BigQuery connector, once you add your account, there’s nothing to manage, update, or re-set. Every time you add a BigQuery dataset as a source to your reports, the data flows in automatically.  

Is BigQuery free?

BigQuery pricing is based on compute (analysis), storage, additional services, and data ingestion and extraction. Loading and exporting data are free. The BigQuery free tier gives customers 10 GiB storage, up to 1 TiB queries free per month, and other resources.