BigQuery Dashboard

Are you fed up with writing the same queries day after day? With Whatagraph, you can quickly build a powerful Google BigQuery dashboard that updates automatically. Effortlessly connect your BigQuery account to visualize and share insights from any marketing data source you have. Discover insights in large data sets while keeping your historical data safe from deprecation. Share the insights with clients or stakeholders in a few clicks and save hours on manual reporting.

BigQuery Dashboard for Marketers
You are in good company with 1,000+ marketing agencies and in-house teams worldwide
mc cann logo
Whatagraph image
Whatagraph image
Whatagraph image
Ogilvy logo
House dentsu logo
havas logo
n365 logo

Pre-built BigQuery dashboard to visualize any stored marketing data

Connect data from BigQuery and 45+ other platforms

Pull data directly from your connected warehouse and present it alongside KPIs from other platforms you are using, such as Google Analytics, Google Search Console, HubSpot, LinkedIn, or any other source inside or outside the GCP. By visualizing multi-source data in this dashboard, you can transform the most important KPIs into actionable insights you can use to make data-driven decisions.

SVG image
Connect data from BigQuery and 45+ other platforms

Build a dashboard using custom visualizations

In Whatagraph, you don’t need to run queries for the data you want to visualize. Just drag and drop the charts, tables, and other widgets you want to use. You can also enable filters or change metrics and dimensions for each widget. Organize data directly in your BigQuery dashboard to uncover deeper insights. Use our custom formulas to create calculations, aggregate data, or blend multiple data sources to create your custom data visualizations.

SVG image
Build a dashboard using custom visualizations

Automate BigQuery visualization sharing

Instead of gathering and sending over data whenever your clients request it, share a link to a live BigQuery dashboard that updates automatically in near real-time. Viewers can interact with the dashboard by changing the date ranges to explore the data, seeing more info by hovering over the widgets, and, if needed, securing it with a password.

SVG image
Automate BigQuery visualization sharing

All dashboard features your agency needs

50+ data sources

Create a true cross-channel digital marketing dashboard in Whatagraph. Over 50 integrations for your cross-channel marketing campaigns.

Cross-channel insights

Include data from different sources into the same widgets or dashboards with a few clicks. Provide a full picture of your campaigns’ success.

Live dashboards

Securely share interactive access to your dashboard at any time from anywhere.

White-label dashboards

Customize colors and logos in each dashboard to align it with your agency’s or clients’ branding and style.

It’s good to be loved! Our clients are not shy about expressing it.

I made a switch from GDS and Sheets for reporting to Whatagraph, and I am saving literal hours each week on performance report creation. Our small firm actually managed to onboard 2 new clients as a result of all the time we saved on managing data and reporting. The customer service is also really helpful and easy to reach.

Mindaugas S., Marketing Consultant Capterra logo for Whatagraph review

Capterra verified review by

Mindaugas S., Marketing Consultant

Having active customer support to help fix any issues was a big contributor, but we also really liked the ability to save templates and connect sources to multiple charts/widgets at once without having to edit them individually. And having the grid layout is much easier to stay consistent with than the free form setup that Data Studio has.

Nico T., Media Planner Capterra logo for Whatagraph review

Capterra verified review by

Nico T., Media Planner

The system has standard templates that are easy and fast to use. Also you can build your own report with lightning speed. It is very easy to use, has a lot of integration, and let get started very fast.

Rasmus Bernt K., External Senior Management Consultant Capterra logo for Whatagraph review

Capterra verified review by

Rasmus Bernt K., External Senior Management Consultant

We love Whatagraph - we would definitely recommend and our account manager is great! I love how easy this tool is to use, everyone on the team finds it much more user-friendly than other dashboards. Integration was easy, we sent some example reports to the team who duplicated these for us. We literally had to log in and send it to our clients!

Stephanie S., Digital Director Capterra logo for Whatagraph review

Capterra verified review by

Stephanie S., Digital Director

We are showing our clients the work that we're doing for them and this is incredibly important for our clients ROI. They want to see results and having a tool like Whatagraph that can show data from virtually every source we use is hugely important.

John S., SEO Strategist Capterra logo for Whatagraph review

Capterra verified review by

John S., SEO Strategist

The tool is easy to use; you do not need to have development resources. Even my junior project managers are capable of making campaign reports in minutes. There are a lot of pre-made templates you can use as well as many pre-made widgets.

Erman E., Marketing Specialist Capterra logo for Whatagraph review

Capterra verified review by

Erman E., Marketing Specialist

Really easy to connect data sources within the tool. The library of report templates has been helpful. The customer support team has been responsive to all of our needs. Our team enjoys the simplicity of setting up the reports and how the data is presented.

Brent N., Director of Operations Capterra logo for Whatagraph review

Capterra verified review by

Brent N., Director of Operations

Easy to create really beautiful graphs and reports which can help other team members to understand the most important takeaways. I especially like the automated report function, so I don't have to check on the same thing repeatedly.

Orsolya S., Online Marketing Manager Capterra logo for Whatagraph review

Capterra verified review by

Orsolya S., Online Marketing Manager

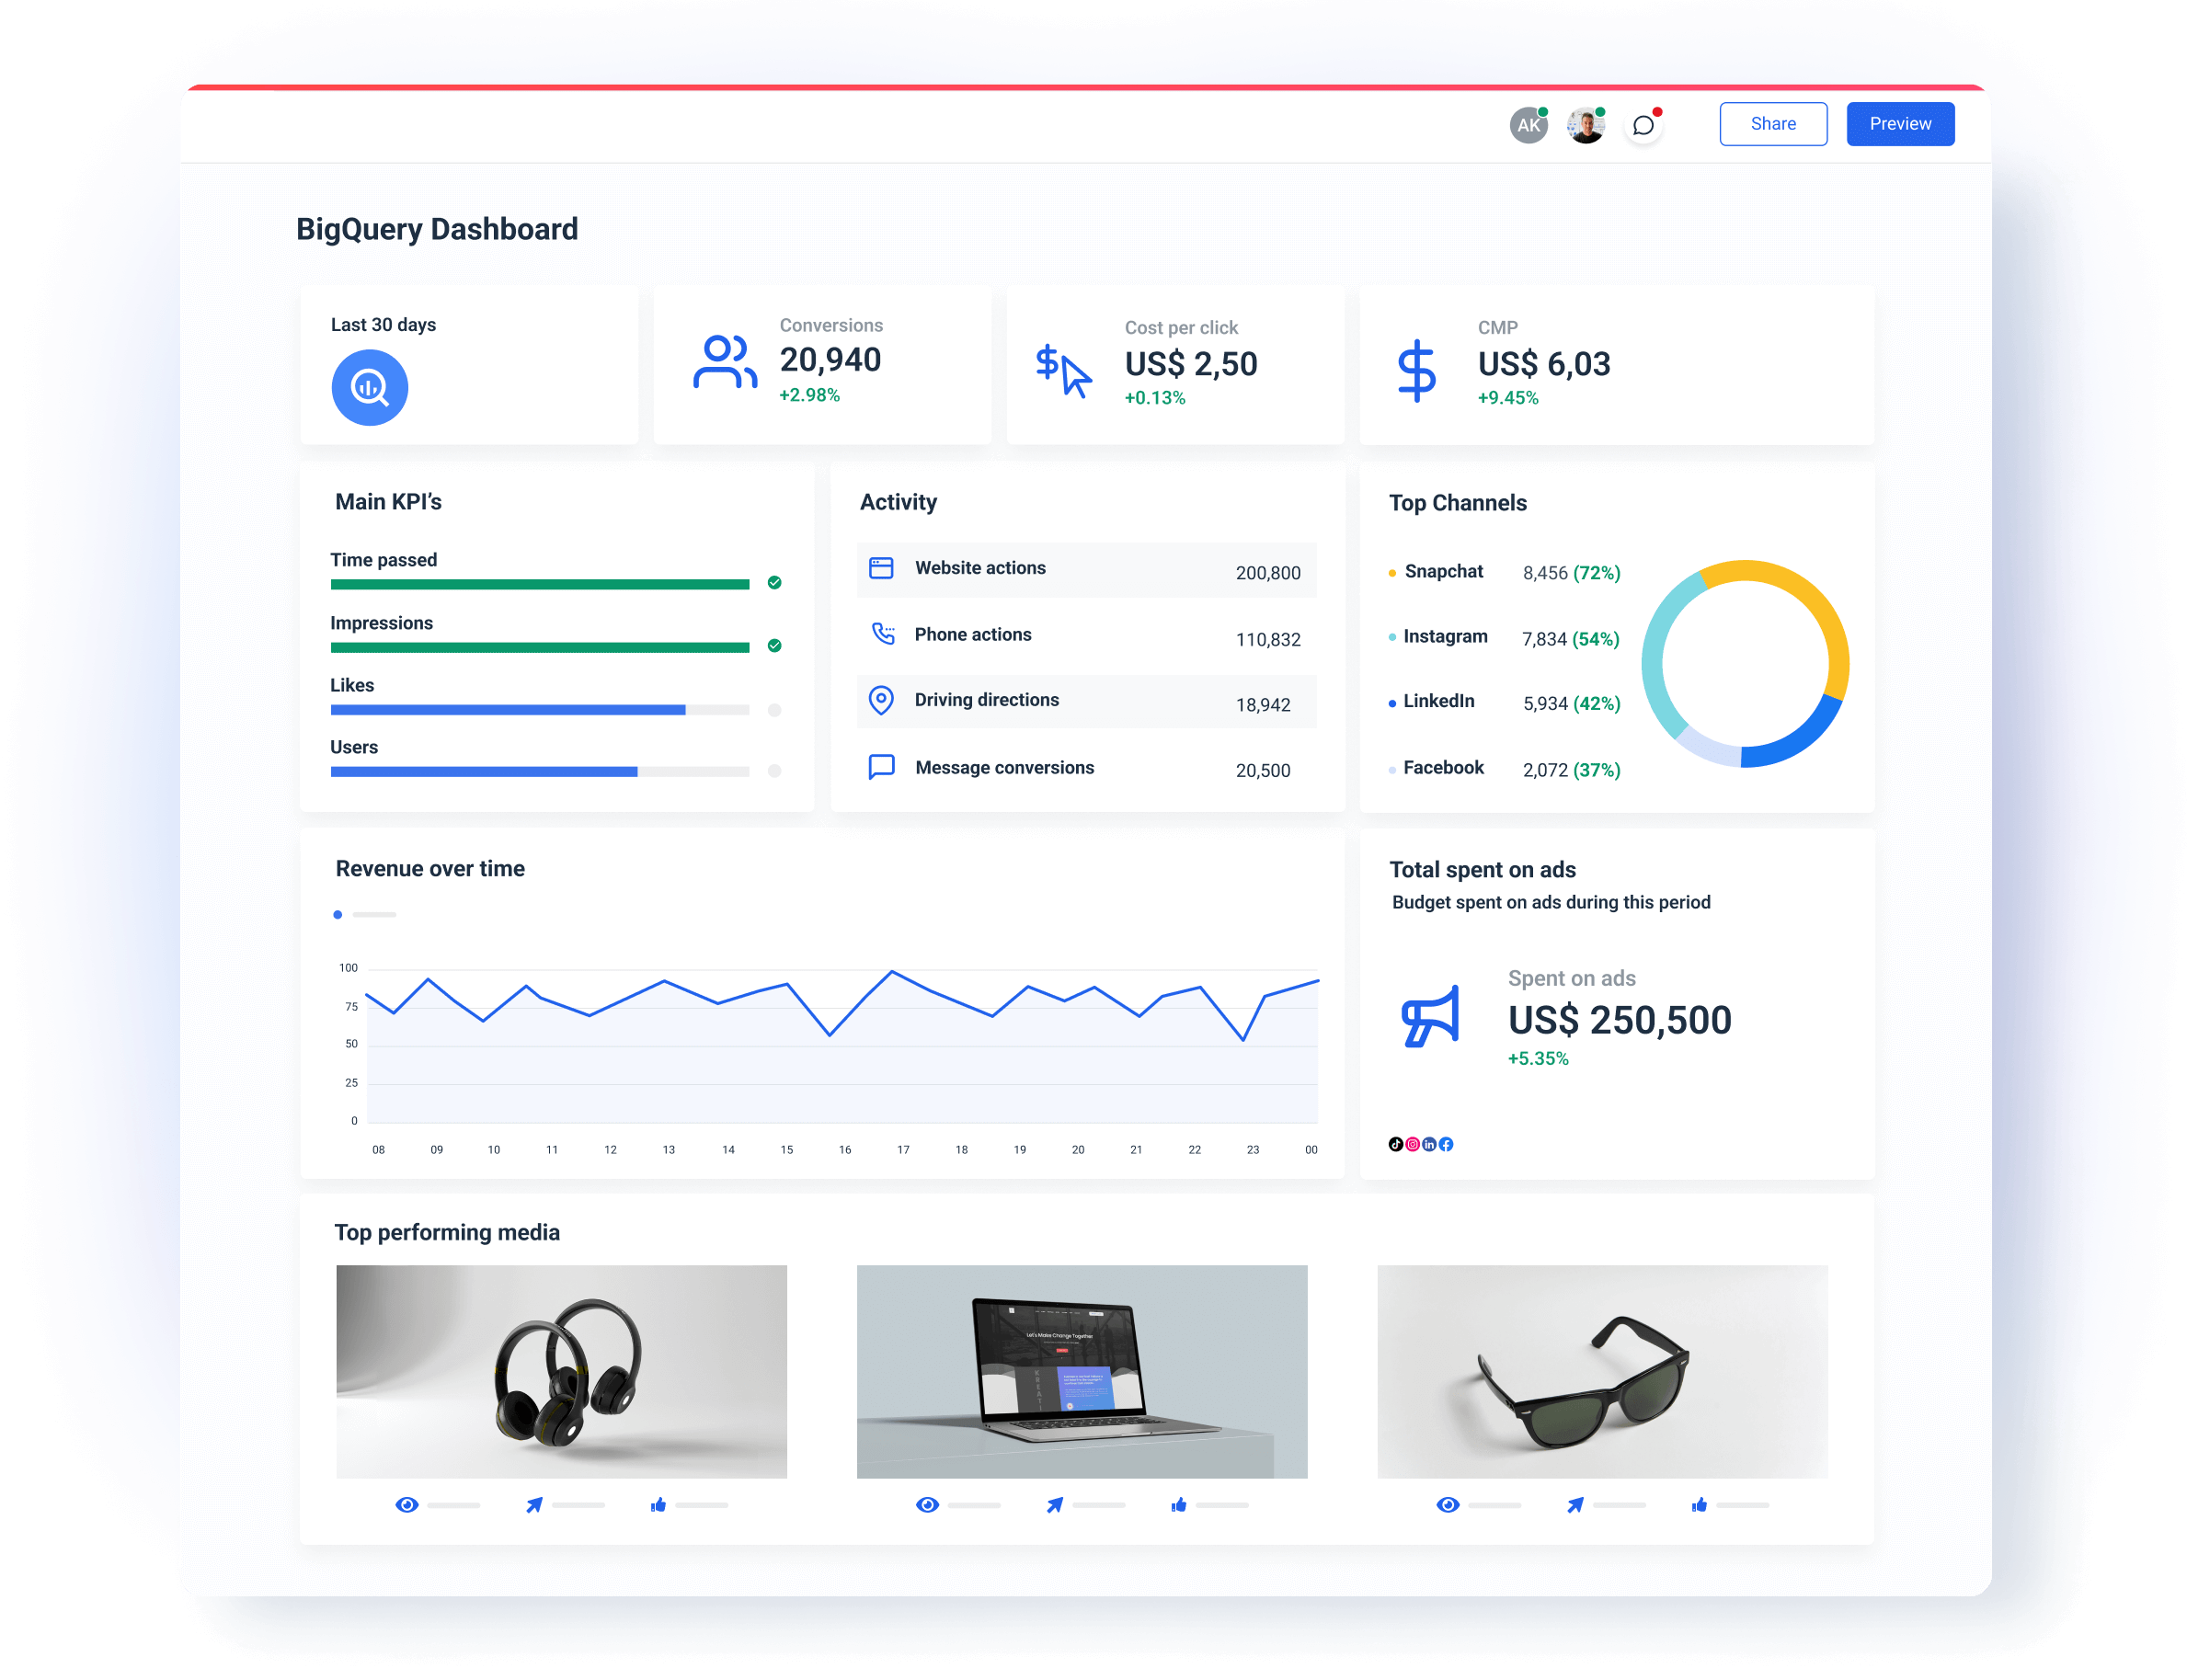
What is a BigQuery dashboard?

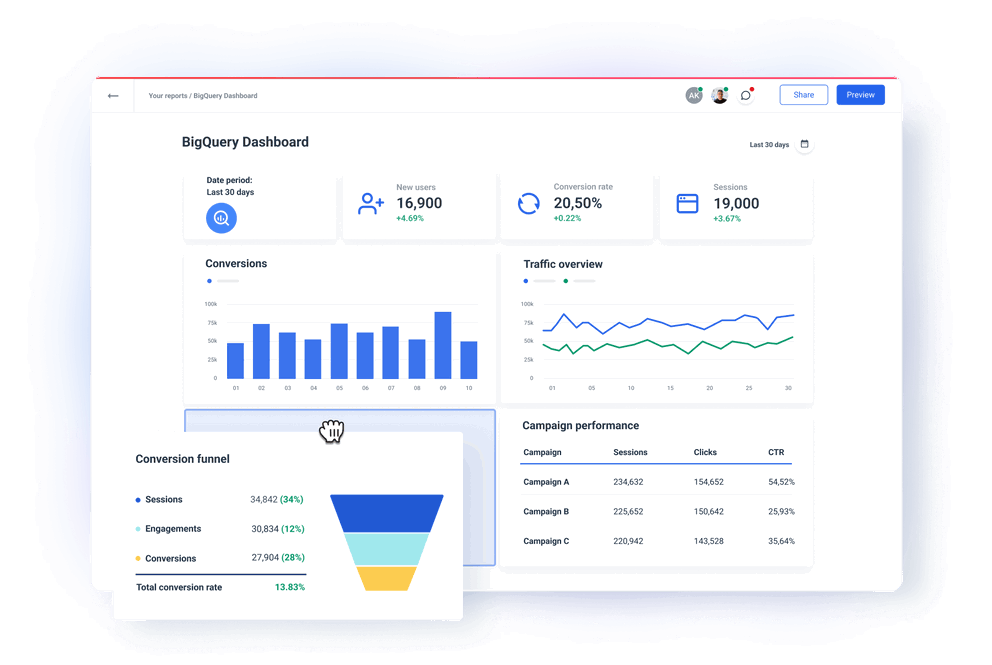
A BigQuery dashboard is a dynamic display with all the essential key performance indicators (KPIs) from the marketing data you connect through your data warehouse. Via user-friendly widgets and data organization features, a BigQuery dashboard allows you to accurately connect and share the critical KPIs and metrics with clients or stakeholders and allows them to make data-driven decisions fast.

BigQuery dashboard in Whatagraph

Why should you store your marketing data in BigQuery before analyzing it?

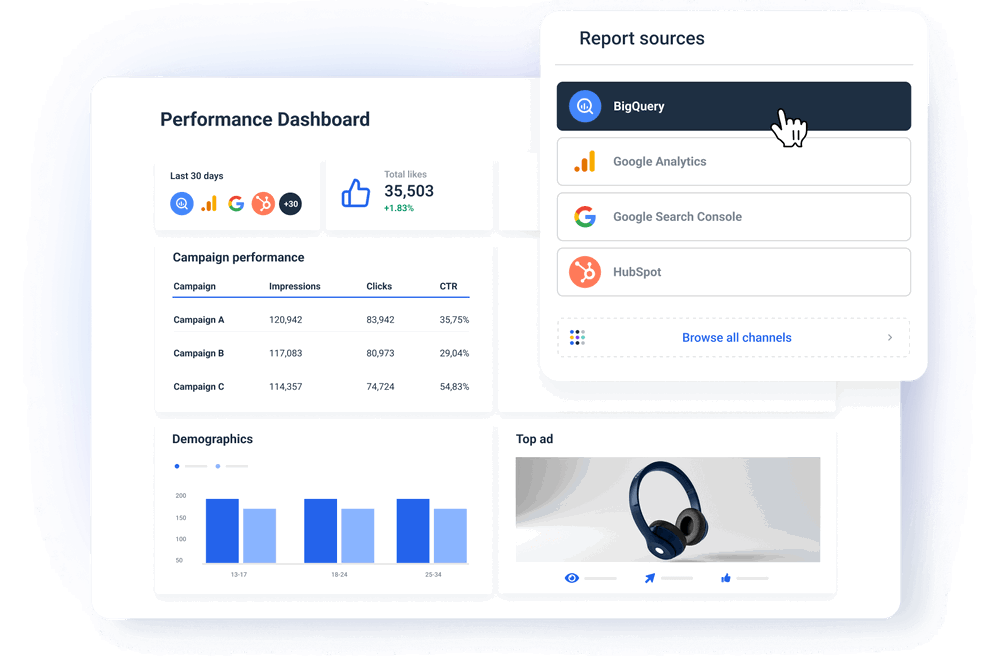
Whatagraph offers 45+ integration, and thanks to our intuitive cross-channel features, you can connect more sources to visualize data in one dashboard. However, storing data in Google BigQuery before analyzing it offers several advantages:

More control over your data: With your data stored in a warehouse, you can get around any limitations set by third parties. No more API call limits, worries about historical data in Google Analytics, or other limitations.

Pick the most important metrics: When you move data to BigQuery with Whatagraph, you can pick specific metrics and dimensions for transfer and stay in control of what exactly is being moved. Get granular, up-to-date, necessary data from constantly monitored and updated connections with popular marketing platforms. 

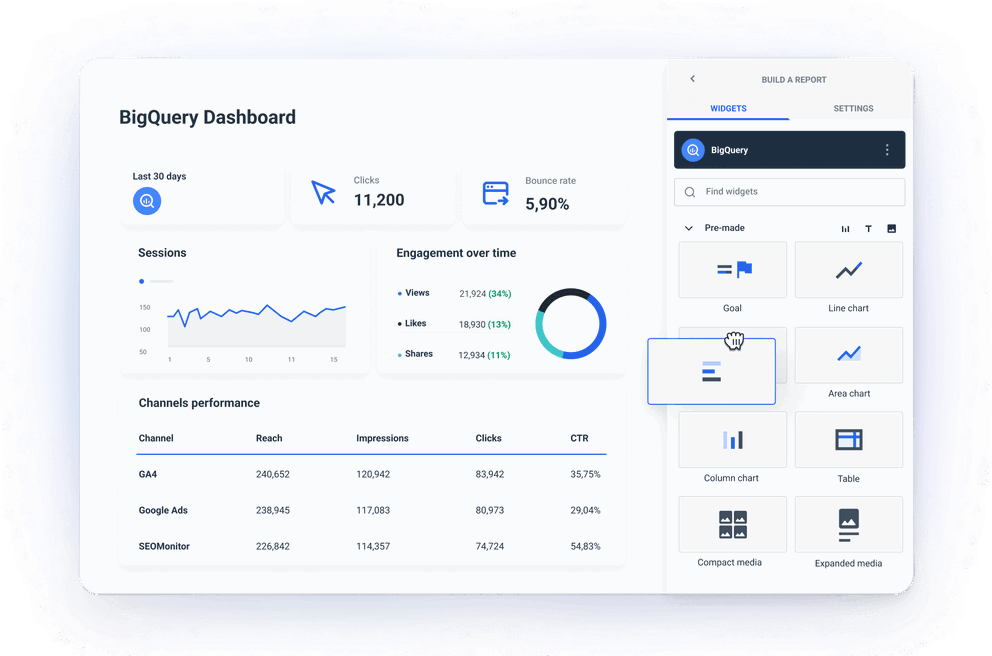
More integrations: BigQuery integrates well with other Google Cloud services and third-party tools, allowing you to build a comprehensive data pipeline. This includes data ingestion tools like Google Cloud Storage, ETL tools like Dataflow, and business intelligence and machine learning services like AI Platform. BigQuery supports standard SQL queries, making it easier for analysts to write queries without learning a new query language. This effectively means you can connect any data source you have that is outside the current Whatagraph integrations.

Scalability: BigQuery is designed to handle terabytes and petabytes of data seamlessly. Its architecture allows you to scale your data storage and query operations without compromising on performance. What is more, BigQuery automatically allocates resources as needed, allowing you to focus on analysis rather than infrastructure management. This means you can use it to visualize your historical data without missing a beat.

Performance: BigQuery uses a distributed, columnar storage format that enables fast execution of complex queries across large datasets. Its ability to perform parallel processing ensures quick retrieval of results. The platform optimizes query performance by leveraging features like automatic query caching, partitioned tables, and clustering.

Security: BigQuery provides data encryption at rest and in transit, along with detailed access control mechanisms through Google Cloud IAM. It meets various industry standards and compliance certifications, which is crucial for organizations handling sensitive data.

Storing data in Google BigQuery before analyzing it leverages these benefits to provide a robust, efficient, and scalable environment for comprehensive data analysis.

Create your Google BigQuery data visualization in minutes

Whatagraph allows you to quickly create standalone BigQuery dashboards or easily combine data from different integrations and build cross-channel dashboards. 

FAQs

All your questions answered. And if you can’t find it here, chat to our friendly team.

Does BigQuery have visualization?

You can use BigQuery to explore data with Looker Studio, a no-cost self-service business intelligence platform that lets you build and consume data visualizations, dashboards, and reports. With Looker Studio, you can connect to your BigQuery data, create visualizations, and share your insights with others.

How to create a dashboard in BigQuery?

To create a dashboard in BigQuery, you need to:


1. Open Google Cloud console, go to the Monitoring page.


2. Select Dashboards > Create Dashboard.


3. Click Add Chart. You see the Add Chart page.


4. In the Find resource type and metric panel fields:


For the Resource type drop-down list, select Global. You might need to expand the list of Resource types for the Global option to be visible.

For the Metric drop-down list, select Query execution time.


5. The Aggregation pane fields control how the execution-time data are displayed. You can modify the default settings for these fields.


6. Click Save.


However, this BigQuery dashboard is more for internal use by data teams. It’s not flexible enough to be used and shared throughout the company, or with agency clients. If you want to scale up your data tracking and sharing, or build custom dashboards for different client needs, you need Whatagraph, which is a much more powerful BigQuery data visualization solution.

What other marketing channels can I connect with Whatagraph?

Apart from your custom data sources you connect with BigQuery, you can directly connect PPCs like LinkedIn Ads and Google Ads, social media such as LinkedIn, Instagram, and Twitter, e-commerce platforms like Shopify and WooCommerce, SEO tools like Ahrefs, Semrush, and Google My Business, email marketing tools like Klaviyo and Mailchimp, Google Analytics 4, and CRMs like HubSpot and Salesforce.


Alternatively, you can also connect data sources via a Custom API or export them to Google Sheets docs.

Need more help with getting started?

An image of the Whatagraph dashboard, with a custom reporting template

We can set up your report campaign for you!

If you need help with setting up Whatagraph - our team can create your campaign reports!

Ready for insights?

It's time to focus your time on the tasks that really matter, and let us worry about your marketing analytics. Start your free 7-day trial.

  • Free for 7 days
  • No credit card required
  • Live chat support
  • Cancel anytime
Start Reporting For Free

No credit card required

Cross channel reporting template with Whatagraph