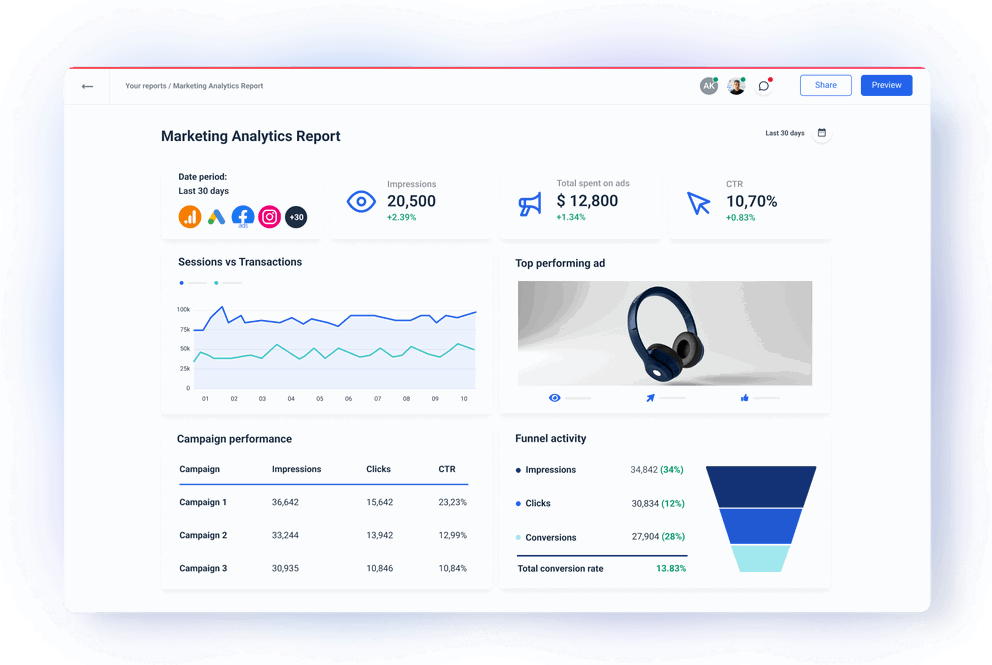
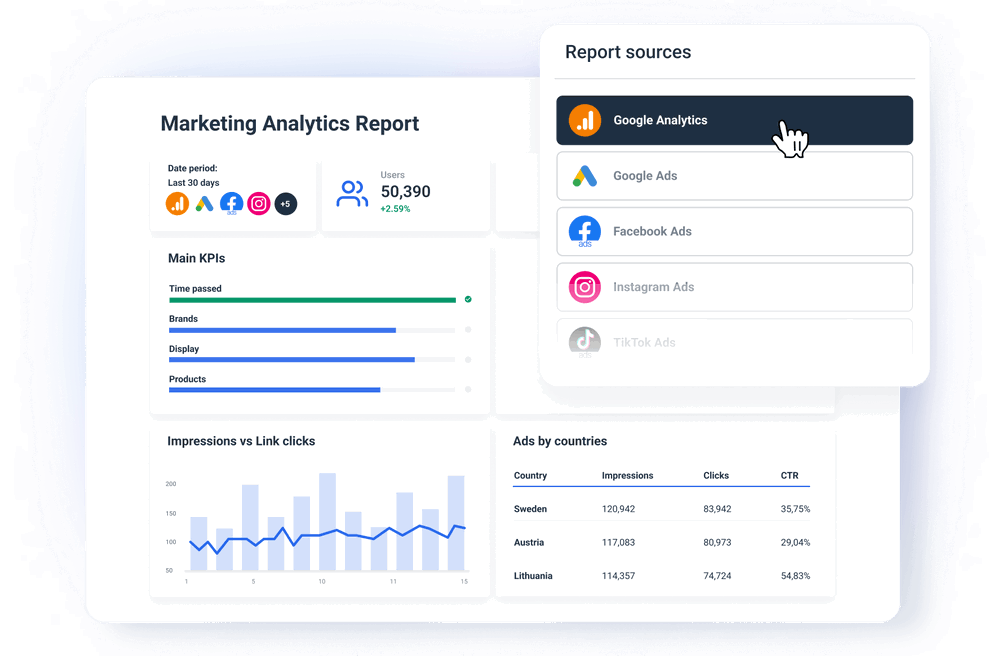
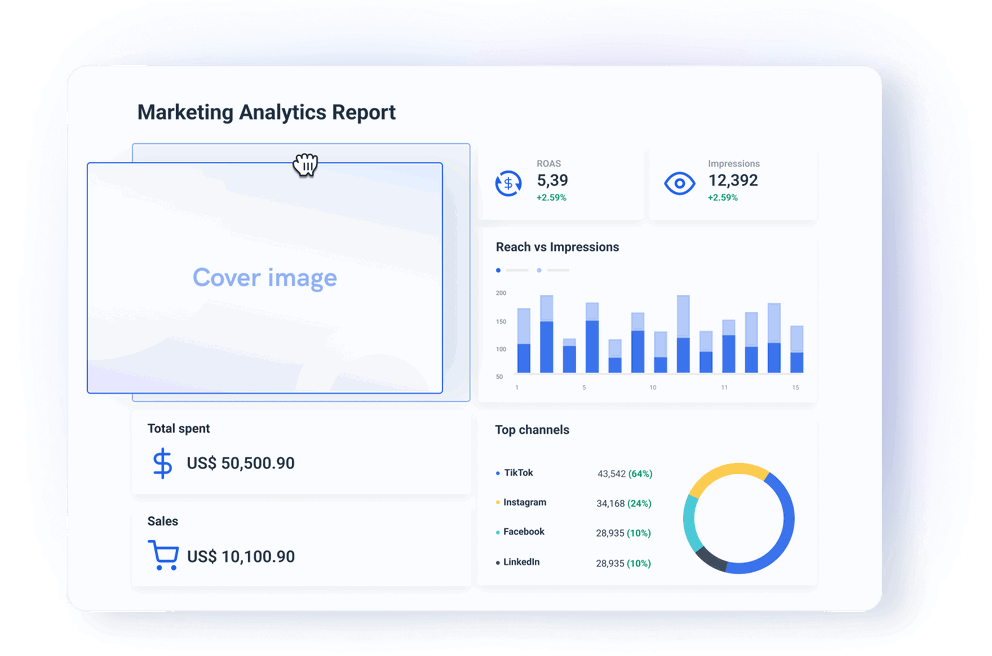
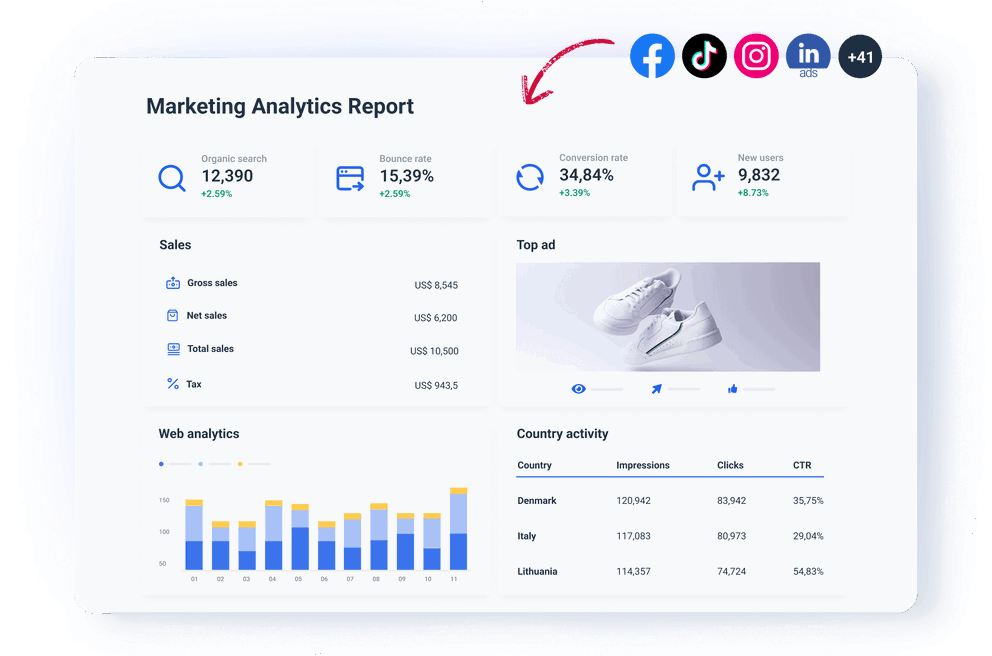
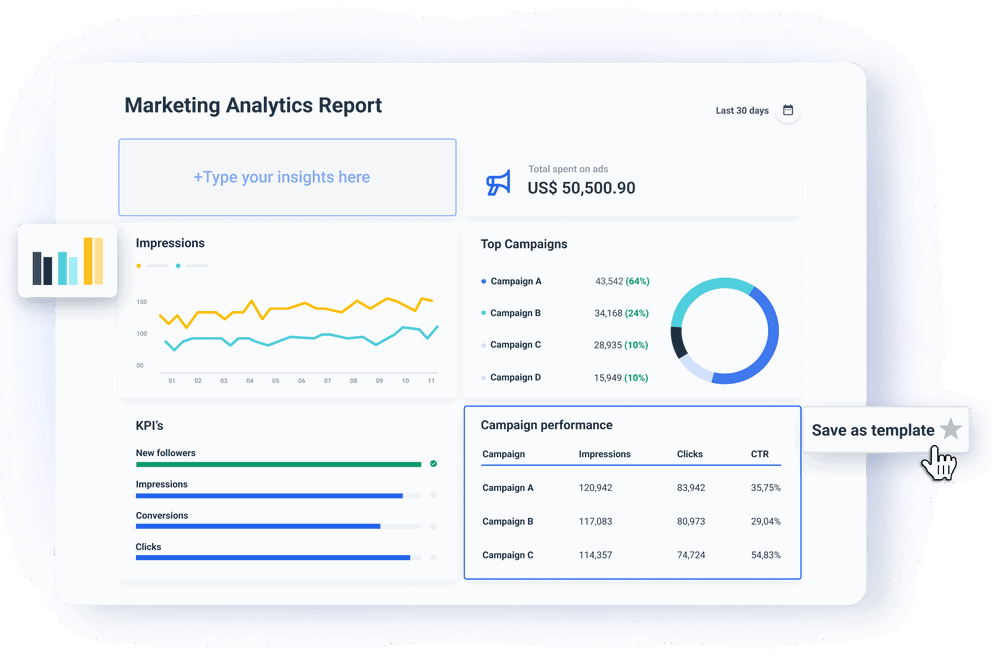
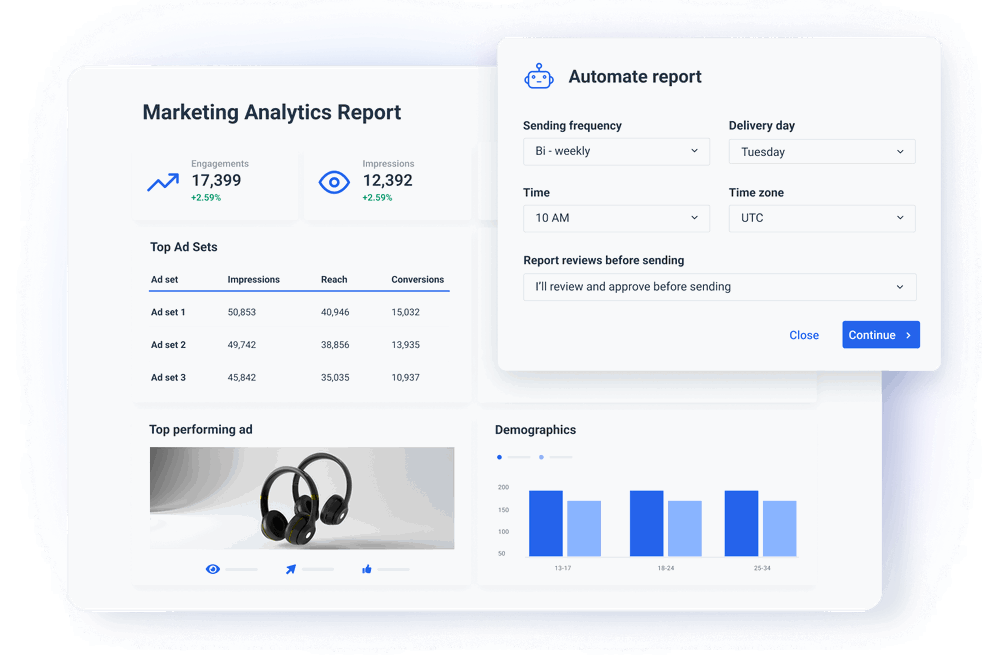
What is a marketing analytics report template?
A marketing analytics report template is a digital document that allows marketing agencies to quickly and accurately connect data from their clients’ multiple marketing platform accounts, visualize and organize the critical KPIs and metrics, and enable easy sharing. In the case of the Whatagraph template, you can enrich the report with data from any 45+ integrated sources and save any customization as a new user template.
Why should you use a marketing analytics report template?
As a marketing agency, you need a quick and easy way to gather and present marketing data to your clients. You need a solution that connects data rapidly and presents it in an engaging, easy-to-digest format. This marketing analytics template helps you achieve that. Let’s talk about a few reasons why you should use this template:
Save time and increase efficiency: A marketing analytics template streamlines the report creation process, freeing more time for new client acquisition and campaign optimization. Instead of starting from scratch for each report, you can simply connect the relevant data sources and customize the template as needed.
Standardized reports every time: Using a template to create reports ensures consistency and standardized UX across all marketing analytics reports within your agency. This helps maintain a unified brand image and ensures that all clients or stakeholders receive reports in a familiar format. What is more, whenever you need to change your company or client details, you can easily do it for all reports at once.
Accurate insights: Whatagraph’s marketing analytics report templates reduce the risk of errors and inconsistencies by providing a structured and automated system for gathering and organizing data and presenting insights. This minimizes the chance of mistakes and ensures that reports are reliable every time, especially when compared to working with multiple Excel sheets, visualizing in third-party tools, or PowerPoint slides.
Scalability: Large marketing agencies handle large volumes of client accounts and campaigns, so scalability is essential. A marketing analytics template allows you to quickly generate reports for multiple clients and campaigns and ultimately helps you scale your operations without compromising quality.
Easy customization: Whatagraph templates provide a standardized format based on best practices and industry standards, but they are also flexible enough to be customized to meet clients' specific needs and preferences. Marketing teams can tailor the template to include different marketing KPIs, metrics, and visualizations relevant to each client’s goals and objectives.
Smooth client communication: Marketing analytics reports act as a key communication tool between agencies and their clients. Using templates ensures that reports are presented in a professional and organized manner, making it easier for clients to understand the insights and recommendations provided by the agency.
What can Whatagraph’s marketing analytics template tell you?
Executive summary
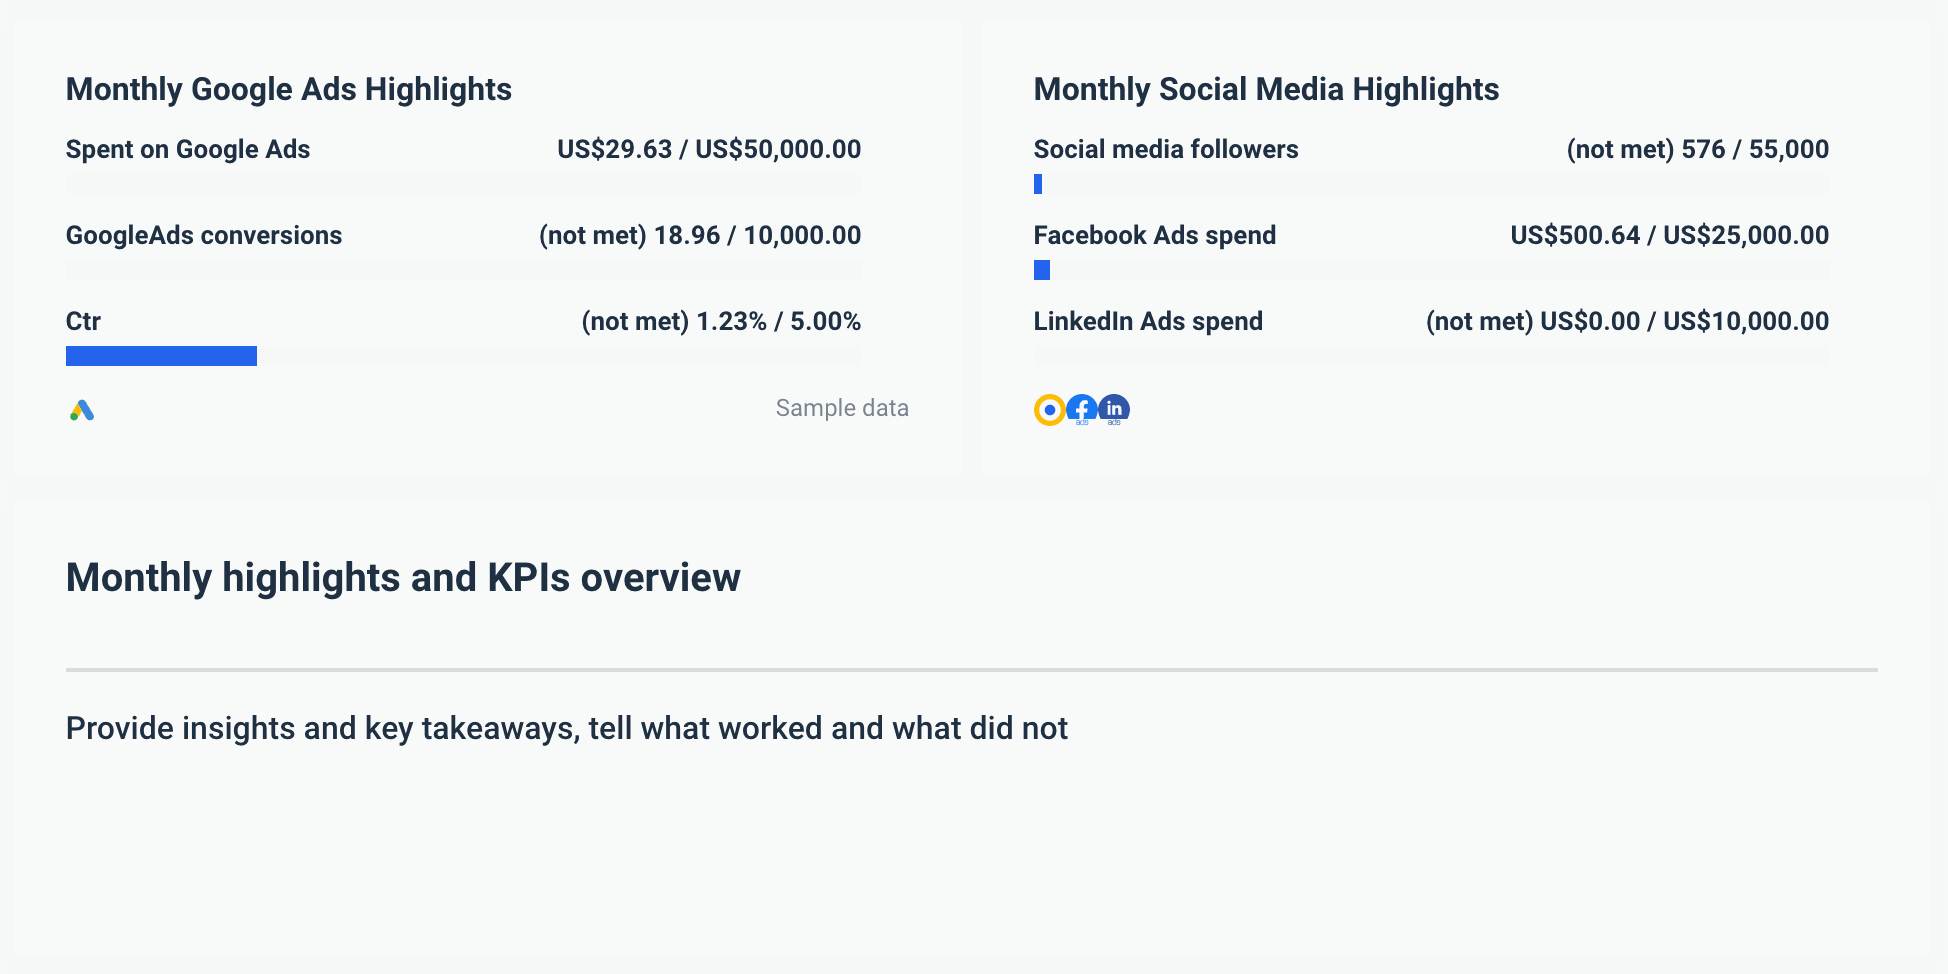
This is the high-level section where you give your clients the big picture of what happened this month with their marketing campaigns. It includes a brief overview of the monthly KPI goal completions and the most important metrics, such as the number of followers on social media, the amount spent on paid ads, and the number of conversions. Thanks to our text widget, you can quickly offer insights, comments, and recommendations for marketing activities in the coming months. This is a good place to upsell new services, such as running a cross-channel ads campaign to boost the client's overall social presence and reach.
Content performance
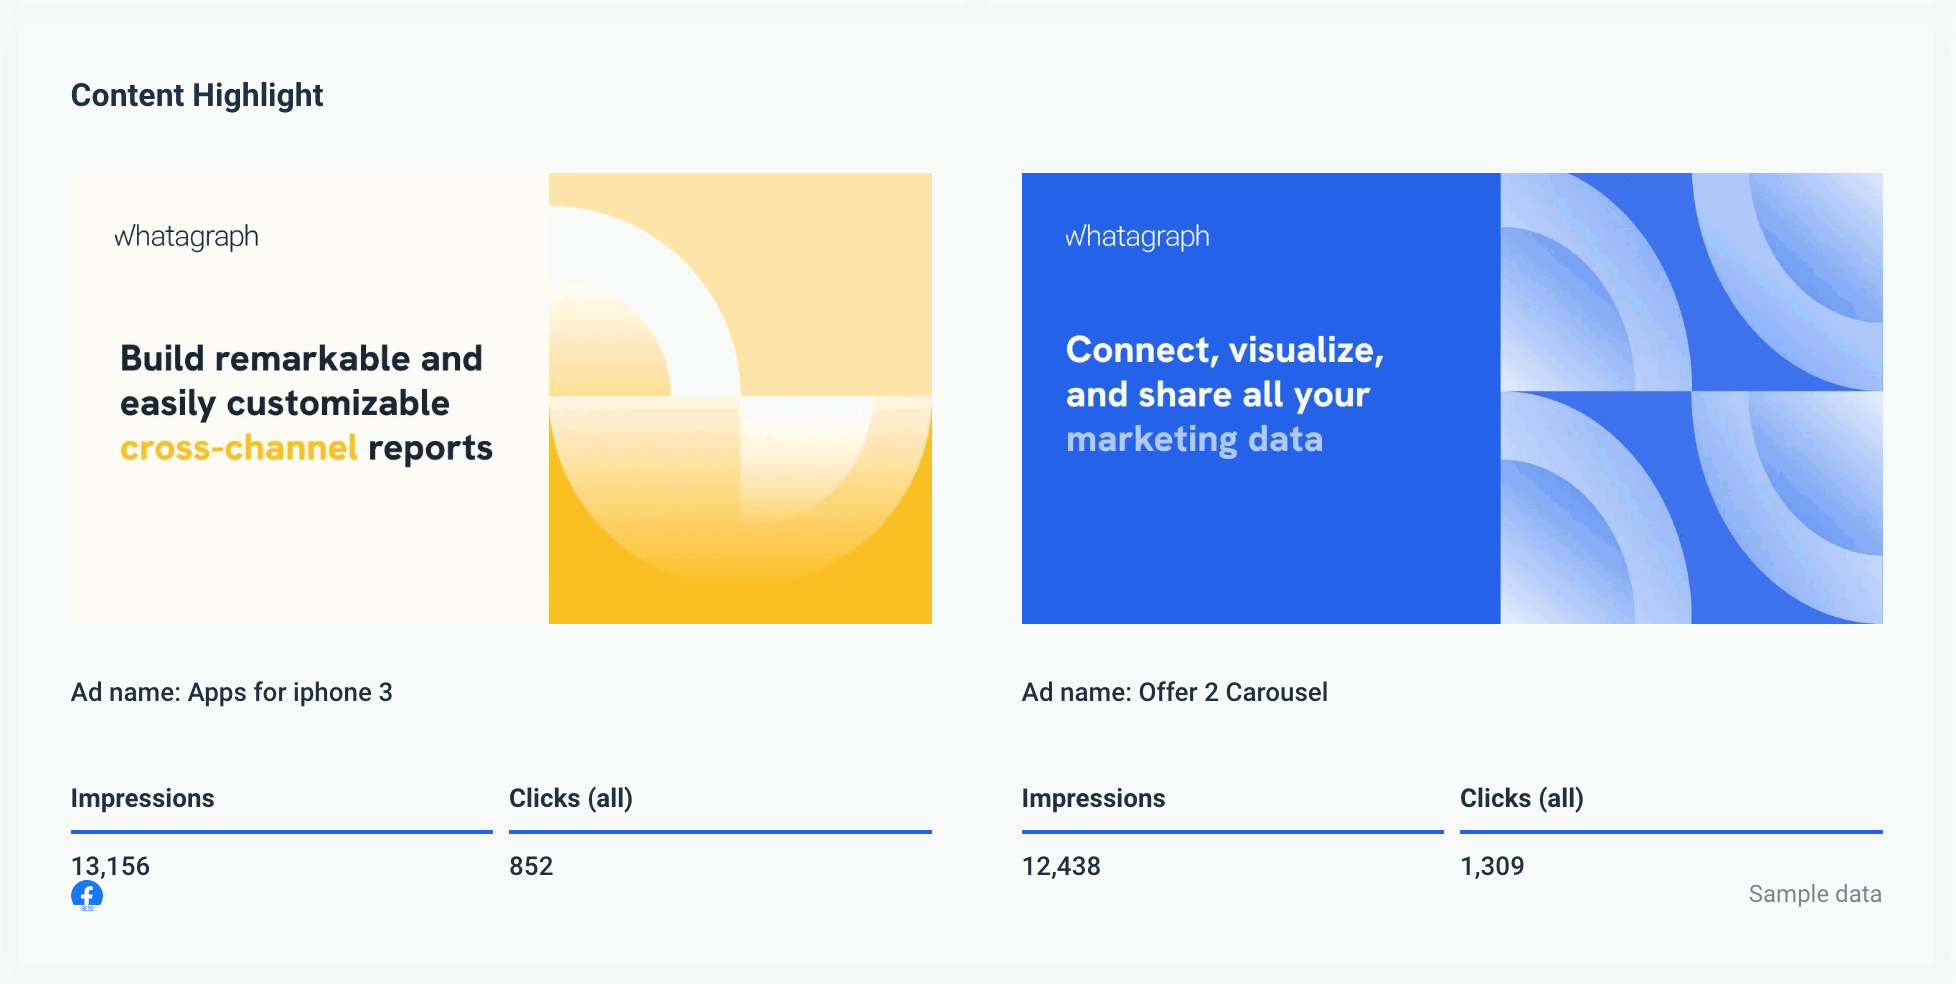
The content performance section of a digital marketing analytics report lets your clients quickly see what kind of engagement each social media post received from their followers. The media widgets display the post creative together with engagement metrics of your choice — how many people clicked on each post, how many times the post was shared, the number of reactions to comments, the number of times videos were played, and more. This allows you to show your clients what kinds of posts work and explain why you plan to release more posts aimed at similar target audiences.
Website traffic overview
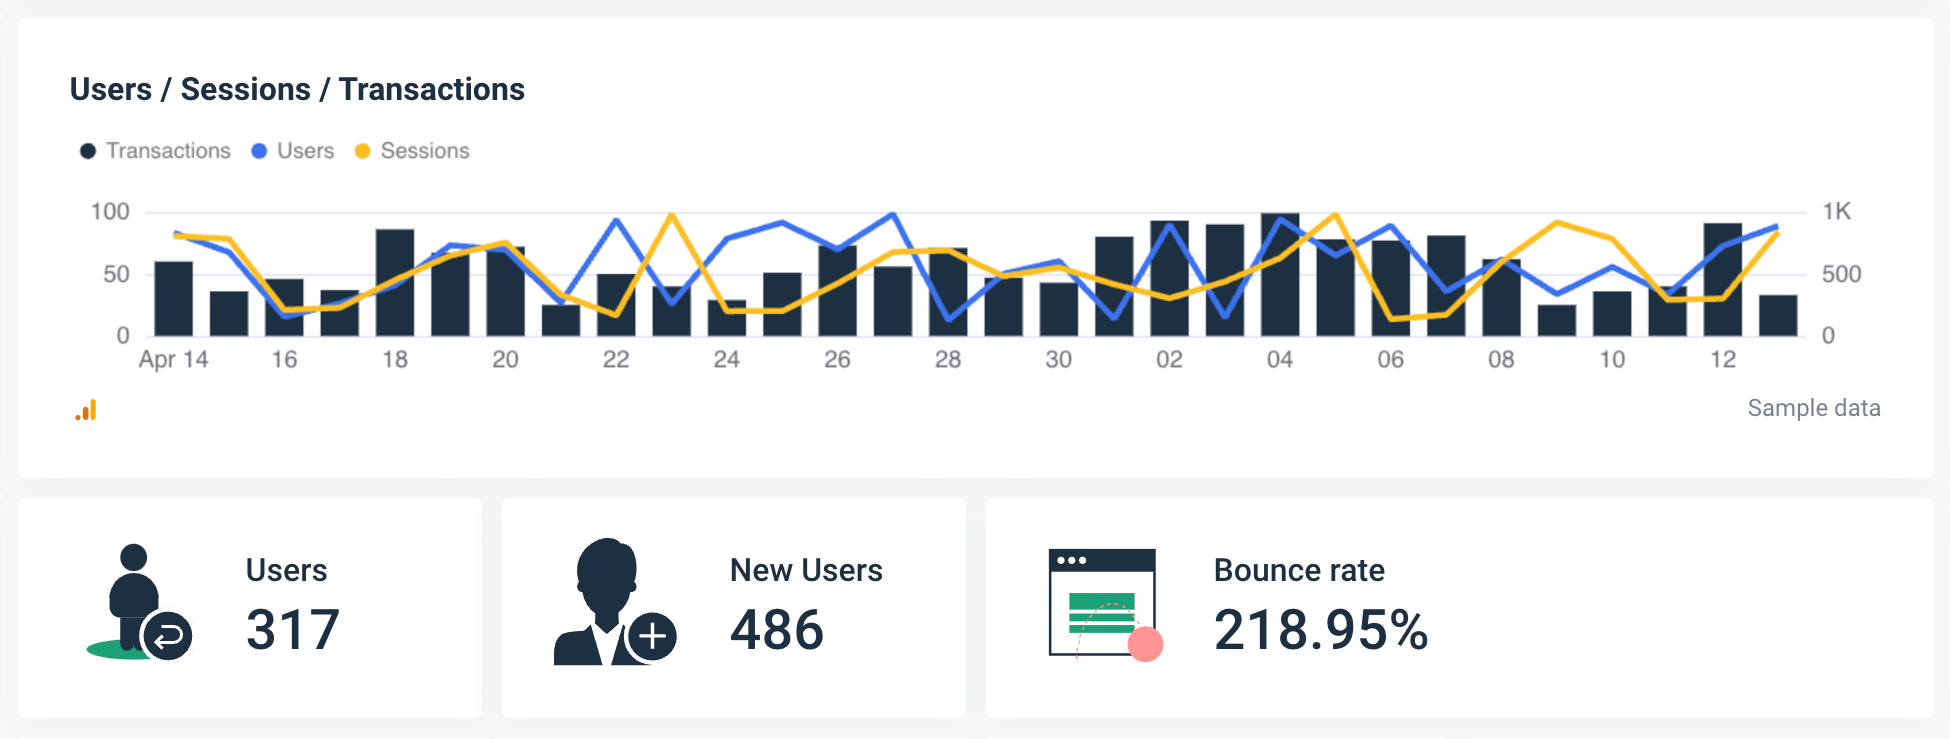
The website traffic section provides valuable insights that can help your clients understand how users interact with their site, identify areas for improvement, and make data-driven decisions to optimize campaign performance and achieve their business goals. Using data from your Google Analytics account, these widgets can show you the relation between sessions and users vs. transactions, the number of new and returning users, and your bounce rate.
Audience insights
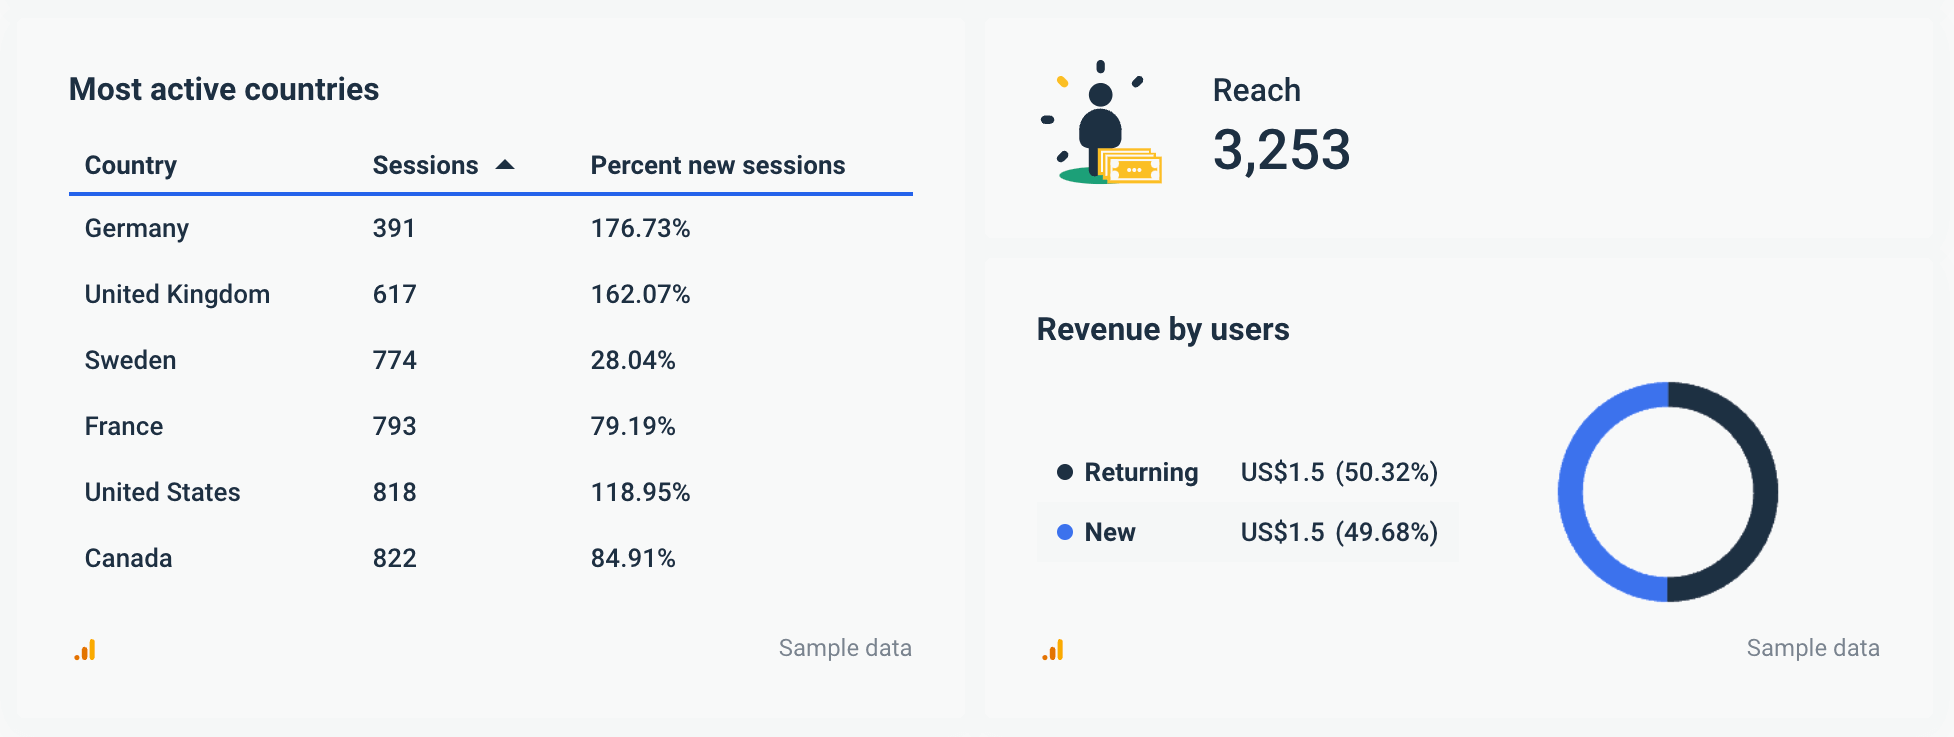
The audience insights section of this digital marketing report template provides valuable information about the demographics, behaviors, and preferences of the audience interacting with a brand or marketing campaign. The audience section gives you insight into the geographic location of the audience, including the top countries, cities, or regions where users are located, as well as revenue generated by the users and the total reach.
Channel overview
The channel overview section of a marketing analytics report provides insights into the performance of various marketing channels or sources that drive traffic to a website or generate leads. The proportion of total website traffic attributed to each marketing channel helps you understand the relative importance of each channel in driving overall website traffic and assess the effectiveness of your marketing efforts across different channels. Coupled with our channel revenue table widget, it can reveal any trends or patterns in channel performance over time and help you identify emerging opportunities or challenges in your approach and adjust your strategies accordingly to maximize results.

