Metrics Dashboard for Businesses
Build a dynamic metrics dashboard to visualize your most important KPIs and metrics across different marketing platforms. Our metrics dashboard automatically pulls data from 45+ sources, so your information is always relevant and up-to-date.


What is a metrics dashboard?
A metrics dashboard is a brief report you can use to track and present key performance indicators and metrics in real time across multiple channels. Use a metrics dashboard to increase transparency, prove ROI, and evaluate the performance of your marketing team.
Why create a metrics dashboard with Whatagraph?
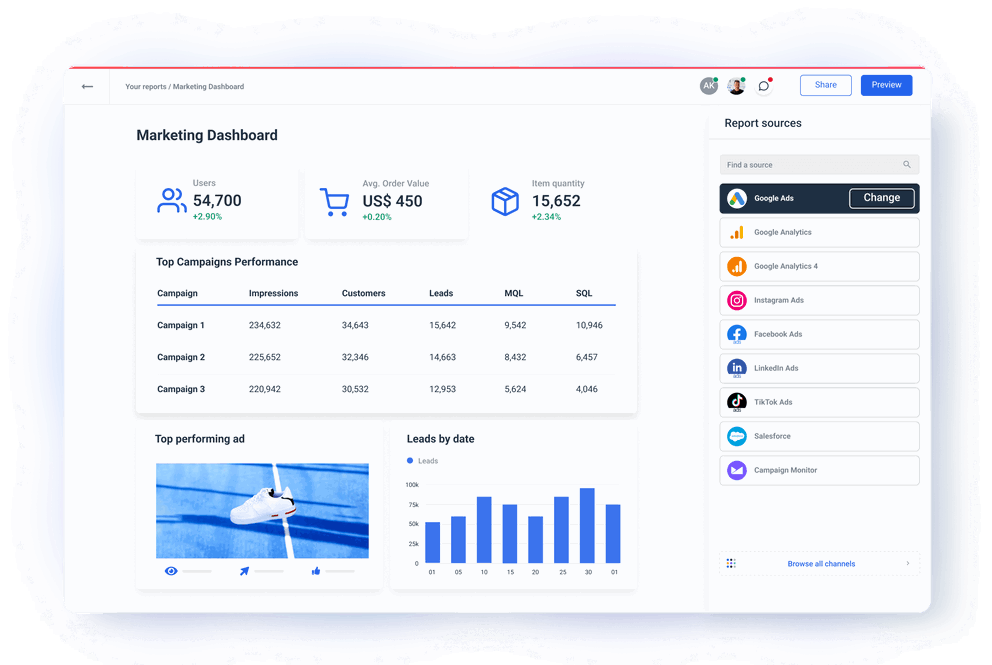
Easy cross-channel insights
Effortlessly combine data from different sources into a cross-channel dashboard with select marketing metrics and key performance indicators. Automatically pull data from over 45 native integrations. With just one look, your team can see what’s working in their campaigns and where they’re falling short.
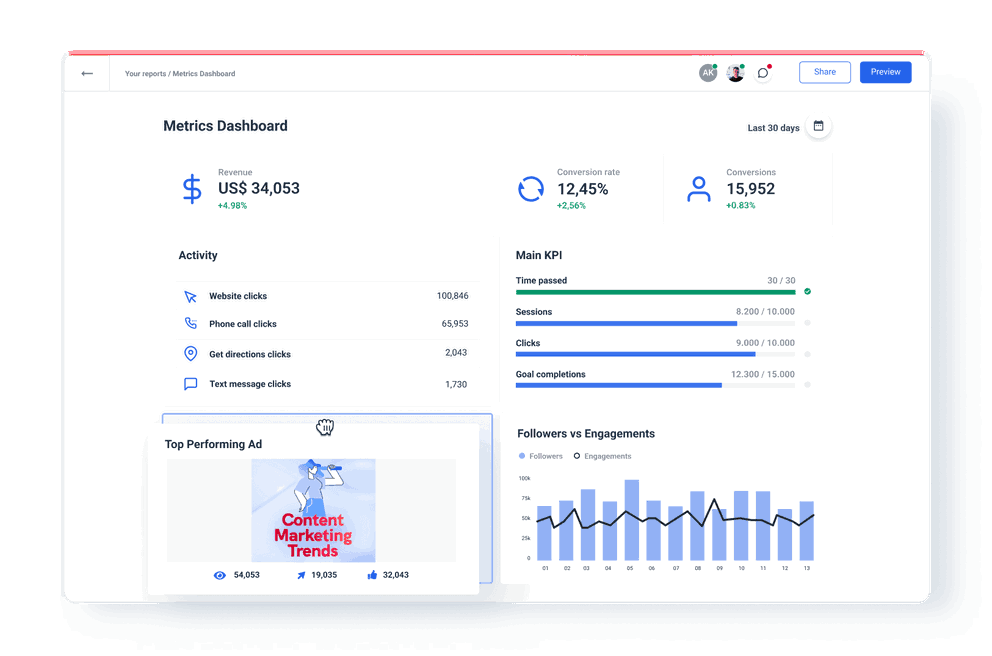
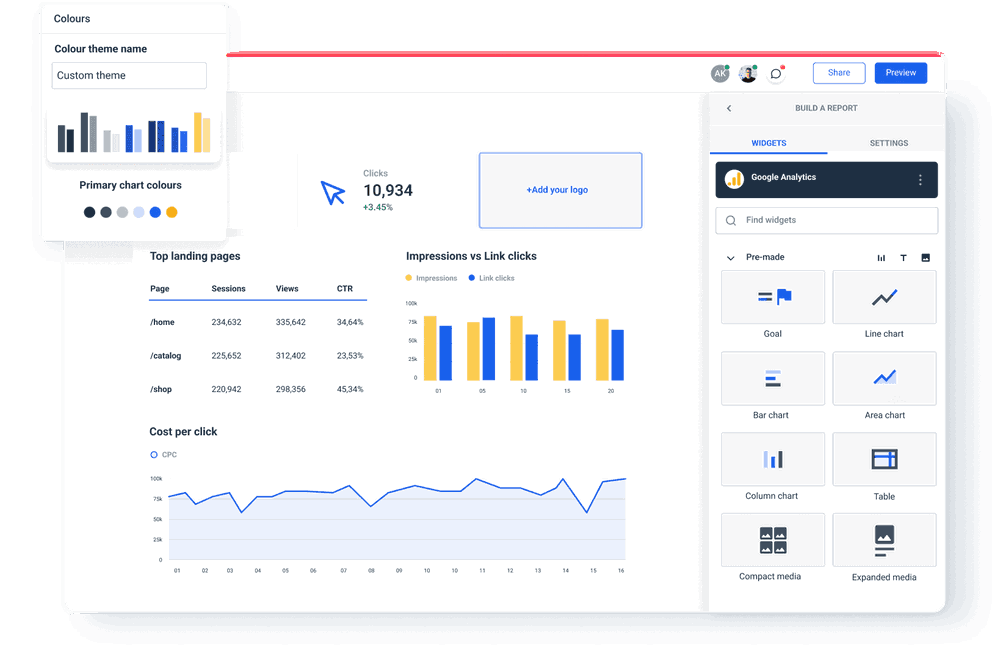
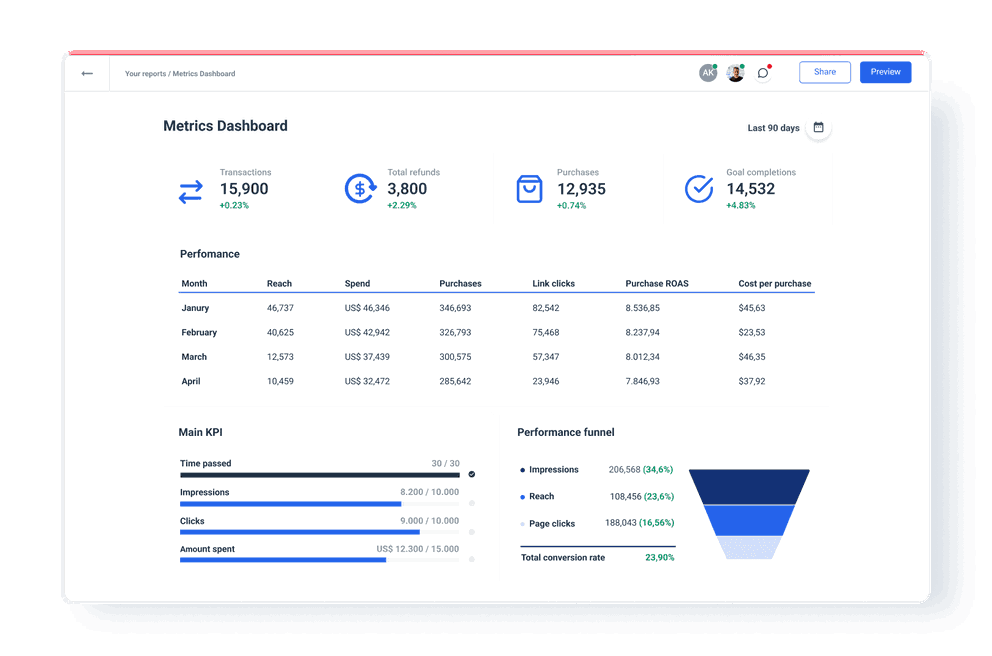
Build your own metrics dashboard in minutes
Create a metrics dashboard and customize it according to your needs in less than 5 minutes. The choice is yours:
- Start from a blank page,
- Use our smart builder,
- Pick a dashboard template from our gallery.
Whether you build a single-channel or cross-channel dashboard, Whatagraph makes it quick and easy. Drag and drop tables, graphs, and charts to show the exact data you want, the way you want. Set data sources and metrics for every widget. Play with the layout, colors, and more to create a metrics dashboard your clients will love.
On-demand access via live link
Share your metrics dashboard via live link for on-demand access. This is the quickest way to show the stakeholders how your marketing efforts impact the bottom line. Build transparency and accountability by letting other teams check the marketing KPIs whenever they need actionable insights.
All reporting features your agency needs


Frequently Asked Questions
Why use a metrics dashboard?
You use a metrics dashboard to track the performance of your marketing channels and improve your decision-making. By focusing on your performance metrics, you can make more accurate data-driven decisions. A metrics dashboard lets you measure your marketing return on investment in near real-time so you can adjust your marketing activities.
What are dashboard metrics?
Dashboard metrics are measurements you can use to create visual representations of data that you collect. These visual elements may include charts, graphs, tables, and single-value widgets to help you better understand the performance of your company, process, or team.
What key performance indicators and metrics should a metrics dashboard include?
A metrics dashboard should include the overall traffic, website performance metrics like conversion rate, bounce rate, click-through rate (CTR), page views, organic search and organic traffic metrics, backlinks, email open rate, referrals, retention, and goal completion rates.
Can I create a metrics dashboard in Excel?
Yes, you can create a marketing dashboard in Excel, but this method has many drawbacks. First, in order to visualize the key metrics, you need to manually import data into the spreadsheet. Also, you need to clean and prepare data, with a massive chance of error. Not to mention, there are no real-time updates, as with dashboards created in Whatagraph. Lastly, there’s no security, as your marketing data is open to anyone accessing the dashboard.
How many metrics dashboards can I create with Whatagraph?
All of our pricing plans include an unlimited number of dashboards. Create, edit, and send as many metrics dashboards as you need.
What sources can I connect with a Whatagraph dashboard?
Whatagraph allows you to connect data from over 45 native integrations. These include social media platforms like LinkedIn and Facebook, Google Analytics 4 for marketing analytics, PPC apps like Google Ads (AdWords) and Facebook Ads, Ahrefs and Semrush for search engine optimization, email campaign tools like Mailchimp and Klaviyo, and CRMs like HubSpot and Salesforce. In addition, you can connect any unsupported source via a Custom API, BigQuery, or Google Sheets.
How to choose the best marketing dashboard software?
The best marketing dashboard software must allow your marketing team to easily connect cross-channel data, create custom data visualizations, and share the dashboard link with a few clicks.
What are the most useful marketing dashboard examples?
There are many different types of dashboards, but the most useful are the web analytics dashboard, marketing performance dashboard, marketing KPI dashboard, e-commerce marketing dashboard, marketing campaign dashboard, CMO dashboard, email marketing dashboard, social media marketing dashboard, SEO dashboard, and lead generation dashboard.
What is the difference between marketing reports and dashboards?
The difference between marketing reports and dashboards is that marketing reports are typically more detailed and contain historical data as well, which makes them suitable for evaluating your marketing strategy. Dashboards, on the other hand, are best used for tracking current KPIs and metrics values, campaign performance, and short-term marketing goals.
It’s good to be loved! Our clients are not shy about expressing it.
I made a switch from GDS and Sheets for reporting to Whatagraph, and I am saving literal hours each week on performance report creation. Our small firm actually managed to onboard 2 new clients as a result of all the time we saved on managing data and reporting. The customer service is also really helpful and easy to reach.

Capterra verified review by
Mindaugas S., Marketing Consultant
Having active customer support to help fix any issues was a big contributor, but we also really liked the ability to save templates and connect sources to multiple charts/widgets at once without having to edit them individually. And having the grid layout is much easier to stay consistent with than the free form setup that Data Studio has.

Capterra verified review by
Nico T., Media Planner
The system has standard templates that are easy and fast to use. Also you can build your own report with lightning speed. It is very easy to use, has a lot of integration, and let get started very fast.

Capterra verified review by
Rasmus Bernt K., External Senior Management Consultant
We love Whatagraph - we would definitely recommend and our account manager is great! I love how easy this tool is to use, everyone on the team finds it much more user-friendly than other dashboards. Integration was easy, we sent some example reports to the team who duplicated these for us. We literally had to log in and send it to our clients!

Capterra verified review by
Stephanie S., Digital Director
We are showing our clients the work that we're doing for them and this is incredibly important for our clients ROI. They want to see results and having a tool like Whatagraph that can show data from virtually every source we use is hugely important.

Capterra verified review by
John S., SEO Strategist
The tool is easy to use; you do not need to have development resources. Even my junior project managers are capable of making campaign reports in minutes. There are a lot of pre-made templates you can use as well as many pre-made widgets.

Capterra verified review by
Erman E., Marketing Specialist
Really easy to connect data sources within the tool. The library of report templates has been helpful. The customer support team has been responsive to all of our needs. Our team enjoys the simplicity of setting up the reports and how the data is presented.

Capterra verified review by
Brent N., Director of Operations
Easy to create really beautiful graphs and reports which can help other team members to understand the most important takeaways. I especially like the automated report function, so I don't have to check on the same thing repeatedly.

Capterra verified review by
Orsolya S., Online Marketing Manager