Online Marketing Dashboard
Reach your target audience on multiple channels by monitoring top digital marketing metrics that measure your success. PPC, email marketing, social media, and SEO — combine and compare results from multiple platforms in one intuitive online marketing dashboard. Present your clients with an easy-to-understand visualization of their marketing performance and the ROI they get from you.


Spend more time driving better marketing results for your clients
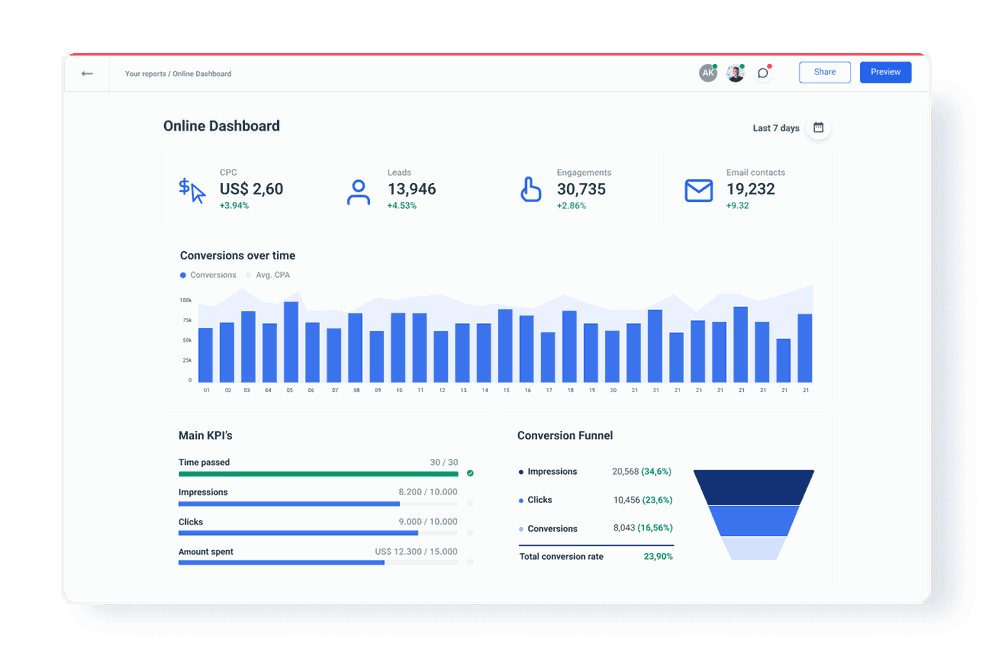
Display only the KPIs you need
Marketing platforms return a massive stream of marketing data that could confuse the end-reader. Whatagraph’s online marketing dashboard allows you to organize data and present only the most impactful data points through intuitive transformations and highly customizable widgets. Unify the metrics and dimension names from multiple channels. Apply different filters or custom calculations and produce a clear picture of your marketing efforts.
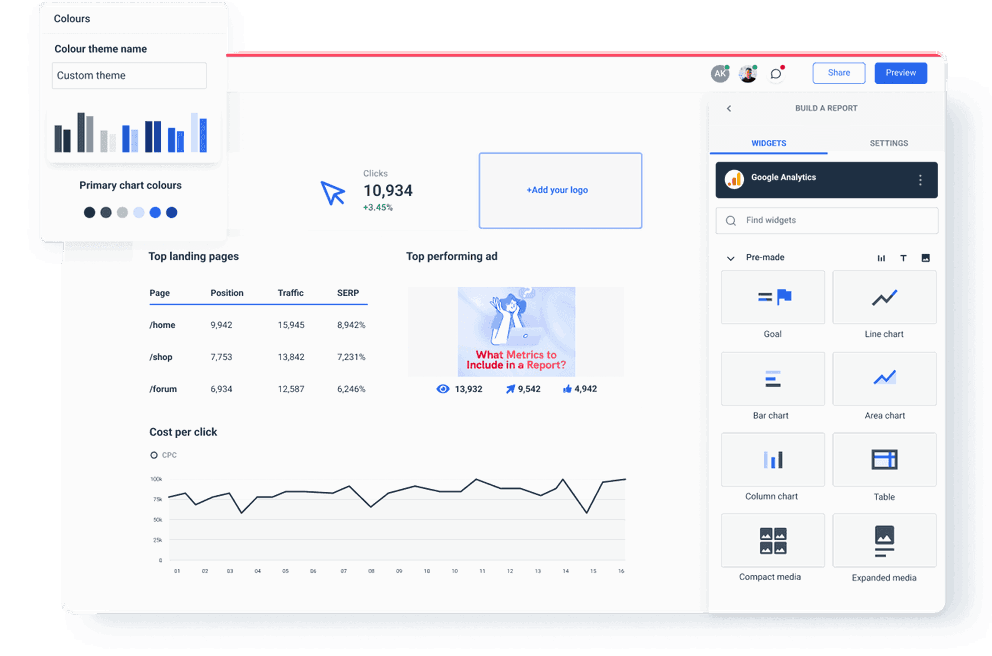
Customize your dashboard with a few clicks
Apply your branding, color scheme, and stunning visuals to build a dashboard that reflects your company’s image. Pick a pre-built marketing dashboard template or create your dashboard from scratch using a drag-and-drop builder. Impress your clients with custom headings and messaging. Share the dashboard with a custom domain that makes it look like an extension of your website.
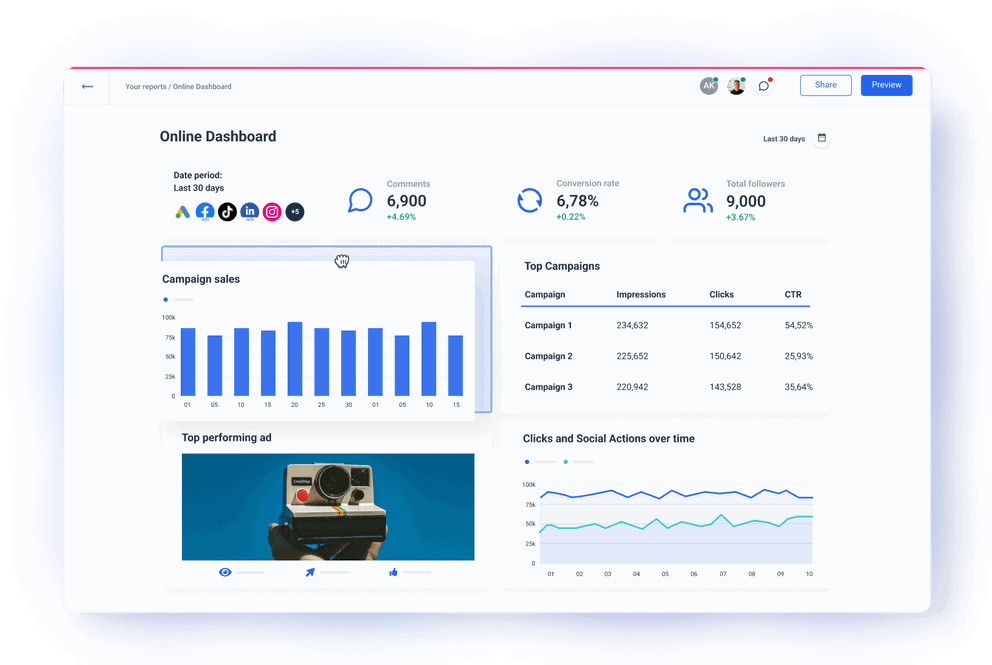
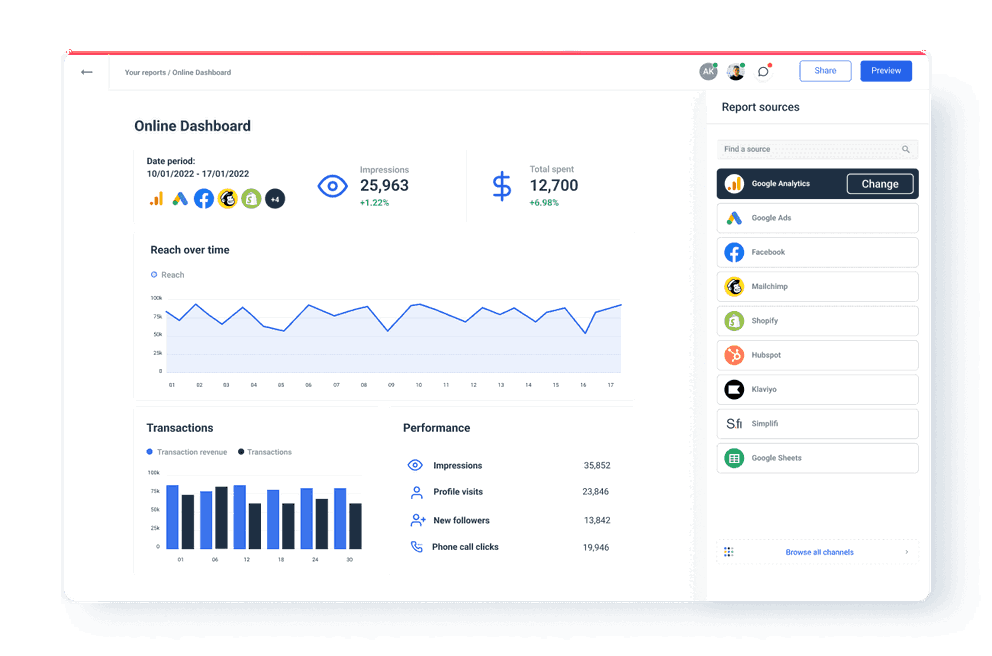
One dashboard for all your marketing channels
Bring all the marketing KPIs from all your client’s data sources together in one comprehensive dashboard. Effortlessly blend and aggregate cross-channel data from multiple sources to quickly explain how your marketing strategy impacts the client’s bottom line. Display the total click-through rate from all social media platforms or compare the conversion rate from LinkedIn and Facebook Ads in the same table. Add a new source to your online marketing dashboard in a few clicks.
It’s good to be loved! Our clients are not shy about expressing it.
I made a switch from GDS and Sheets for reporting to Whatagraph, and I am saving literal hours each week on performance report creation. Our small firm actually managed to onboard 2 new clients as a result of all the time we saved on managing data and reporting. The customer service is also really helpful and easy to reach.

Capterra verified review by
Mindaugas S., Marketing Consultant
Having active customer support to help fix any issues was a big contributor, but we also really liked the ability to save templates and connect sources to multiple charts/widgets at once without having to edit them individually. And having the grid layout is much easier to stay consistent with than the free form setup that Data Studio has.

Capterra verified review by
Nico T., Media Planner
The system has standard templates that are easy and fast to use. Also you can build your own report with lightning speed. It is very easy to use, has a lot of integration, and let get started very fast.

Capterra verified review by
Rasmus Bernt K., External Senior Management Consultant
We love Whatagraph - we would definitely recommend and our account manager is great! I love how easy this tool is to use, everyone on the team finds it much more user-friendly than other dashboards. Integration was easy, we sent some example reports to the team who duplicated these for us. We literally had to log in and send it to our clients!

Capterra verified review by
Stephanie S., Digital Director
We are showing our clients the work that we're doing for them and this is incredibly important for our clients ROI. They want to see results and having a tool like Whatagraph that can show data from virtually every source we use is hugely important.

Capterra verified review by
John S., SEO Strategist
The tool is easy to use; you do not need to have development resources. Even my junior project managers are capable of making campaign reports in minutes. There are a lot of pre-made templates you can use as well as many pre-made widgets.

Capterra verified review by
Erman E., Marketing Specialist
Really easy to connect data sources within the tool. The library of report templates has been helpful. The customer support team has been responsive to all of our needs. Our team enjoys the simplicity of setting up the reports and how the data is presented.

Capterra verified review by
Brent N., Director of Operations
Easy to create really beautiful graphs and reports which can help other team members to understand the most important takeaways. I especially like the automated report function, so I don't have to check on the same thing repeatedly.

Capterra verified review by
Orsolya S., Online Marketing Manager
All dashboard features your agency needs


What is an online marketing dashboard?
An online marketing dashboard is a type of online dynamic display with interactive data visualizations of marketing KPIs, metrics, and other data points. You can use his dashboard to track campaign performance from social media, paid ads, or email marketing. By sharing an online dashboard that updates in real time, you can show clients what you do and why it is important for their business.
Frequently Asked Questions
What should an online dashboard include?
An online dashboard should include key performance indicators (KPIs) and metrics that help marketing teams monitor the effectiveness of marketing campaigns and overall marketing activities. Here are some essential components you can consider:
1. Website Traffic Metrics: total visitors, unique visitors, page views, click-through rate (CTR) bounce rate, and time spent on site. Website performance metrics such as these can even indicate if something is wrong with your website and calls for closer inspection.
2. Conversion Metrics: conversion rates for various actions, such as form submissions, downloads, purchases, or other desired outcomes.
3. Lead Generation Metrics: the number of leads generated through marketing efforts, as well as lead quality indicators such as lead source and lead-to-customer conversion rate.
4. Advertising Metrics: click-Through Rate (CTR) for ads, cost per click (CPC).
5. Return on Investment (ROI): the effectiveness of marketing campaigns by calculating the ROI, comparing the revenue generated from marketing efforts to the cost of those efforts.
6. Campaign Performance Metrics: the performance of individual marketing campaigns, including metrics such as click-through rates, conversion rates, and cost per acquisition.
7. Social Media Marketing Metrics: the engagement metrics on social media platforms, such as likes, shares, comments, and follower growth.
8. Email Marketing Metrics: email open rates, click-through rates, conversion rates, and unsubscribe rates to assess the effectiveness of email campaigns.
9. SEO Metrics: keyword rankings, organic traffic, and backlink metrics to assess the effectiveness of search engine optimization efforts.
10. Marketing Funnel Metrics: metrics at each stage of the marketing funnel, from awareness to conversion, to identify areas for improvement and optimize the customer journey.
11. Data Visualization: charts, graphs, and other visualizations to make data more digestible and actionable for stakeholders.
You should always customize your marketing dashboard based on your specific marketing goals, target audience, and marketing channels you or your clients use.
What channels can you connect to a Whatagraph online dashboard?
You can connect over 45 popular marketing platforms via fully managed integrations. These include Google Analytics 4, social media like Facebook, LinkedIn, and Instagram, PPCs like Google Ads (Adwords), email marketing apps like Klaviyo and Mailchimp, e-commerce platforms like Shopify and BigCommerce, and CRMs like HubSpot and Salesforce.
In addition, you can connect any data source you have via a Custom API or by exporting data to Google Sheets or BigQuery and adding them as a source.
With Whatagraph, you can connect more channels to one dashboard and have, for example, a hybrid web analytics dashboard and email marketing dashboard in a single display or different tabs.
Can you export data from Whatagraph?
You can export data from Whatagraph as CSV files or Excel spreadsheets.
How can you share a Whatagraph dashboard?
The best way to share a Whatagraph dashboard is via a live link for on-demand access. This way, your clients or stakeholders can always be in the loop with the key marketing metrics by looking at near-real time data. They can hover over individual widgets to reveal more data or change the date range to compare the results from different periods.
Alternatively, if your clients prefer static PDF reports that can be archived, you can automate sending via scheduled emails.