Comprehensive SaaS Dashboard for all SaaS Founders
Our SaaS dashboard is a solution for SaaS founders. It consolidates and visualizes the most important SaaS metrics like MRR, churn, CAC, LTV and everything else you need to keep your eyes on. Our all-inclusive platform will connect and pull data from any of your marketing, PPC, CRM, or web analytics platforms. Track your key metrics to find out how your SaaS product is performing and how you’re growing your customer base.
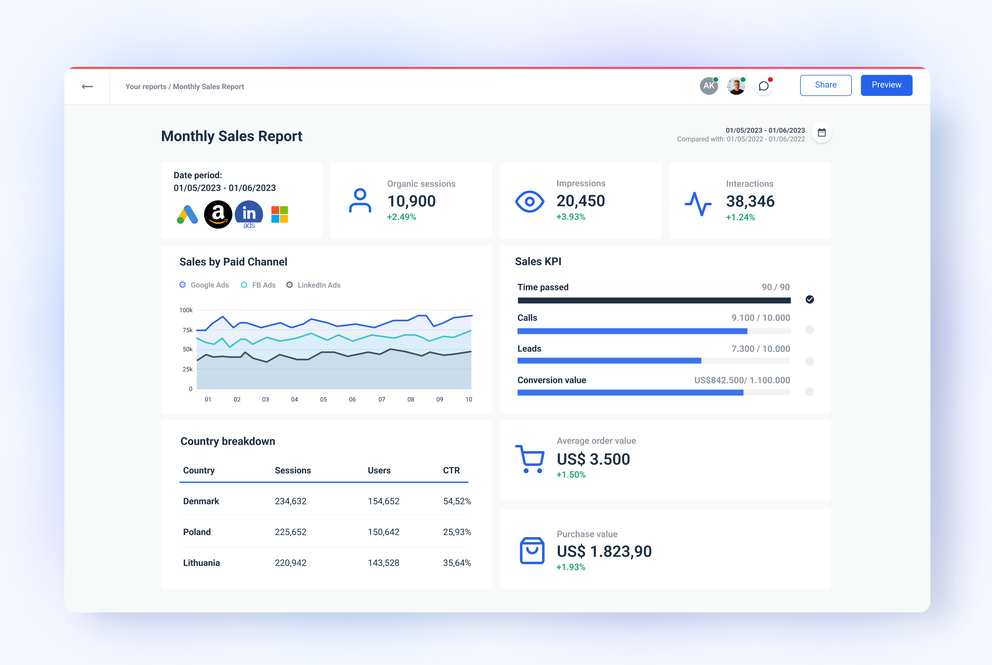


Track Essential SaaS Business Metrics with a SaaS Dashboard build with Whatagraph
SaaS Business Development Metrics
Access a panoramic view of your SaaS company’s metrics. Our dashboards present MRR, ARPU, customer lifetime value, customer acquisition costs, and more. Delve deeper into your SaaS performance and develop your strategies for each growth channel.
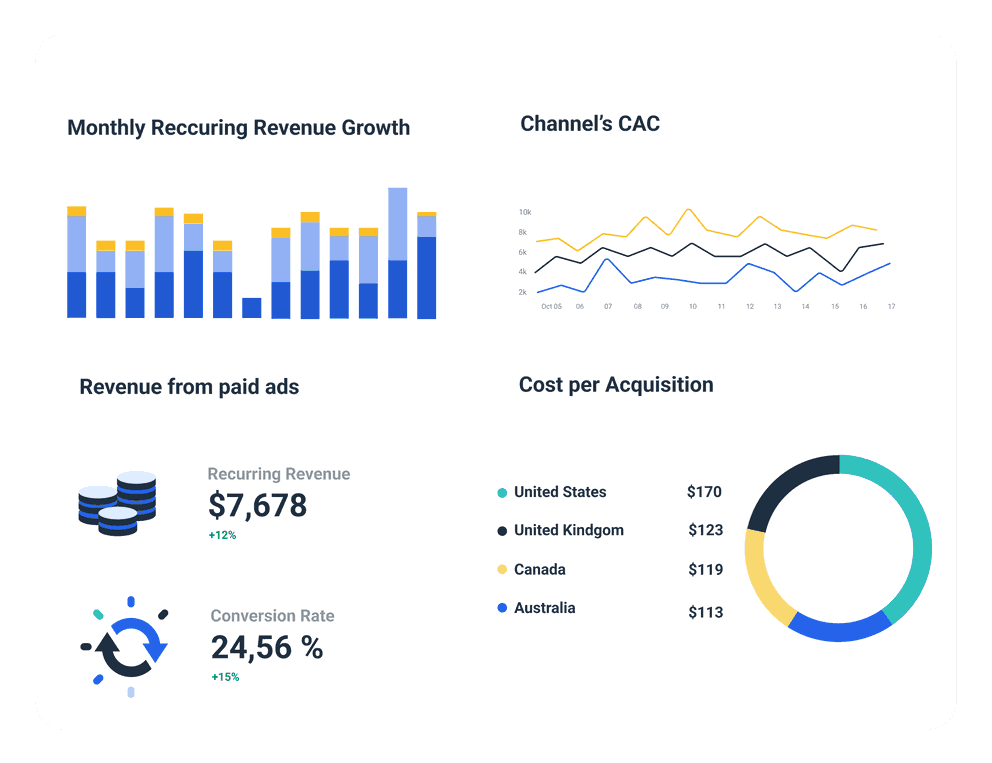
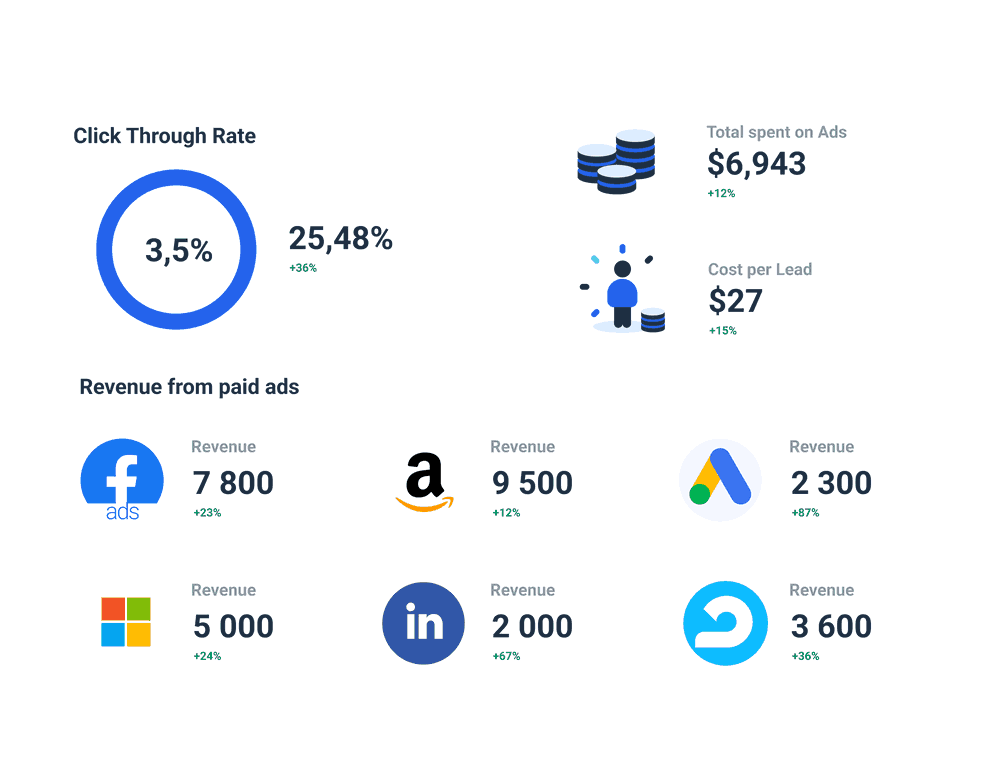
Analyze The Impact of Marketing Channels on Your SaaS Business
Want to learn how your specific marketing channels are performing? The Whatagraph SaaS dashboard will provide even more info. Create a dashboard using Whatagraph and see which channels are driving new customers, where your CAC is going, what’s causing churn and what you can do to improve your overall performance.
SaaS Dashboard With Valuable CRM Integrations
Connect your CRM to Whatagraph to access key data about your customers in real-time. Find out which customers sign up, how they move throughout the sales funnel and more. Stay in touch with them throughout their customer journey and ensure you increase MRR while reducing churn.
All reporting features your agency needs


Frequently Asked Questions
What metrics should be tracked with a SaaS Dashboard?
The specific metrics you choose will depend on your business goals. However, these are the most common SaaS metrics you can choose to track in Whatagraph’s dashboard:
- CAC;
- Customer churn;
- MRR;
- Customer lifetime value;
- CAC: LTV ratio
What platforms does Whatagraph integrate with that are relevant for a SaaS business?
Salesforce; HubSpot; Google Analytics; Ahrefs; Mailchimp; SEMrush.
How frequently does the data get refreshed on a SaaS Dashboard built with Whatagraph?
Whatagraph’s dashboards offer the most up-to-date real-time data. Meaning, that whenever you open a SaaS dashboard, you don’t need to do anything but analyze the data provided.
It’s good to be loved! Our clients are not shy about expressing it.
I made a switch from GDS and Sheets for reporting to Whatagraph, and I am saving literal hours each week on performance report creation. Our small firm actually managed to onboard 2 new clients as a result of all the time we saved on managing data and reporting. The customer service is also really helpful and easy to reach.

Capterra verified review by
Mindaugas S., Marketing Consultant
Having active customer support to help fix any issues was a big contributor, but we also really liked the ability to save templates and connect sources to multiple charts/widgets at once without having to edit them individually. And having the grid layout is much easier to stay consistent with than the free form setup that Data Studio has.

Capterra verified review by
Nico T., Media Planner
The system has standard templates that are easy and fast to use. Also you can build your own report with lightning speed. It is very easy to use, has a lot of integration, and let get started very fast.

Capterra verified review by
Rasmus Bernt K., External Senior Management Consultant
We love Whatagraph - we would definitely recommend and our account manager is great! I love how easy this tool is to use, everyone on the team finds it much more user-friendly than other dashboards. Integration was easy, we sent some example reports to the team who duplicated these for us. We literally had to log in and send it to our clients!

Capterra verified review by
Stephanie S., Digital Director
We are showing our clients the work that we're doing for them and this is incredibly important for our clients ROI. They want to see results and having a tool like Whatagraph that can show data from virtually every source we use is hugely important.

Capterra verified review by
John S., SEO Strategist
The tool is easy to use; you do not need to have development resources. Even my junior project managers are capable of making campaign reports in minutes. There are a lot of pre-made templates you can use as well as many pre-made widgets.

Capterra verified review by
Erman E., Marketing Specialist
Really easy to connect data sources within the tool. The library of report templates has been helpful. The customer support team has been responsive to all of our needs. Our team enjoys the simplicity of setting up the reports and how the data is presented.

Capterra verified review by
Brent N., Director of Operations
Easy to create really beautiful graphs and reports which can help other team members to understand the most important takeaways. I especially like the automated report function, so I don't have to check on the same thing repeatedly.

Capterra verified review by
Orsolya S., Online Marketing Manager