Salesforce Reporting and Dashboards
Is your sales team using Salesforce to connect with potential clients and you are looking for a tool to leverage customer data? Whatagraph lets you manage sales reps and your customer relationship by optimizing your sales processes with our Salesforce reporting and dashboards.
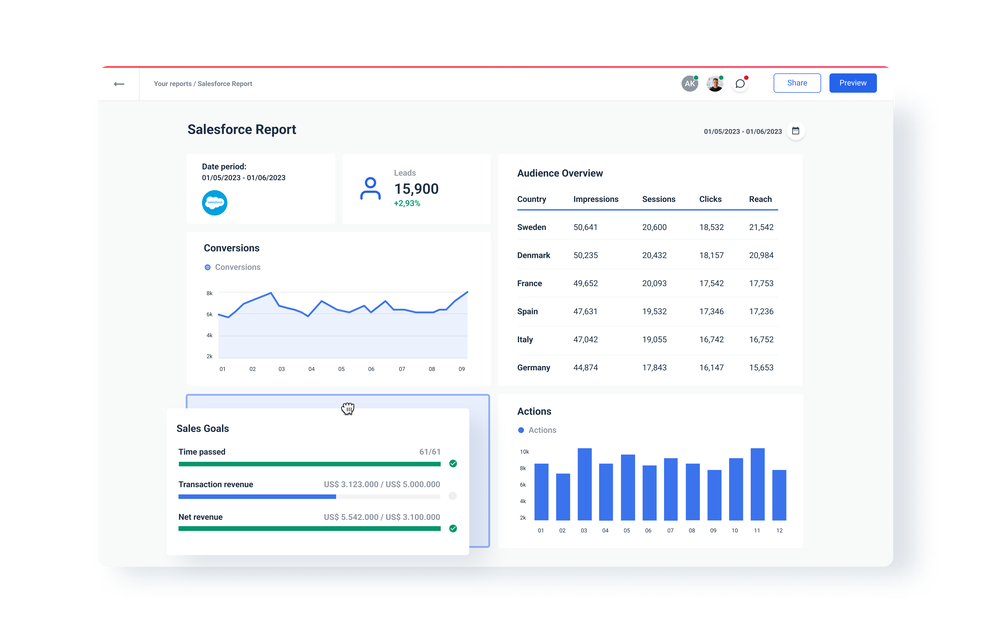


Most comprehensive Salesforce dashboard and reports made with Whatagraph
Display all your Salesforce key metrics and KPIs with data visualization
Increase the number of demos booked and improve your sales performance by showcasing real-time data with our sales dashboard. View Salesforce data by utilizing dashboard components like bar charts, or implementing any other chart types. Instantly provide accurate and engaging reports to your sales managers about the progress of your sales pipeline and sales reps.
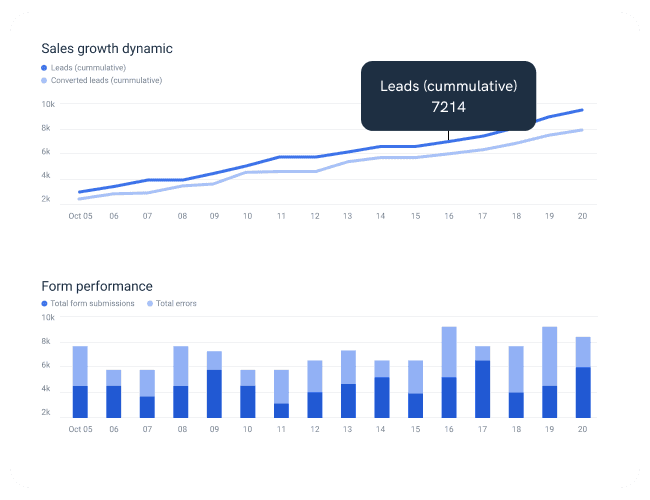
Use our report or dashboard builder to get more out of your CRM
Connect the data sources you need and take advantage of Whatagraph's greatest functionalities. Improve your customer relationships by learning about their patterns and trends. Take use of our automated feature to receive timely information in your mailbox. Create Salesforce pipeline reports and dashboards based on required date fields and have your customer's analysis ready in no time.
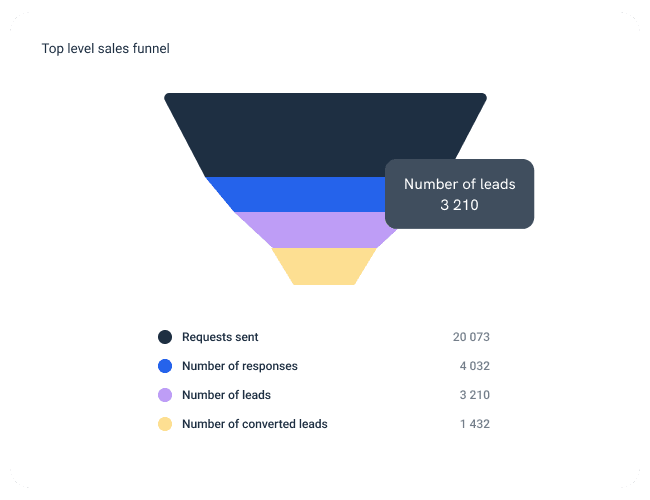
Fill up your sales pipeline with a sales funnel dashboard
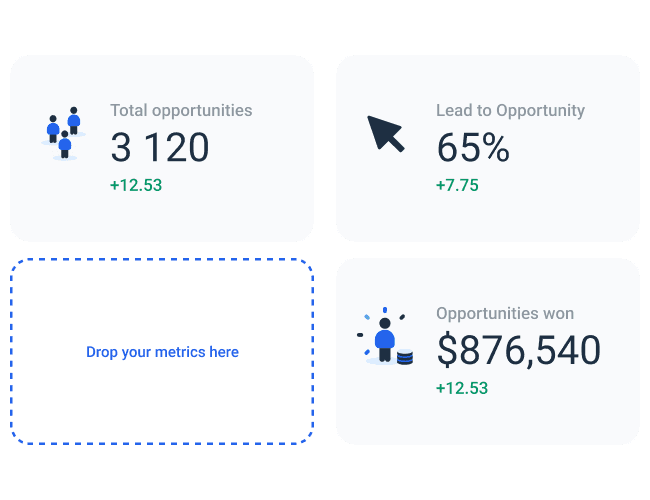
Leverage historical data, cross-platform reporting, and dynamic dashboards to access client data and better predict your sales numbers. Create a new dashboard and learn about your lead sources, won opportunities, response rate and more. Salesforce, a marketing cloud, provides huge volumes of data that Whatagraph can easily aggregate for any marketer or salesperson.
All reporting features your agency needs


Frequently Asked Questions
What are Salesforce reports and dashboards?
Salesforce reports and dashboards are documents that monitor and track sales funnel and sales process data. These docs usually include metrics like won and all opportunities, number of leads and more
The biggest difference between the two is the fact that dashboards only pull real-time data and reports manage historical and real-time data.
How do I create a Salesforce template?
It's so simple! It'll only take you three steps.
- When you've finished building a report that you like, click 'Done editing.'
- Choose the 'Save as template' icon.
- When you generate your next report, look for your new template under 'Team templates’.
You’re all set!
What are Salesforce marketing dashboards used for?
Salesforce dashboards allow your marketing team to design appealing marketing campaigns and your sales team to better analyze data, gain new insights, and sell smarter.
Salesforce campaign dashboards are one of the most important resources on the platform because of their user-friendly design and adaptability. Individuals can benefit from these real-time metrics and make data-driven decisions to improve them:
- Open opportunities by created date;
- Pipeline quality metrics;
- The traditional funnel chart;
- Top pipeline customers and prospects;
- Closed won opportunities by Month;
- Pipeline deals by close date and opportunity stage;
- Long-term pipeline trends.
It’s good to be loved! Our clients are not shy about expressing it.
I made a switch from GDS and Sheets for reporting to Whatagraph, and I am saving literal hours each week on performance report creation. Our small firm actually managed to onboard 2 new clients as a result of all the time we saved on managing data and reporting. The customer service is also really helpful and easy to reach.

Capterra verified review by
Mindaugas S., Marketing Consultant
Having active customer support to help fix any issues was a big contributor, but we also really liked the ability to save templates and connect sources to multiple charts/widgets at once without having to edit them individually. And having the grid layout is much easier to stay consistent with than the free form setup that Data Studio has.

Capterra verified review by
Nico T., Media Planner
The system has standard templates that are easy and fast to use. Also you can build your own report with lightning speed. It is very easy to use, has a lot of integration, and let get started very fast.

Capterra verified review by
Rasmus Bernt K., External Senior Management Consultant
We love Whatagraph - we would definitely recommend and our account manager is great! I love how easy this tool is to use, everyone on the team finds it much more user-friendly than other dashboards. Integration was easy, we sent some example reports to the team who duplicated these for us. We literally had to log in and send it to our clients!

Capterra verified review by
Stephanie S., Digital Director
We are showing our clients the work that we're doing for them and this is incredibly important for our clients ROI. They want to see results and having a tool like Whatagraph that can show data from virtually every source we use is hugely important.

Capterra verified review by
John S., SEO Strategist
The tool is easy to use; you do not need to have development resources. Even my junior project managers are capable of making campaign reports in minutes. There are a lot of pre-made templates you can use as well as many pre-made widgets.

Capterra verified review by
Erman E., Marketing Specialist
Really easy to connect data sources within the tool. The library of report templates has been helpful. The customer support team has been responsive to all of our needs. Our team enjoys the simplicity of setting up the reports and how the data is presented.

Capterra verified review by
Brent N., Director of Operations
Easy to create really beautiful graphs and reports which can help other team members to understand the most important takeaways. I especially like the automated report function, so I don't have to check on the same thing repeatedly.

Capterra verified review by
Orsolya S., Online Marketing Manager