Free Cross-Channel Analytics Report Template

Use this cross-channel analytics report template to pull all your marketing data into one place, without jumping from one tool to another.

Get actionable insights in seconds, act faster, and create stunning reports your clients will love.

Cross Channel Analytics Report Template - Marketing summary dashboard with charts and key metrics.

Create Custom Cross Channel Analytics Reports in Seconds

With Whatagraph IQ, just tell us what you need, and we'll build a stunning cross channel analytics report for you in seconds. No templates or manual setup needed.

How To Use Whatagraph’s Cross Channel Marketing Analytics Report Template

What Should a Cross Channel Analytics Dashboard Template Include

A strong cross-channel analytics report template should do four things well:

  1. Unify performance across channels
  2. Focus on business-level KPIs
  3. Make channel comparisons easy
  4. Turn data into clear next actions

At a minimum, it should start with a top-level marketing summary that pulls key metrics like spend, traffic, conversions, revenue, and return on investment into one view, so stakeholders don’t have to jump between marketing platforms.

From there, the report should break performance down by channel—SEO, paid search, paid social, organic social, email, and CRM—using consistent KPIs to show how each channel contributes to the customer journey.

Here’s what you should include in a cross channel analytics report template, according to marketers who have built cross channel reports on Whatagraph.

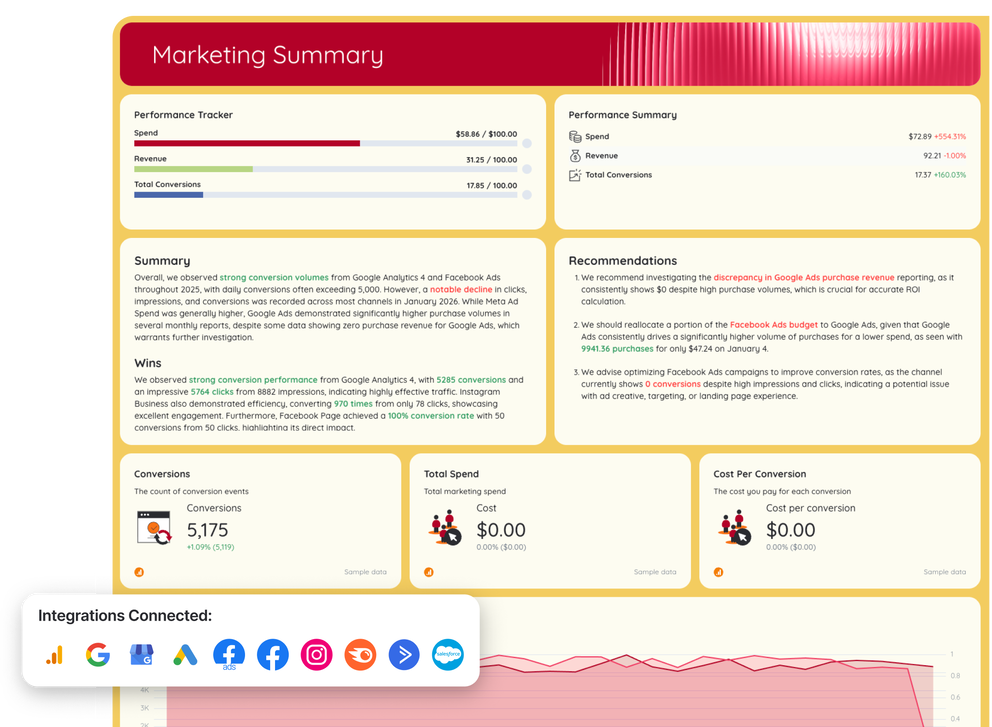
Section 1: Marketing Summary

Cross Channel Analytics - Report dashboard displaying conversion metrics and channel performance.
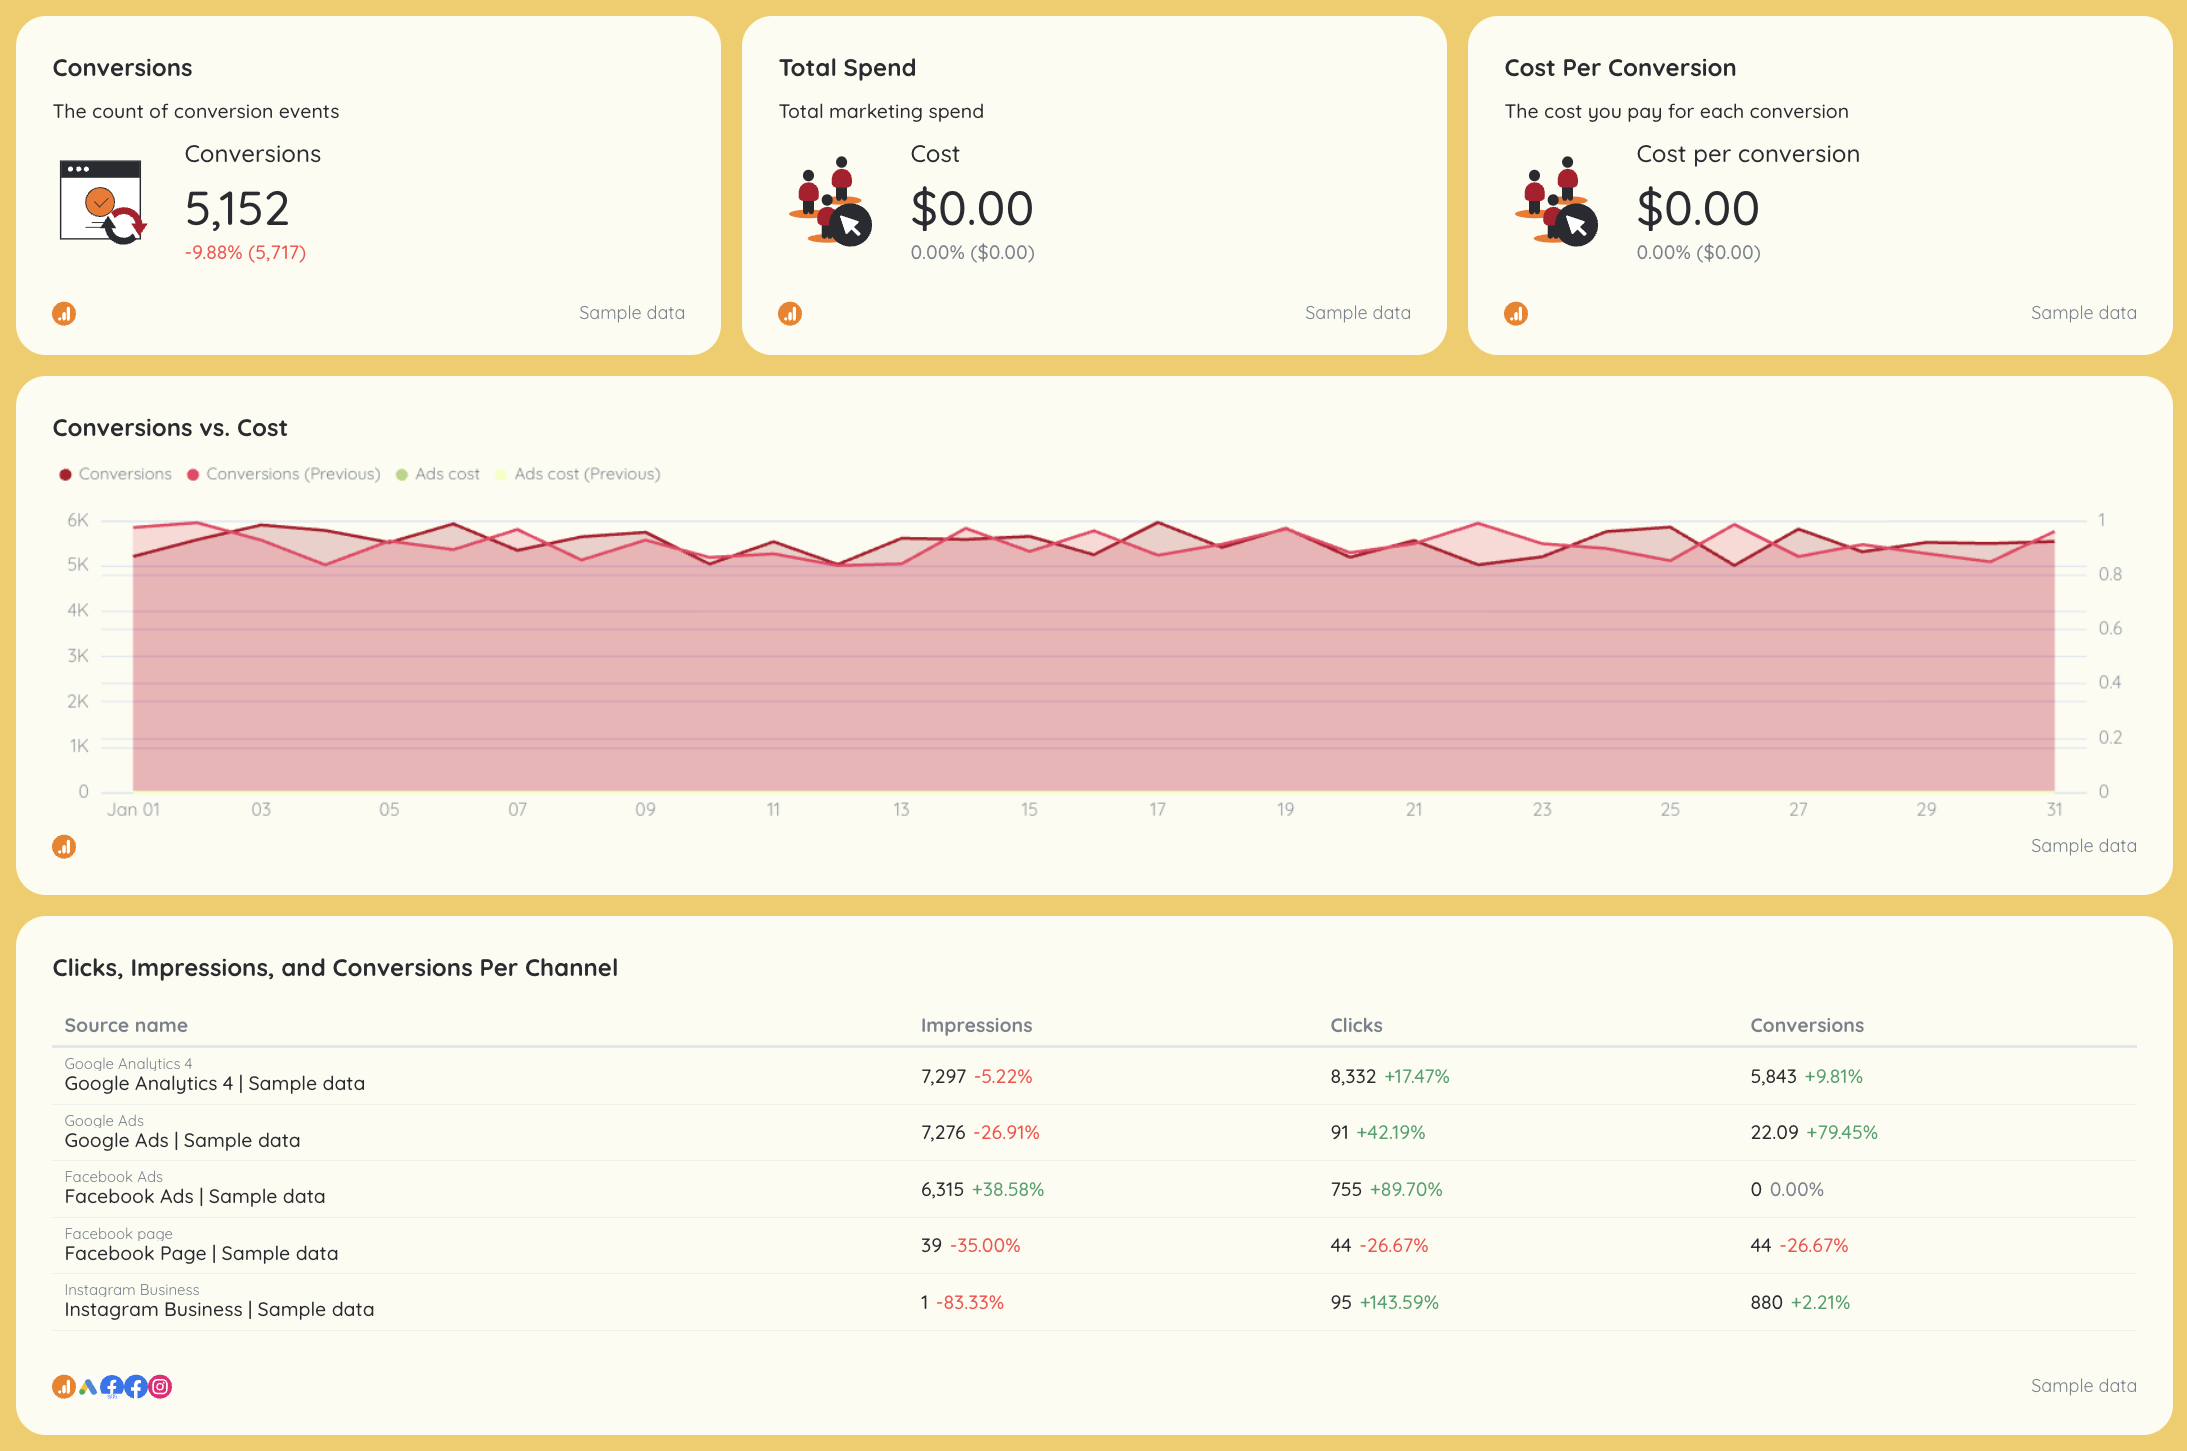
Channels connected: GA4, Google Ads, Facebook Ads, Organic Social

What it is: An executive snapshot of overall marketing performance.

Which metrics to display: Spend, conversions, revenue, CPA, ROAS, key metrics by channel.

Which charts to use: KPI scorecards, line charts, stacked bars, channel comparison tables.

Why it matters: Gives stakeholders a real-time view of marketing performance and ROI.

Section 2: Website Performance

Cross Channel Analytics Report Template - Website Performance - Dashboard with user, conversion, and session metrics.
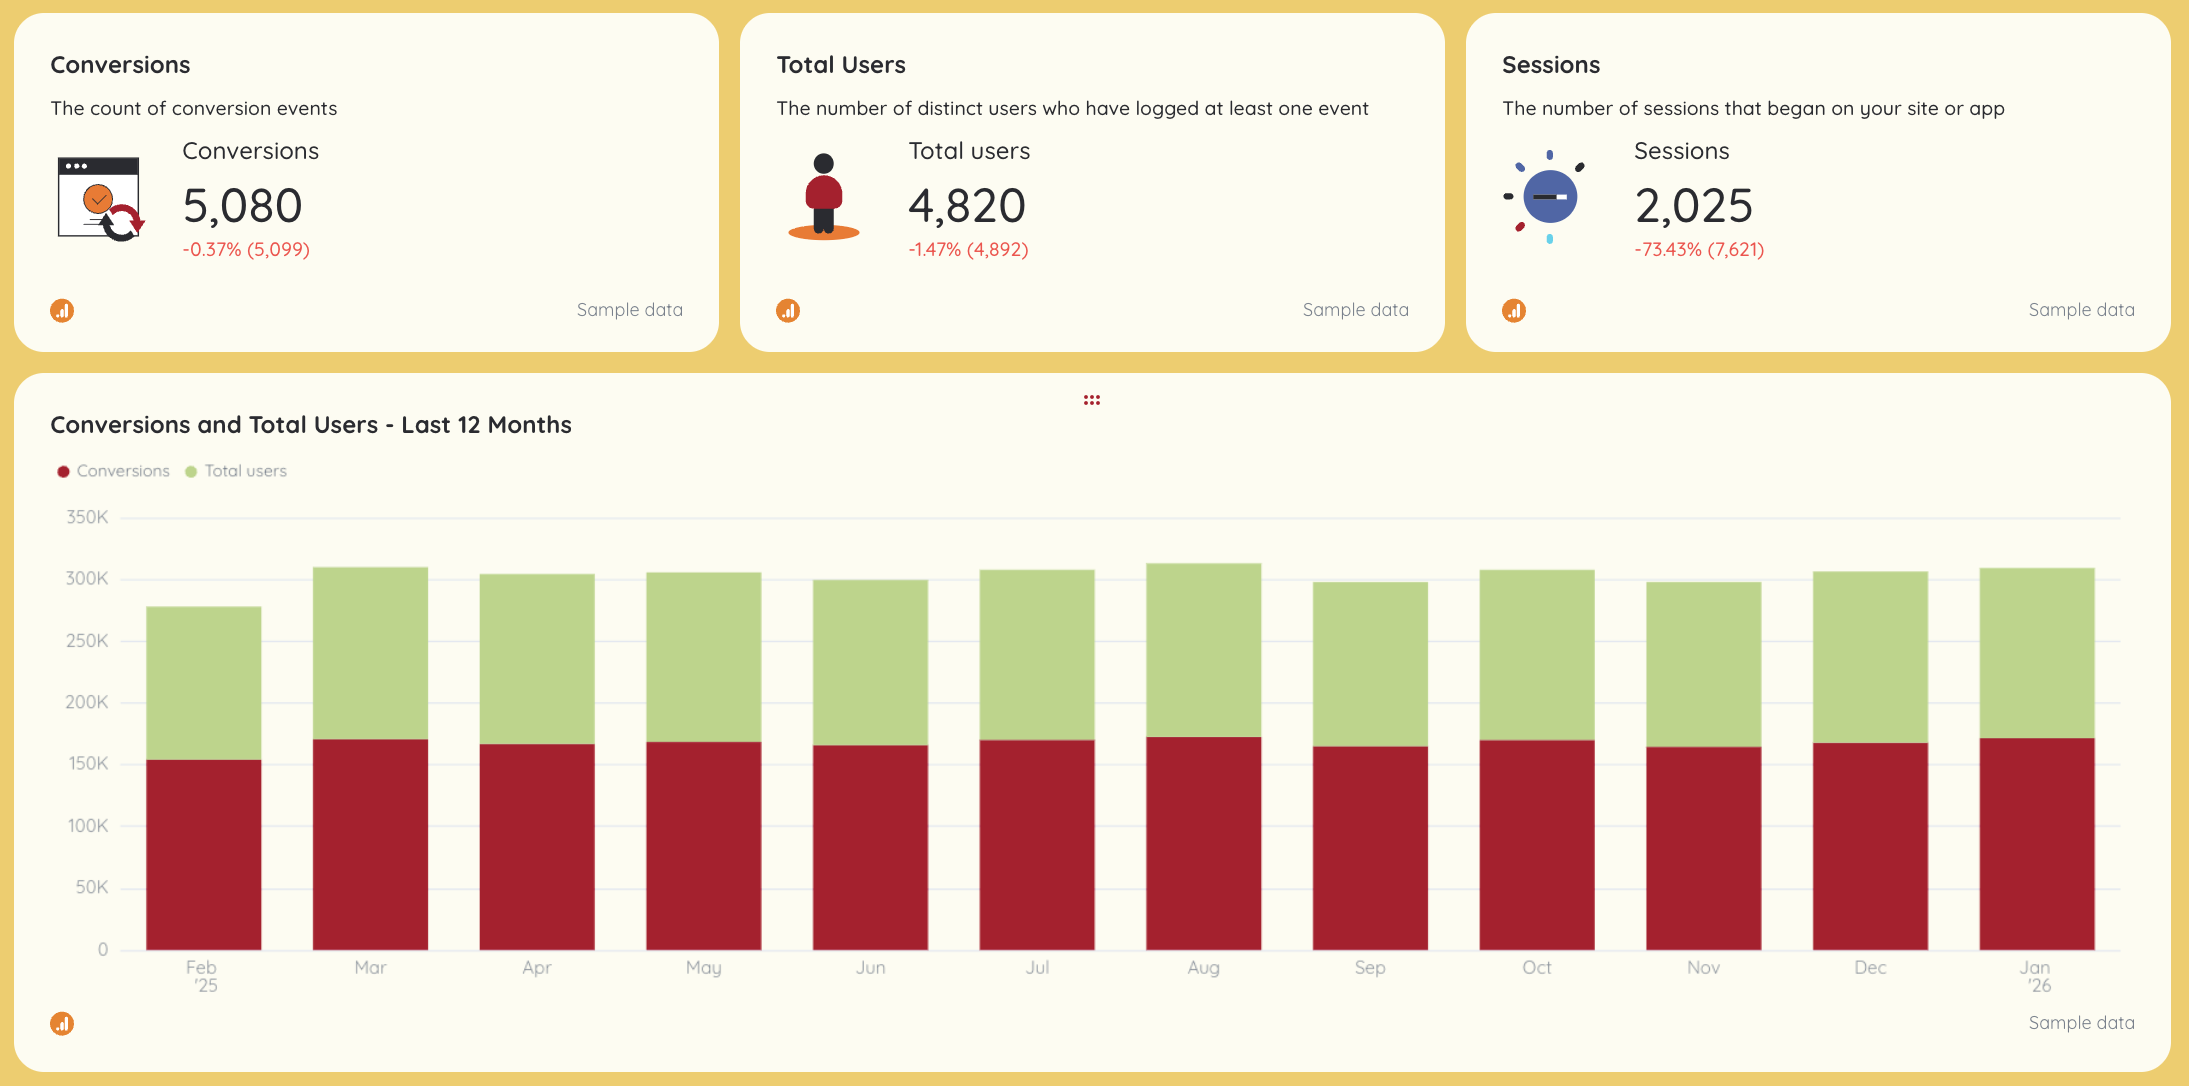
Channels connected: Google Analytics 4

What it is: Your core performance and conversion hub.

Which metrics to display: Users, sessions, conversions, conversion rate, engagement, revenue.

Which charts to use: Line charts, funnel views, landing page tables, device breakdowns.

Why it matters: Connects all marketing efforts to outcomes across the customer journey.

Section 3: SEO Performance

Cross Channel Analytics - A dashboard displaying backlinks and domain authority scores.

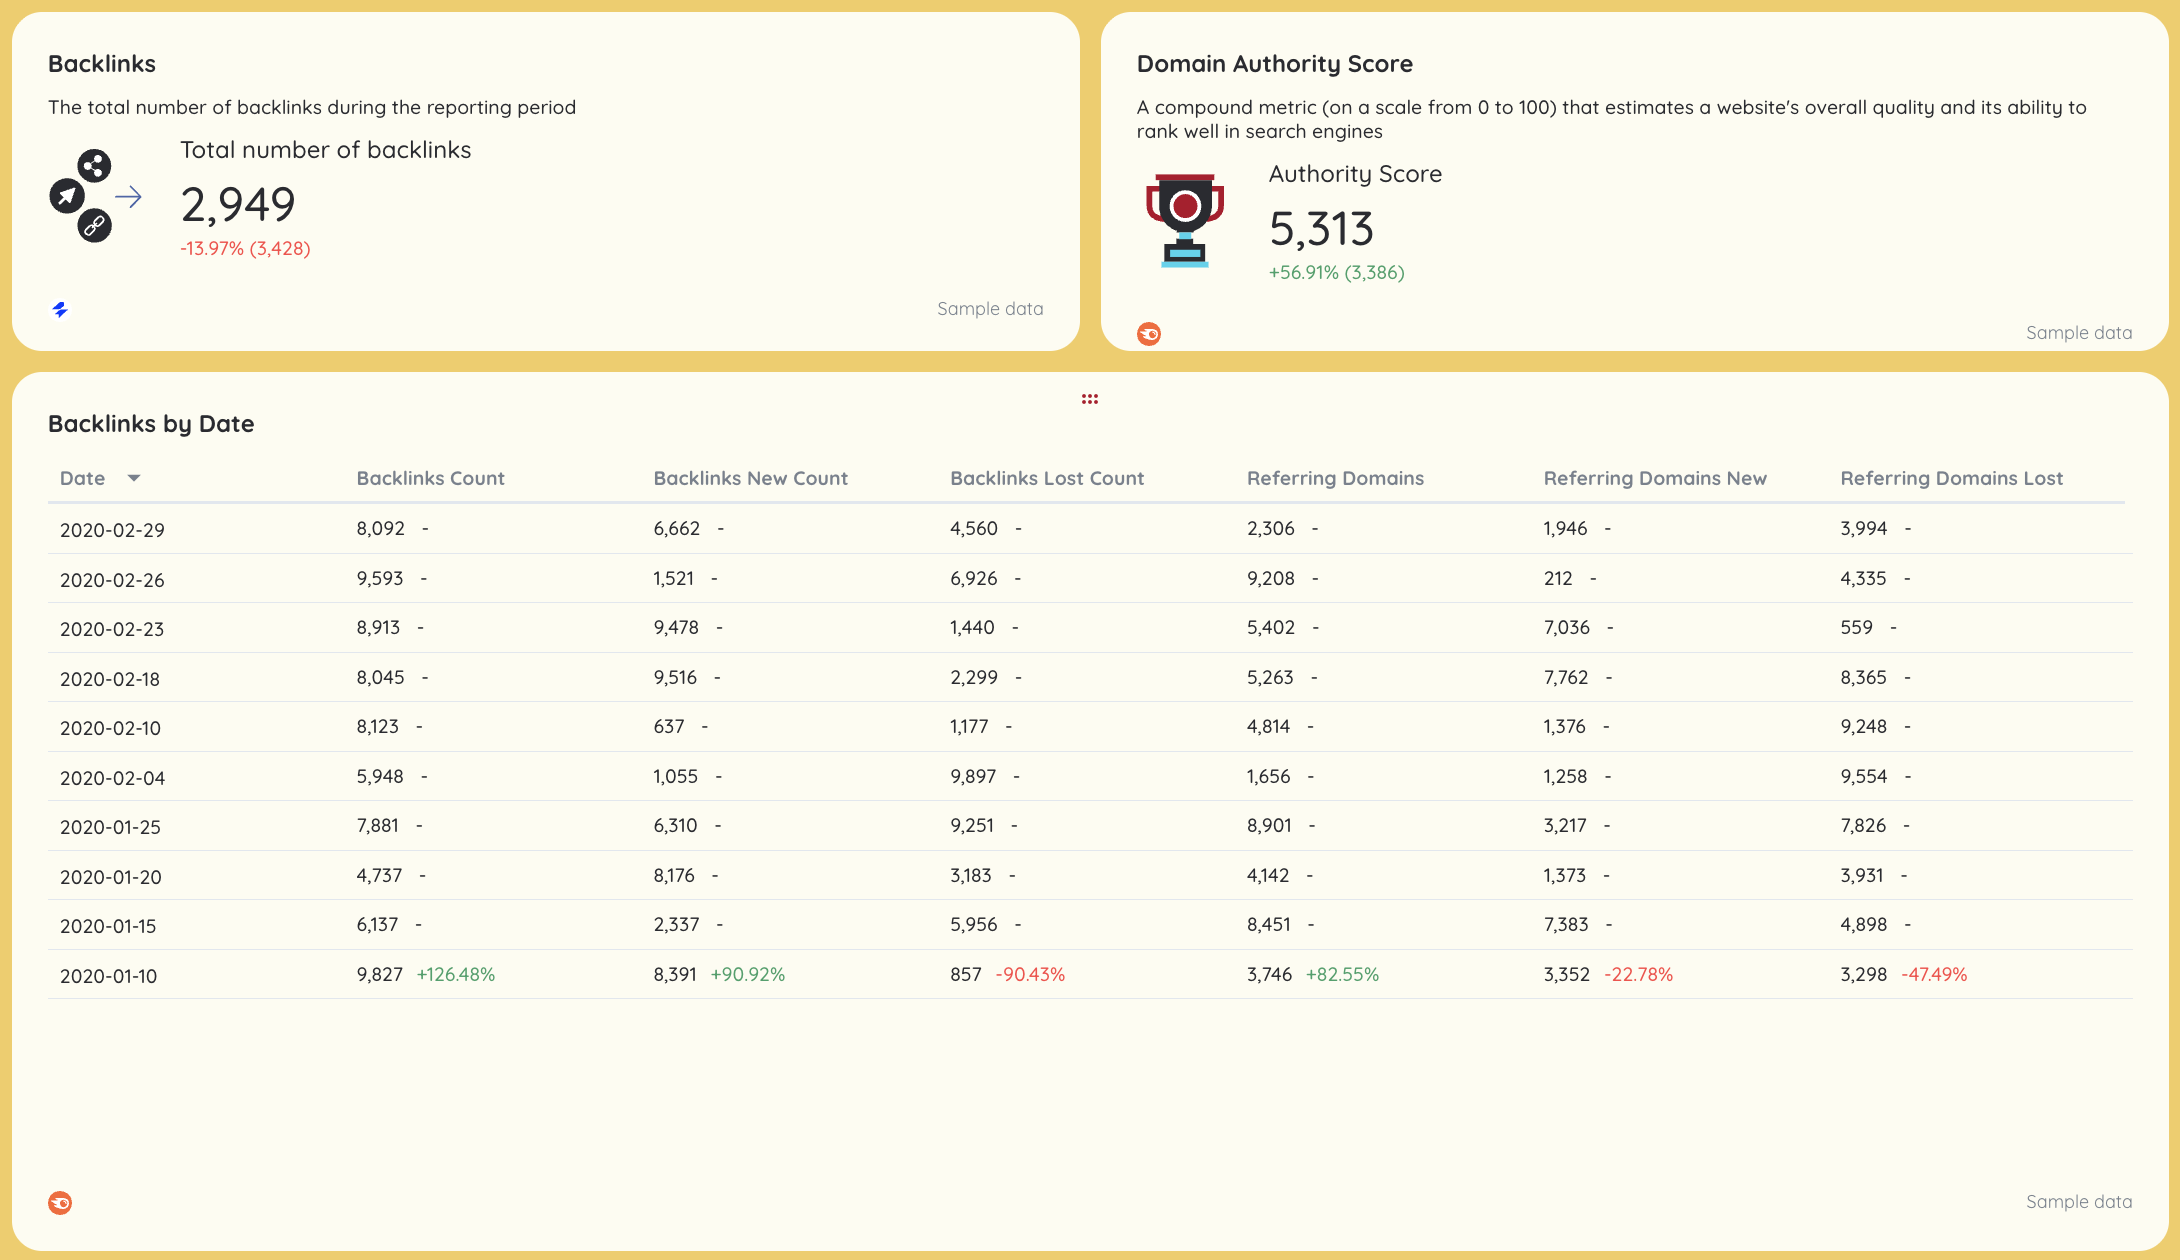
Channels connected: Google Search Console, GA4

What it is: Organic performance tied to conversions, not just traffic.

Which metrics to display: Organic sessions, CTR, average position, conversions.

Which charts to use: Trend lines, landing page tables, query tables.

Why it matters: Aligns SEO with real business impact.

Section 4: GEO Performance (AI Traffic)

Cross Channel Analytics Report Template - Dashboard featuring charts, metrics, and a table summarizing AI source data.

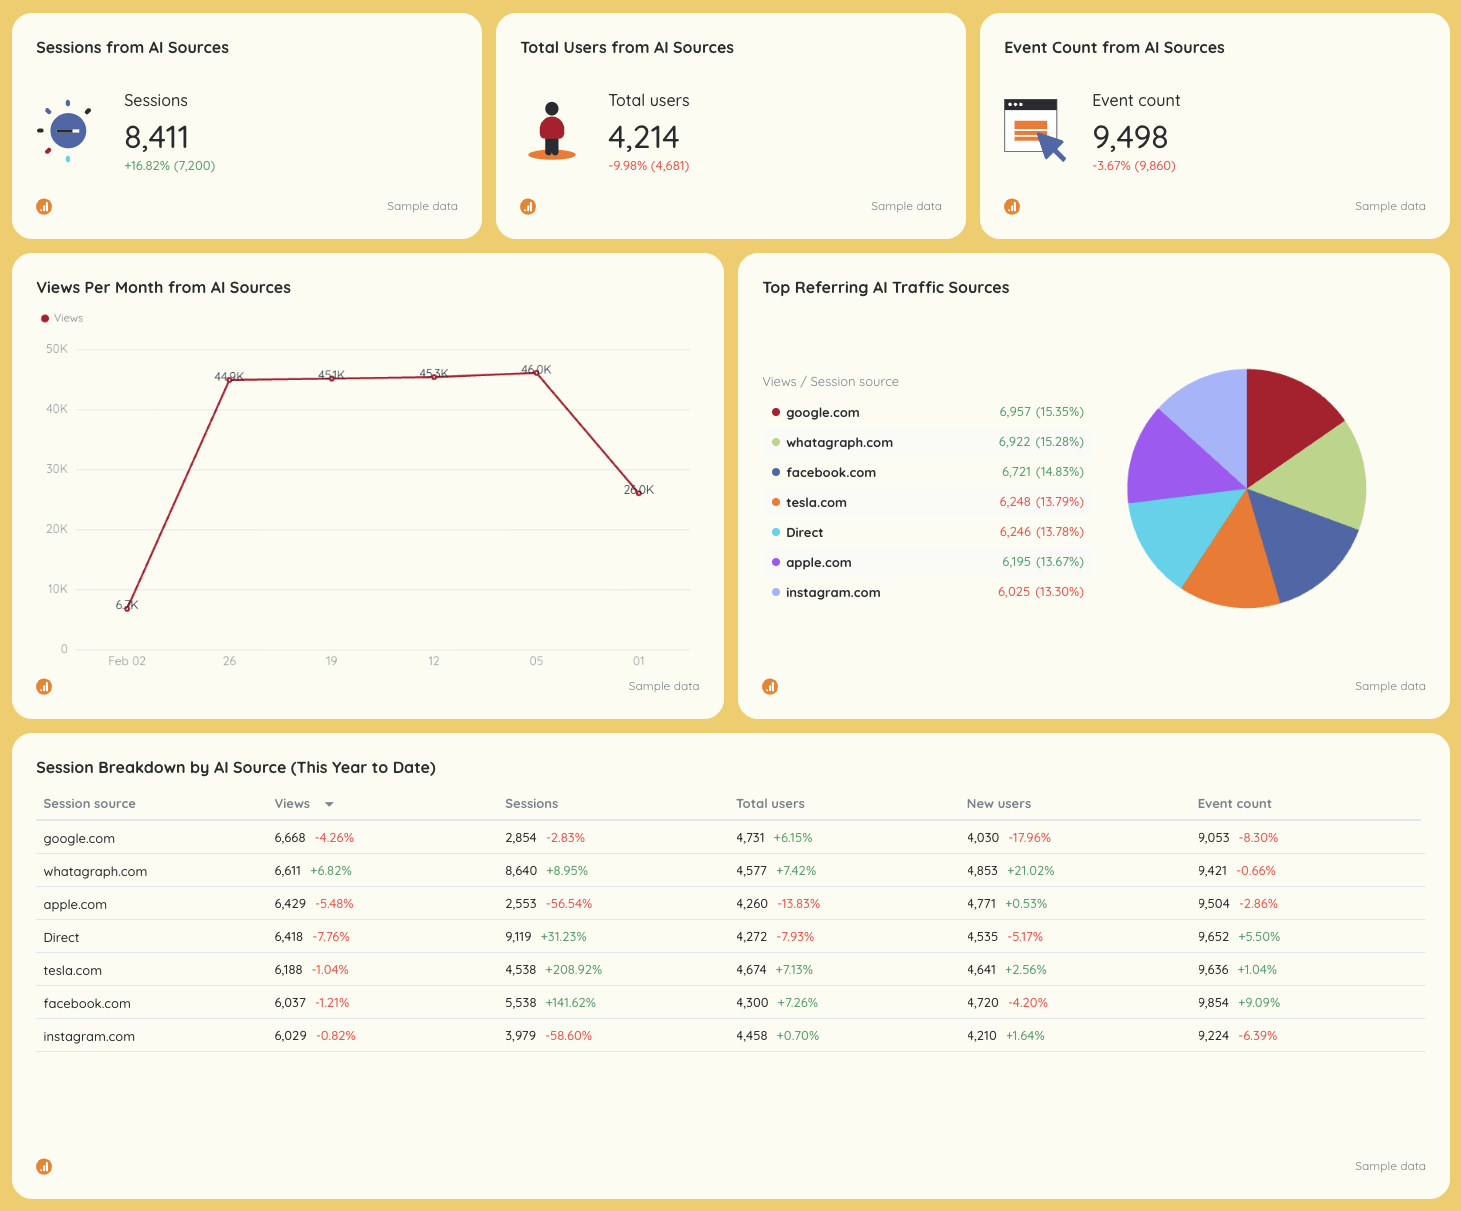
Channels connected: GA4, GSC

What it is: Visibility and traffic from AI-driven discovery platforms.

Which metrics to display: AI sessions, views, engagement, conversions.

Which charts to use: Line charts, referrer bar charts, landing page tables.

Why it matters: Tracks emerging attribution touchpoints in digital marketing.

Section 5: Keyword Rankings

Cross Channel Analytics Report - A website analytics dashboard with performance data and keyword metrics.

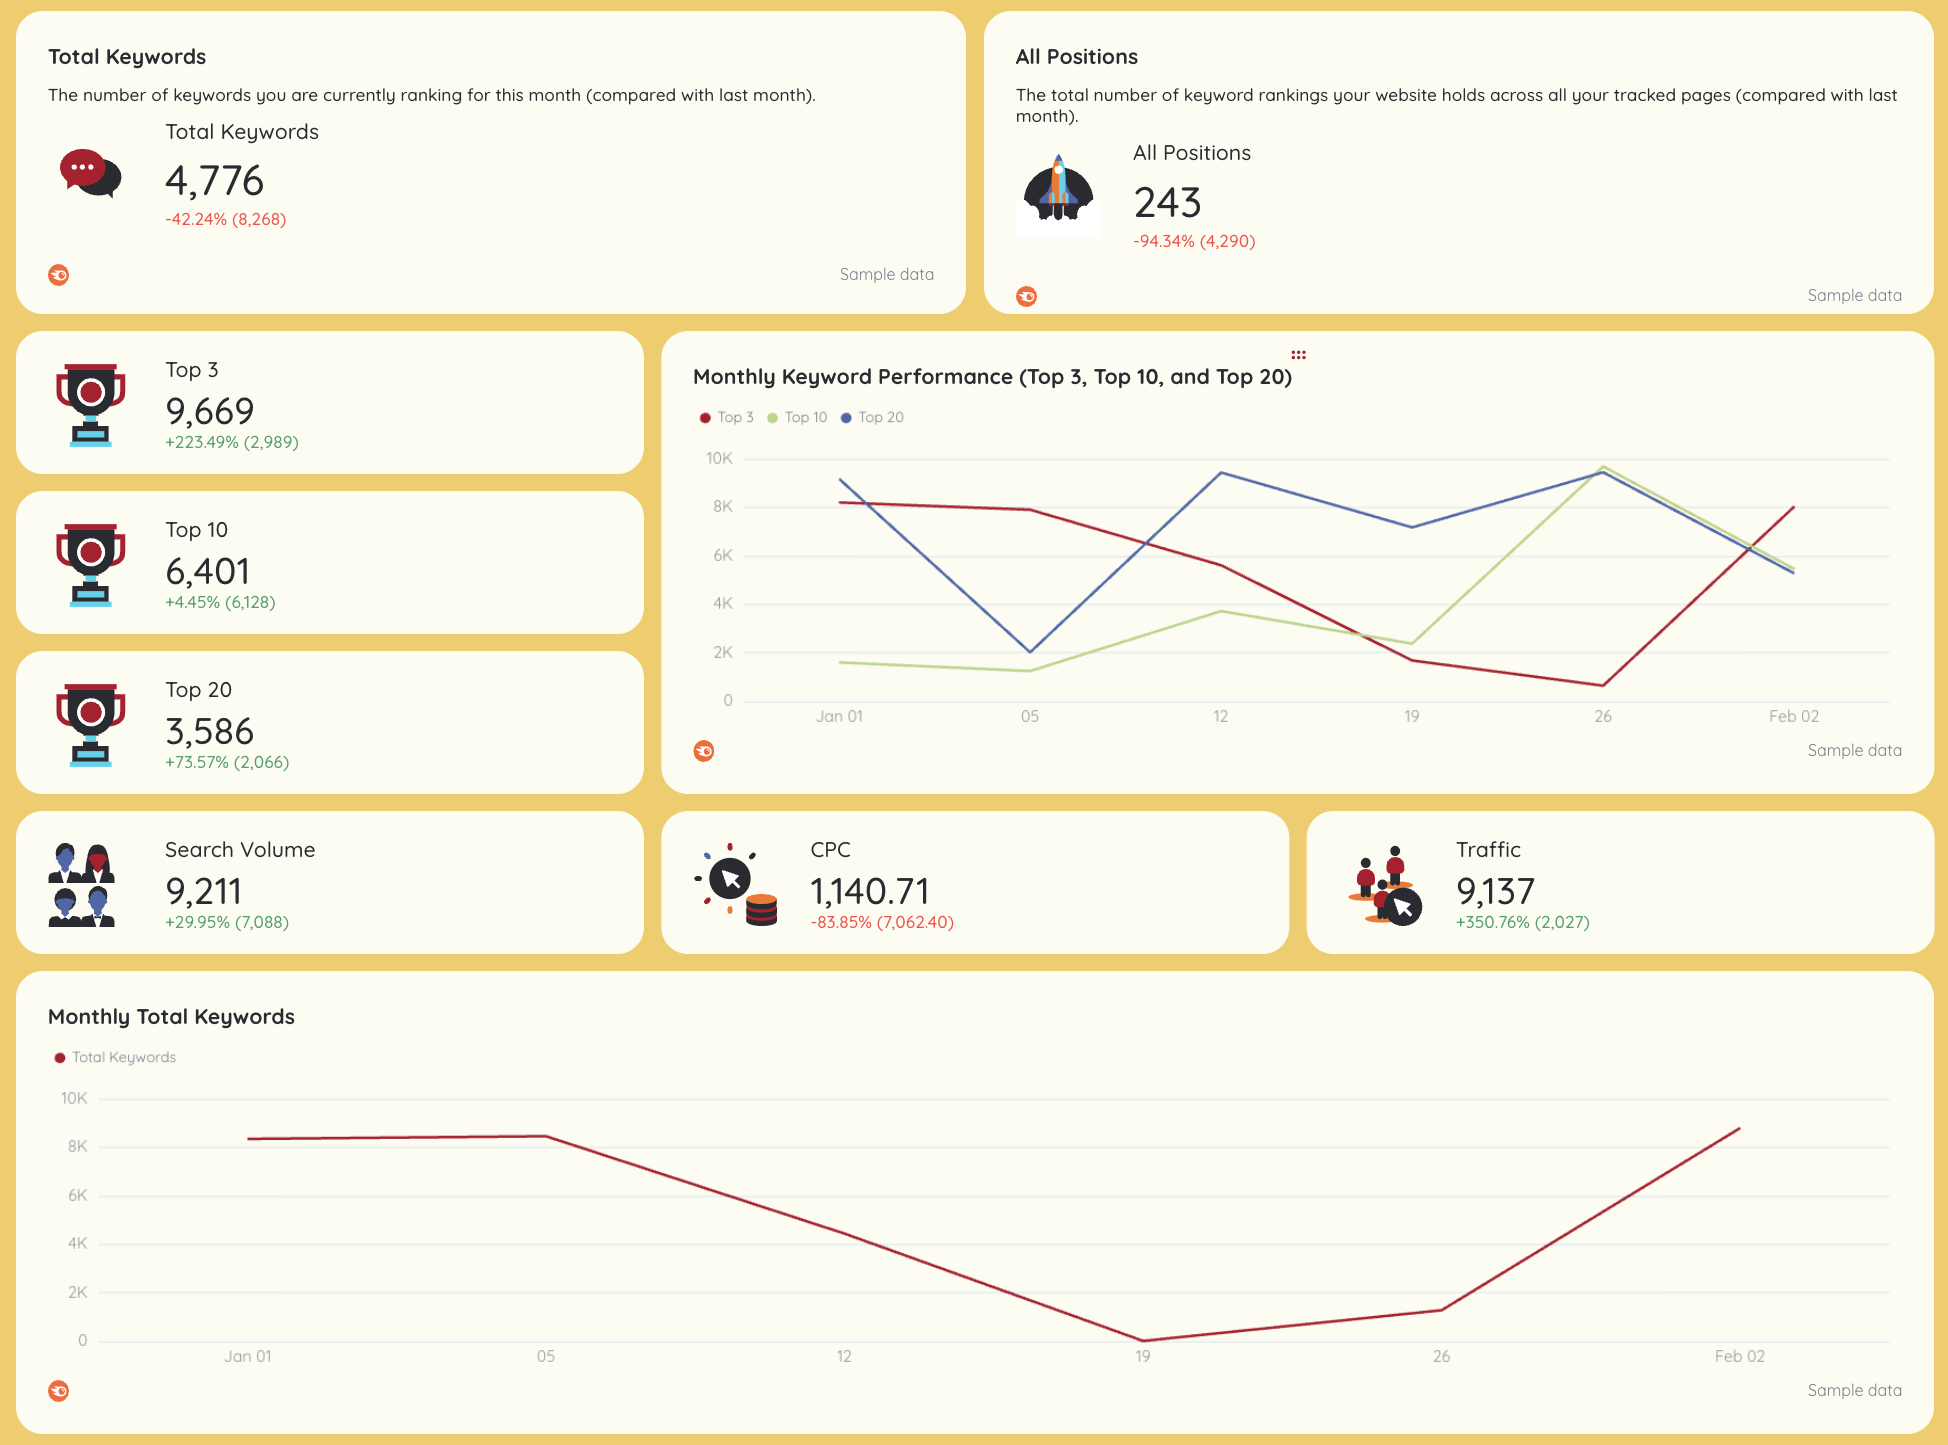
Channels connected: Semrush

What it is: Keyword visibility and opportunity tracking.

Which metrics to display: Top 3 / 10 / 20 keywords, movements, CPC, search volume.

Which charts to use: Distribution charts, trend lines, keyword tables.

Why it matters: Guides SEO priorities and PPC vs organic decisions.

Cross Channel Analytics Report - A dashboard showing website and map impression data.

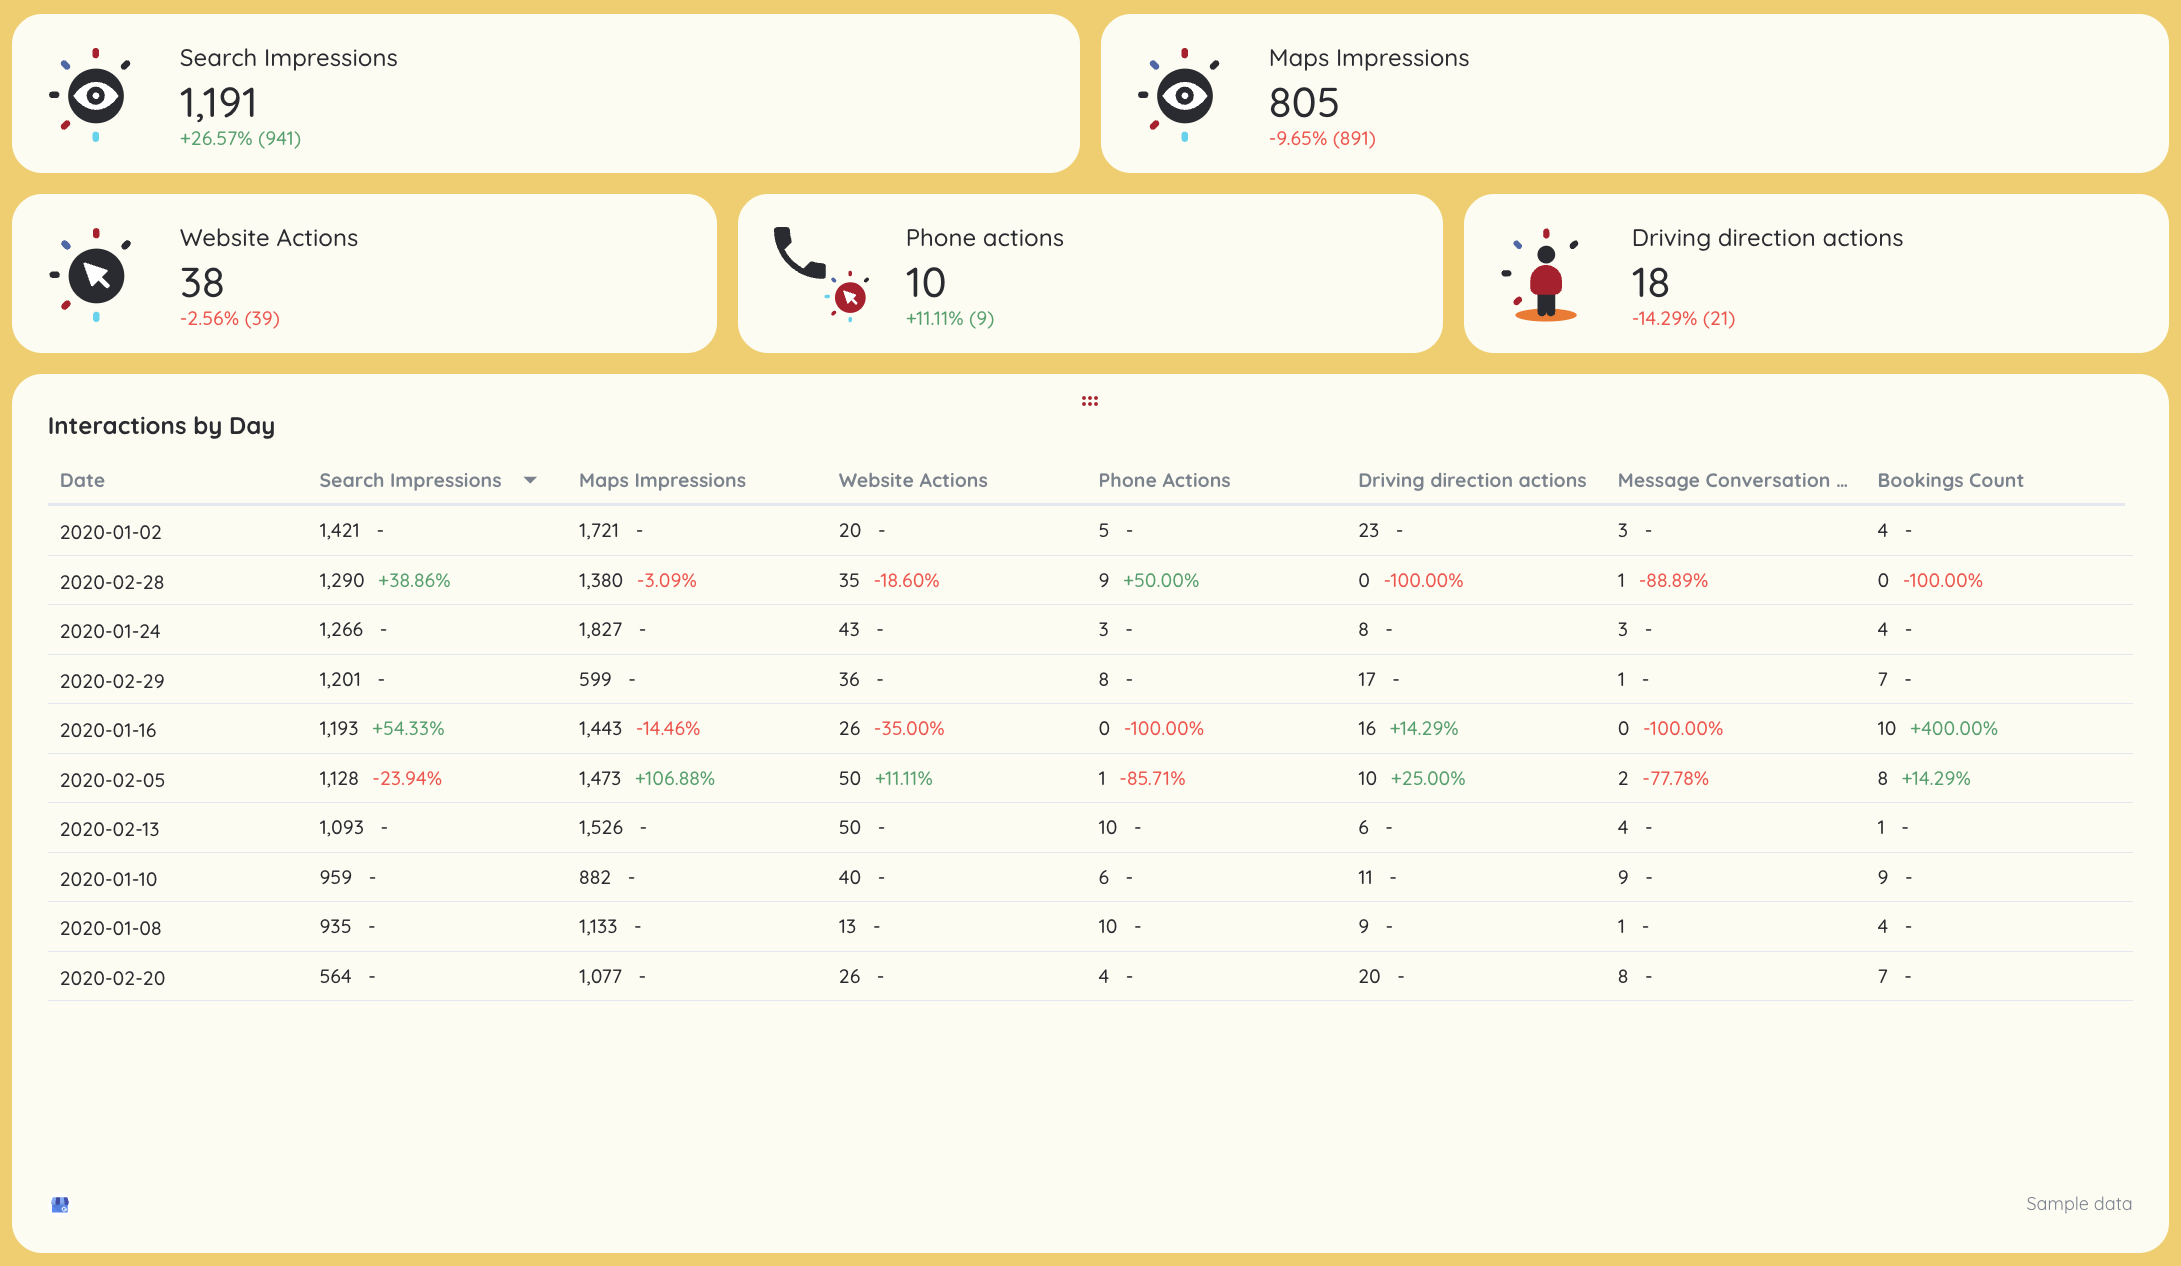
Channels connected: Google Business Profile

What it is: Local intent and offline-adjacent performance.

Which metrics to display: Maps impressions, calls, website actions, reviews.

Which charts to use: KPI cards, daily trend charts, device breakdowns.

Why it matters: Captures high-intent local engagement and trust signals.

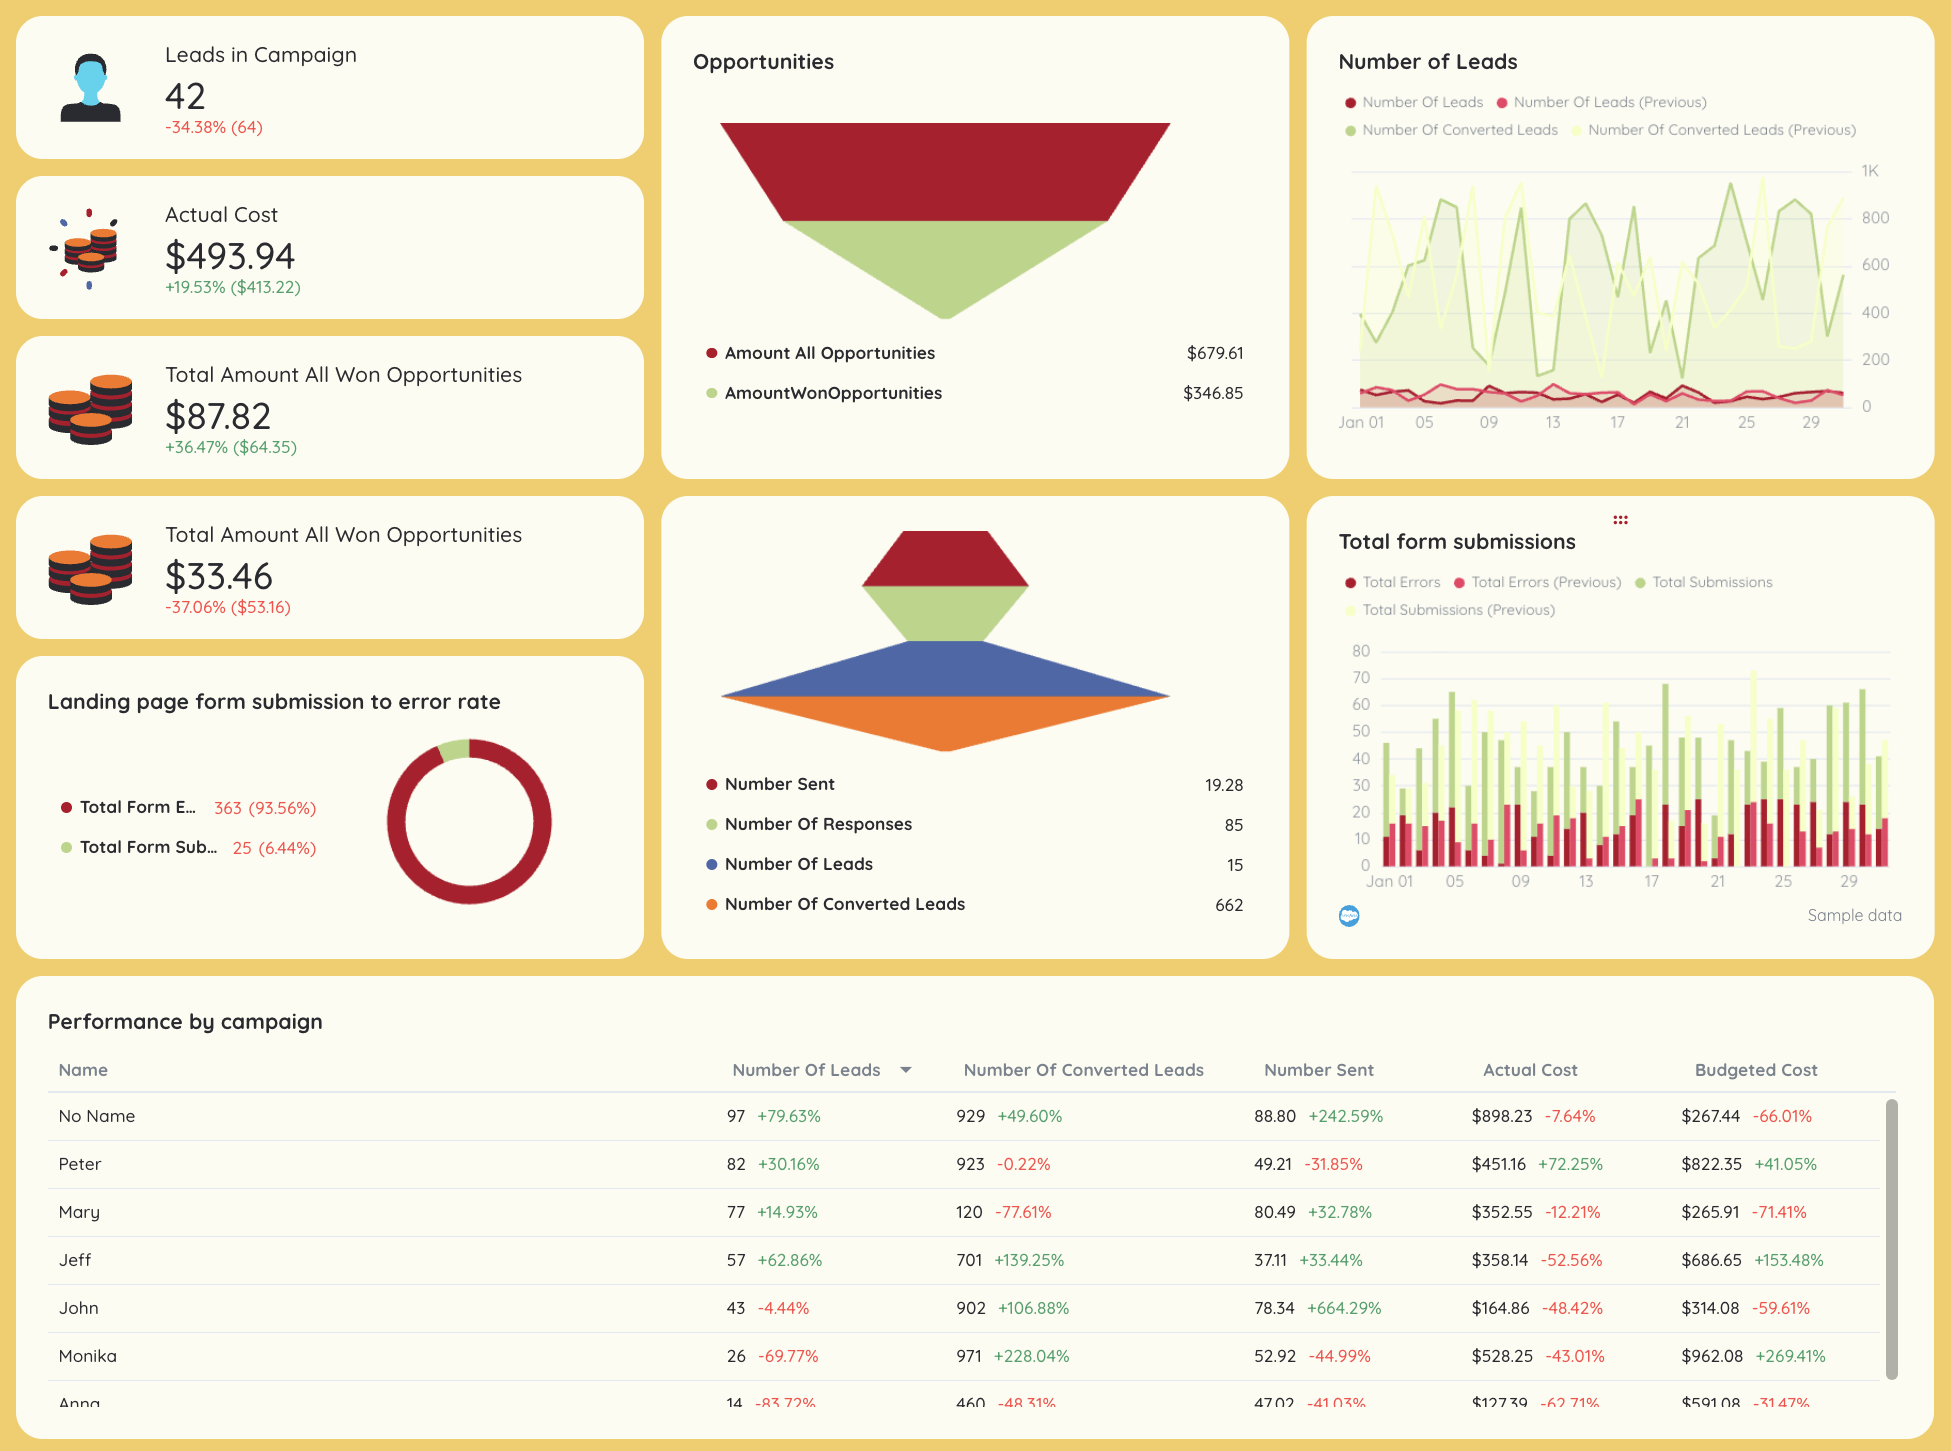
Section 7: Paid Media (Google Ads & Meta Ads)

Cross Channel Analytics - Dashboard featuring cost, impressions, clicks and conversions metrics.

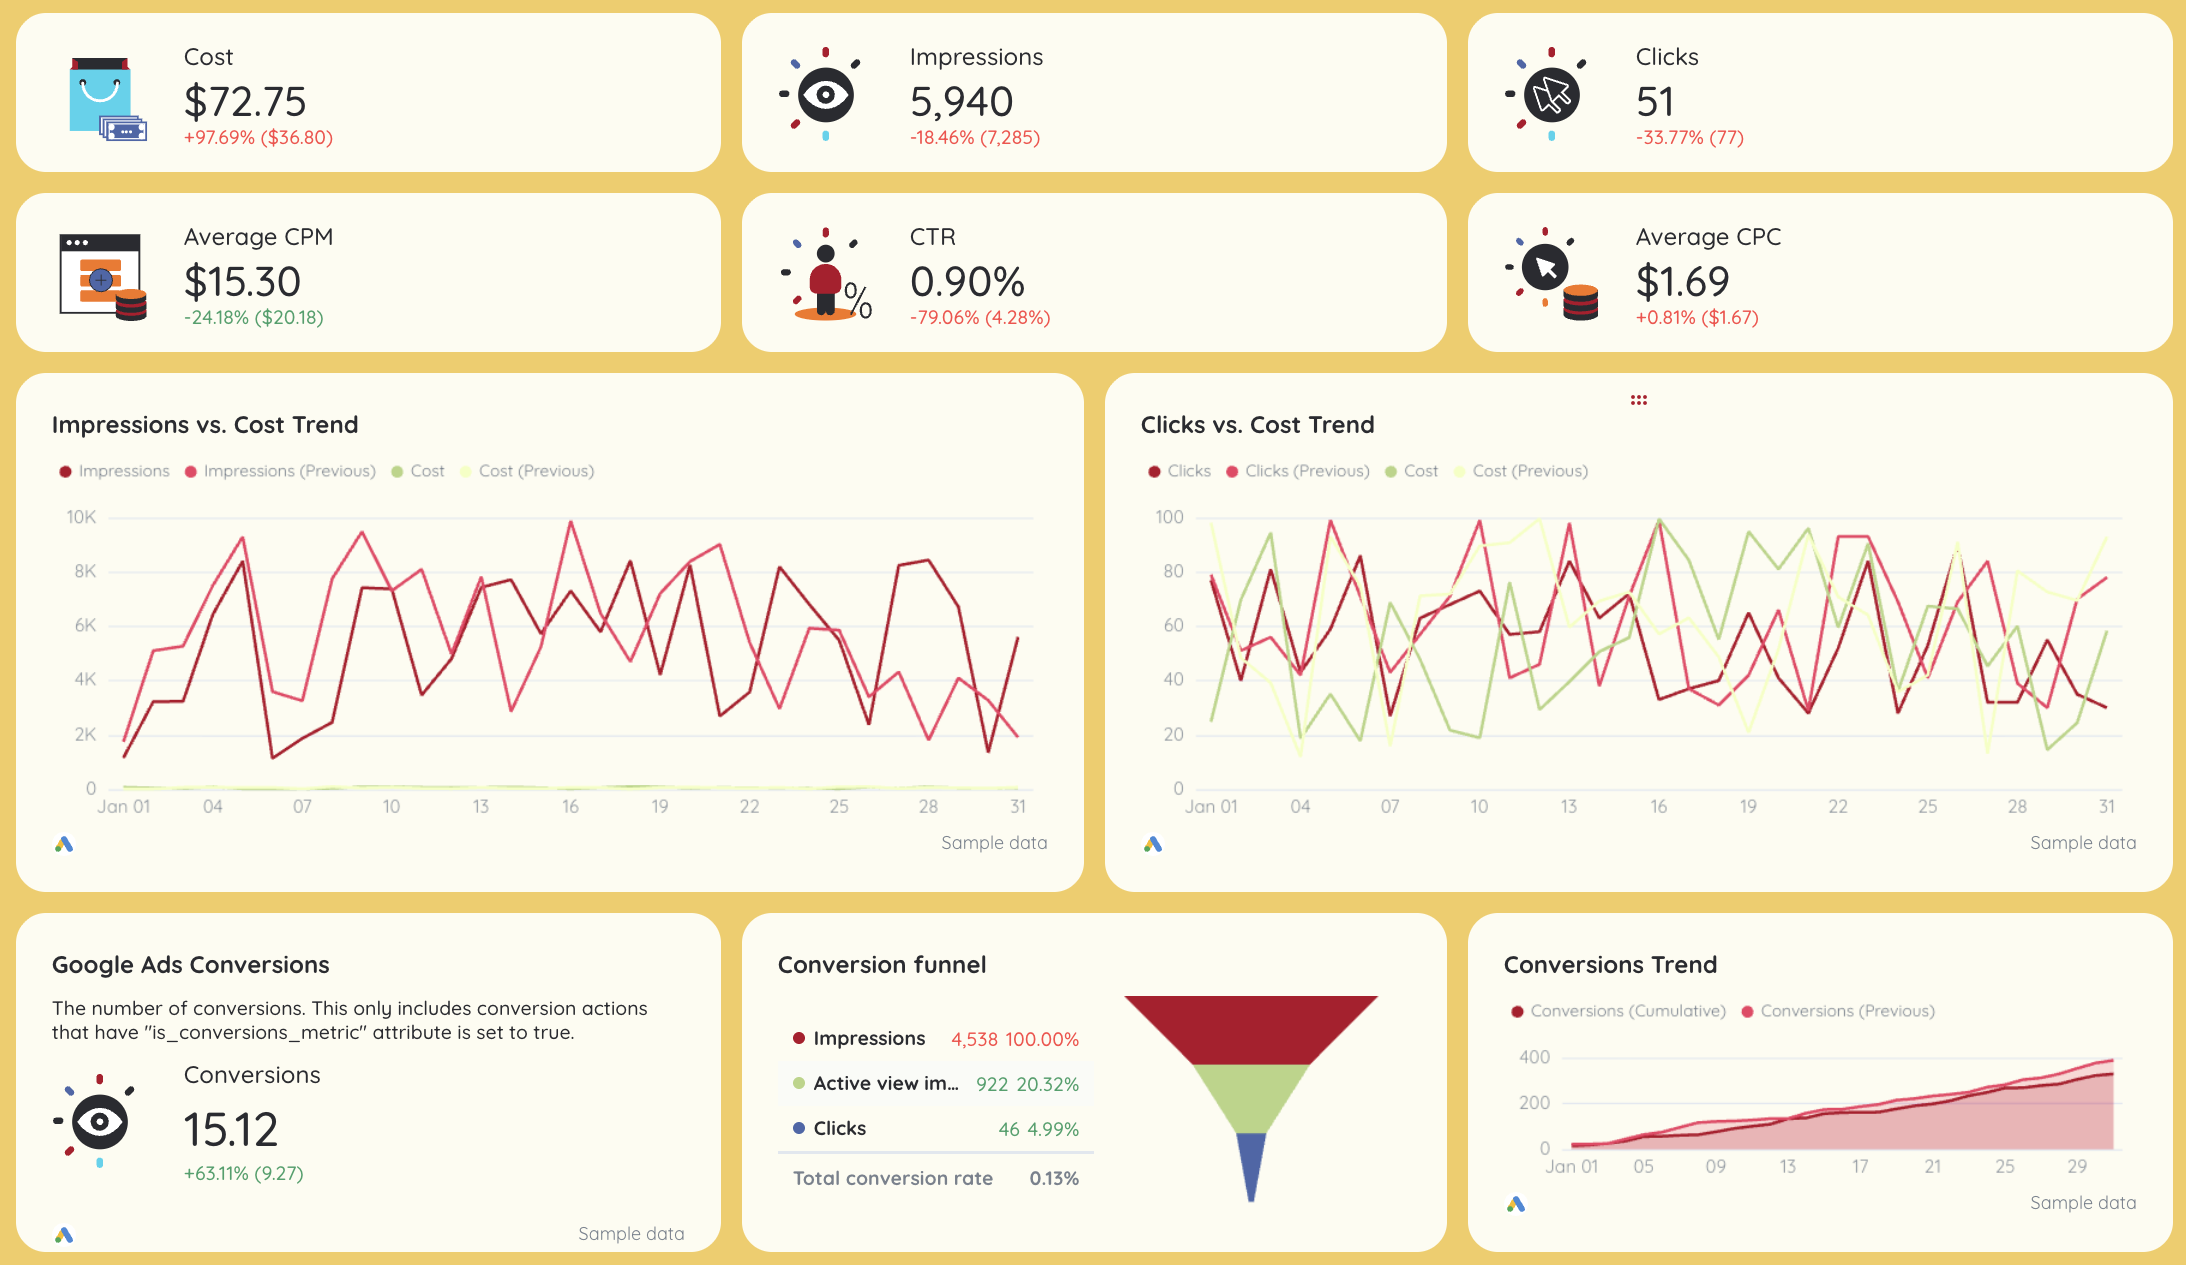
Channels connected: Google Ads, Facebook Ads

What it is: Paid channel performance and optimization view.

Which metrics to display: Spend, impressions, CTR, CPC, conversions, ROAS.

Which charts to use: Funnel charts, trend lines, campaign tables.

Why it matters: Enables budget optimization and cross-channel comparison.

Section 8: Organic Social Media

Cross Channel Analytics - Dashboard showing organic vs paid impressions trend and reactions over time.

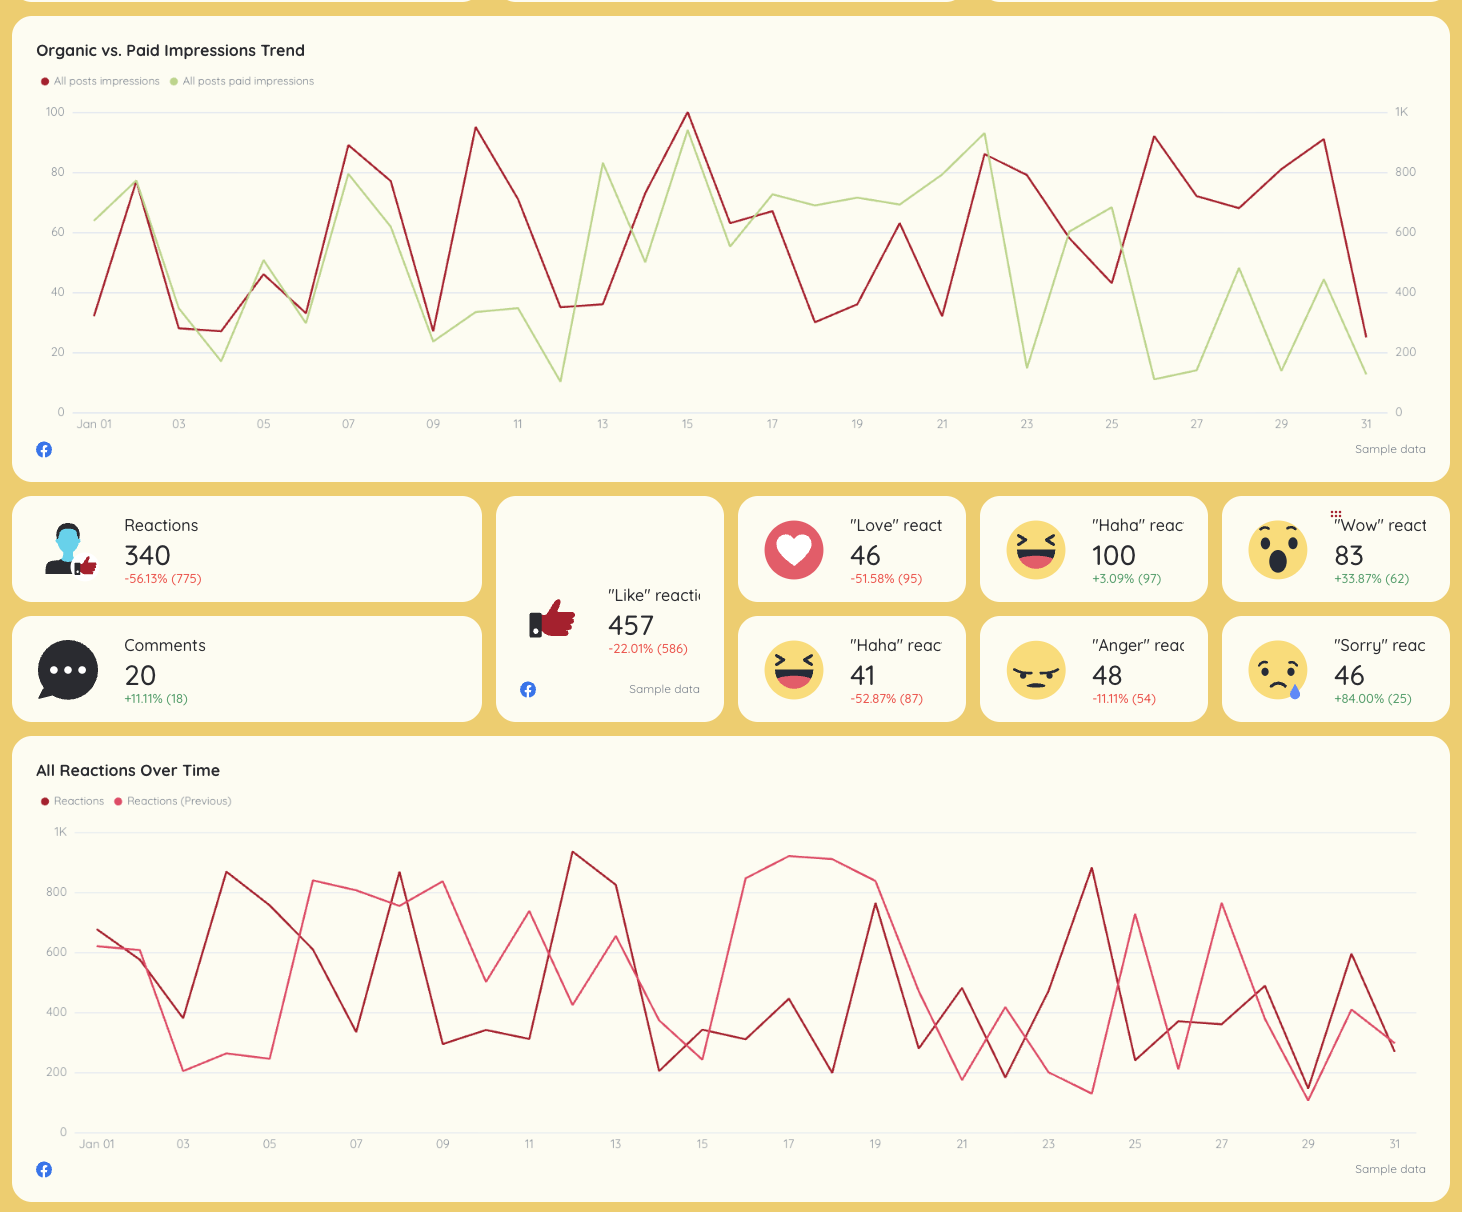
Channels connected: Instagram, Facebook

What it is: Brand engagement and assistive channel tracking.

Which metrics to display: Followers, clicks, conversions.

Which charts to use: Line charts, bar charts, comparison tables.

Why it matters: Shows supporting impact beyond paid campaigns.

Section 9: Email Marketing

Cross Channel Analytics Report Template - A dashboard with charts and tables displaying contact and deal data.

Channels connected: ActiveCampaign

What it is: Owned-channel performance.

Which metrics to display: Open rate, click-through rate, conversions.

Which charts to use: KPI tiles, campaign tables, trend lines.

Why it matters: Supports attribution and retention strategies.

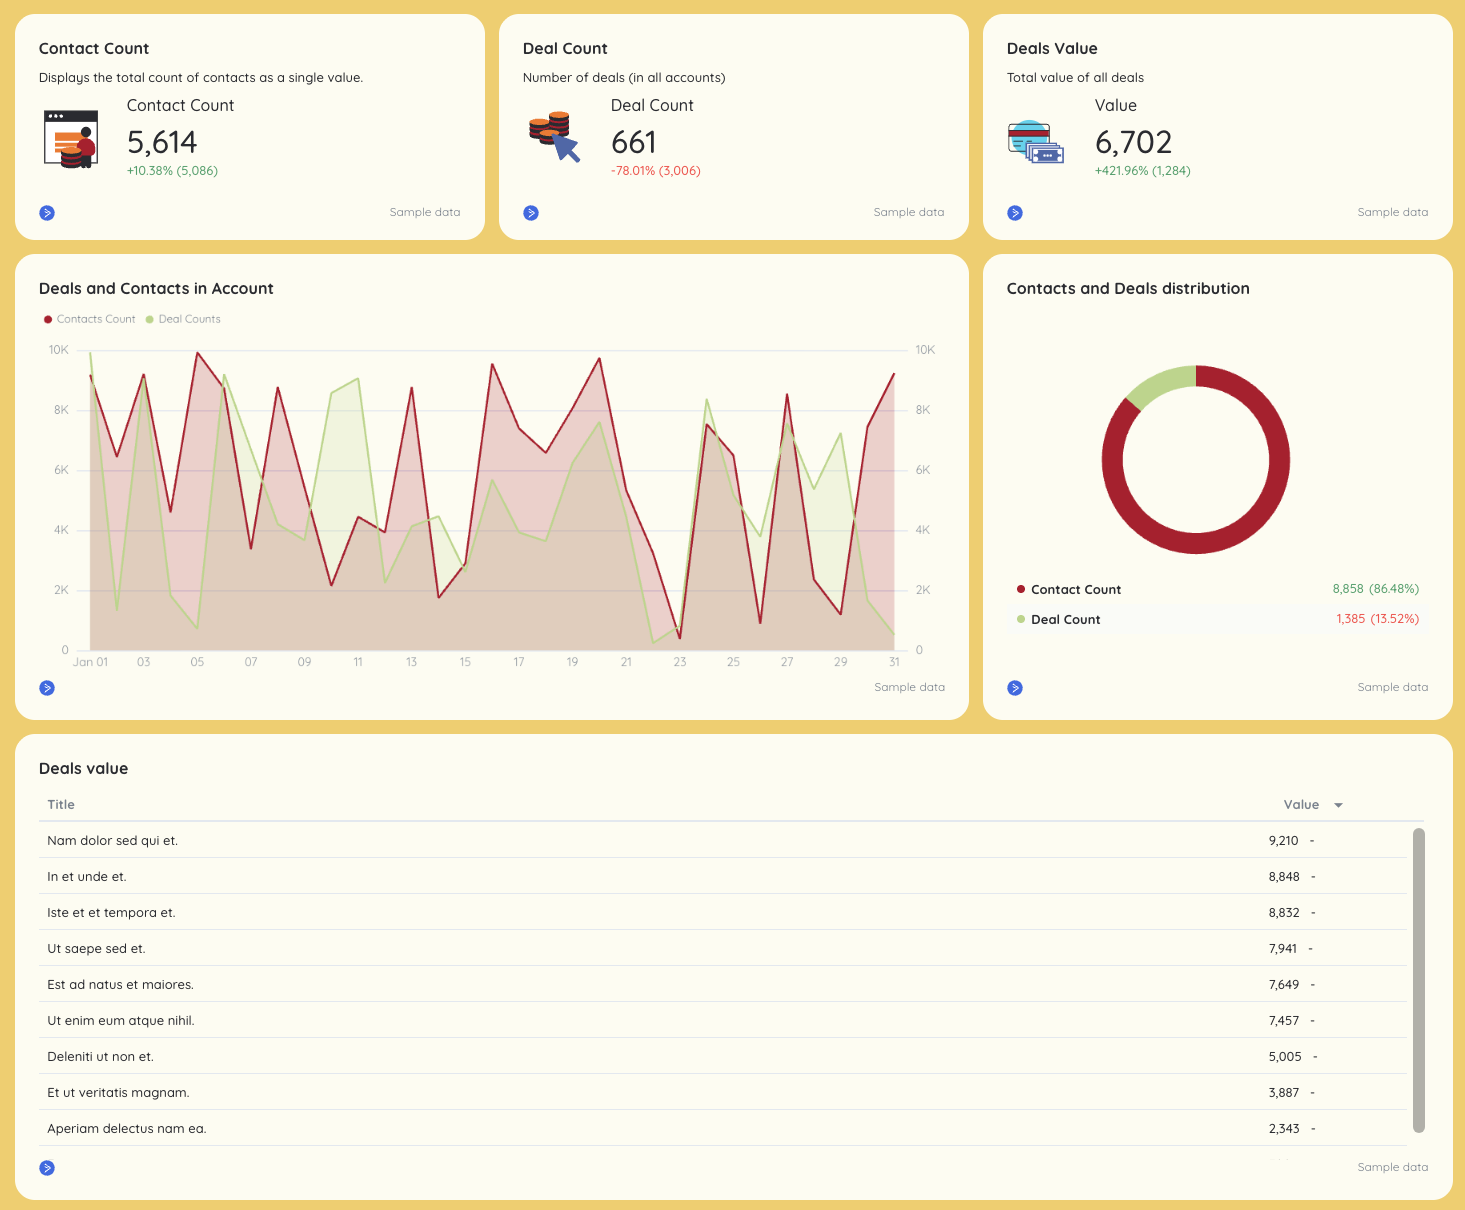
Section 10: CRM & Revenue

Cross Channel Analytics Report - Dashboard displaying leads, opportunities, form submissions, and campaign performance.

Channels connected: Salesforce

What it is: Revenue and pipeline attribution.

Which metrics to display: Leads, opportunities, revenue, conversion rates.

Which charts to use: Funnels, revenue trend charts, source tables.

Why it matters: Proves marketing ROI and supports data-driven decisions.

Connect All Your Marketing Data Sources in One Place

Bring all your marketing data into one place with no-code, stable connectors that you don't need to babysit. 

Why Marketers Love Reporting on Whatagraph

Whatagraph's AI is saving so much time and energy for our marketing specialists. We now have more time to focus on strategic things that help both our agency and our clients grow.

Lars Maat

Lars Maat

Co-Founder @ Maatwerk Online

StarStarStarStarStar

Whatagraph took us to the next level with our clients and within our team. Our relationships with clients have been amazing, and we’ve even been able to retain them longer.

Kim Strickland

Kim Strickland

Digital Marketing Specialist @ Peak Seven

StarStarStarStarStar

Whatagraph is easy to use, visually attractive, and much smoother compared to tools like Looker Studio. It helped us not only get clients on board but also keep them within the agency.

Stef Oosterik

Stef Oosterik

Quality Manager @ Dtch. Digitals

StarStarStarStarStar

Whatagraph has become an essential partner for scaling our reporting, and my teams love it because it saves so much time. We’d recommend it to any team looking to automate data reporting and use AI for insights.

Danielle Roberts

Danielle Roberts

Director of Implementation & Support @ Rentable

StarStarStarStarStar

Frequently Asked Questions

Have more questions? We answered them here.

What is cross-channel analytics?

Cross-channel analytics is the practice of analyzing marketing performance across multiple channels in one unified view—instead of reviewing Google Ads, Facebook Ads, SEO, email marketing, and CRM data separately.


A proper cross-channel analytics setup connects data from tools like Google Analytics 4, Google Ads, Meta Ads, SEO platforms, email marketing tools, and CRMs to show:


- How different channels perform side by side


- Which channels drive conversions and revenue


- How touchpoints work together across the customer journey


The goal is better attribution, clearer channel performance comparisons, and more confident budget decisions.

How to make an analytics report?

To make an effective analytics report:


1. Start with business goals: Decide what you’re reporting on: growth, efficiency, ROI, or pipeline impact.


2. Choose consistent KPIs: Use the same core metrics across channels (e.g. spend, conversions, conversion rate, revenue).


3. Combine data sources: Pull website, ads, SEO, social media, email, and CRM data into one report.


4. Show trends, not just totals: Use charts to highlight changes in performance over time.


5. Add insights and next steps: Every report should explain what happened and what to do next.


This is exactly what a cross-channel analytics report template like Whatagraph’s is designed to standardize.

How to structure an analytical report?

A strong analytical report should follow a top-down structure, moving from summary to detail.


Based on Whatagraph’s cross-channel analytics report template (built from real reports created by marketers), the structure looks like this:


1. Marketing Summary: Executive snapshot of spend, traffic, conversions, revenue, and ROI across all channels.


2. Website Performance (GA4): Users, sessions, conversions, conversion rate, engagement, and revenue.


3. SEO Performance (GSC + GA4): Organic traffic, click-through rate, average position, and conversions.


4. GEO / AI Traffic: Sessions and conversions from AI-driven discovery platforms.


5. Keyword Rankings: Top 3, Top 10, Top 20 keywords, movements, search volume, and CPC.


6. Local Search: Google Business Profile impressions, calls, website actions, and reviews.


7. Paid Media: Google Ads and Facebook Ads performance: spend, CTR, CPC, conversions, ROAS.


8. Organic Social Media: Follower growth, clicks, and assistive conversions.


9. Email Marketing: Open rate, click-through rate, and conversions.


10. CRM & Revenue: Leads, opportunities, revenue, and pipeline attribution.


This structure makes reports easy to scan for executives and clients, and actionable for marketing teams.

How do you create a cross-channel marketing report?

The easiest and fastest way is to use a dedicated reporting tool like Whatagraph.


Here’s how to do it step by step:


Step 1: Use the cross-channel marketing report template


Start with Whatagraph’s ready-made cross-channel analytics report template shared above—free to use and already structured with best-practice KPIs and channel sections.


Step 2: Connect your data sources


Connect Google Analytics 4, Google Ads, Facebook Ads, Google Search Console, email marketing tools, and your CRM using native, ready-made connectors that don’t break and don’t need babysitting.


Step 3: Customize the report


Adjust widgets, drag and drop new charts, add tables, new rows, or entire tabs as needed. Create custom metrics, dimensions, and blends using no-code workflows. 


Step 4: Style the report with Whatagraph IQ


Upload a screenshot of your brand book—or type a prompt like “make this report look like a Batman movie”.


Whatagraph IQ automatically applies colors, fonts, and styles across the entire report. You can fine-tune HEX codes, save the theme, and reuse it across all reports.


Step 5: Automate delivery


Schedule the report to send automatically on a specific day and time via a white-labeled email domain, or share a white-labeled live report link with clients and stakeholders.

What reporting template do you use for clients?

What are some meaningful metrics you absolutely must share?

Based on our cross channel analytics template, the most important metrics include:


- Spend (by channel and total)


- Traffic & sessions


- Conversions & conversion rate


- Cost per conversion / CPA


- Revenue & ROAS


- Click-through rate (for paid and email)


- Organic traffic & rankings


- Leads, opportunities, and pipeline value (CRM)


These metrics show both marketing performance and business impact, not just activity.

What are the best tools for cross-channel marketing analytics?

According to reviews from real users and our own research, the best cross-channel marketing platforms include:


Whatagraph – Best for creating cross-channel marketing performance reports


Agorapulse – Best for managing social media across channels


SE Ranking – Best for SEO performance tracking


Airtable – Best for managing cross-channel marketing data


HubSpot Marketing Hub – Best for marketing automation


ActiveCampaign – Best for email and customer automation


Salesforce Marketing Cloud – Best for enterprise-level cross-channel marketing


Brevo – Best for email and SMS marketing


Mailtrap – Best for email delivery testing


We reviewed each of these tools in detail in this 9 best cross channel marketing platforms guide.

What should be included in a cross-channel analytics report template?

A complete cross-channel analytics report template should include:


- An executive marketing summary


- Website performance (GA4)


- SEO and keyword rankings


- Paid media performance (Google Ads, Facebook Ads)


- Organic social media


- Email marketing


- CRM and revenue attribution


- Clear charts, trends, and actionable insights

Where can I find a template for a cross-channel analytics report?

You can find a ready-made, automated cross-channel analytics report template in Whatagraph. Use it for free today.