

What is an email marketing report template?
An email marketing report template is a pre-built layout that organizes your campaign data - open rates, CTR, conversions, unsubscribes, and more - into one clear, shareable format, so you stop rebuilding the same report from scratch every single month.
For most marketing teams, email reporting still means:
1. Jumping between Klaviyo, Mailchimp, HubSpot, or whatever platform the client uses
2. Exporting CSVs, dropping numbers into a spreadsheet, or Google Sheets
3. Formatting everything manually before a client call.
That process repeats for every email campaign, every reporting cycle, across every account.
The pressure to get this right is real.
Email marketing consistently delivers a strong return on investment - according to Litmus’ 2026 report, 37% of marketers report an email ROI between 20:1 and 36:1. But at the same time, Klaviyo's State of B2C Marketing report found that 73% of B2C marketers are reporting rising customer acquisition costs.
That combination creates a real reporting challenge. Email is working - but rising acquisition costs mean clients need proof it's pulling its weight, not just open rate graphs.
A well-structured email marketing report template makes that case clearly. It helps to:
✅ Track key email metrics like open rate, CTR, conversion rate, bounce rate, and unsubscribe rate in one place
✅ Break down campaign performance by segment, audience, or email type to pinpoint what resonates
✅ Compare results across date ranges to show trends and demonstrate progress over time
✅ Pull in data from other marketing channels - PPC, SEO, social media - for a complete view of marketing performance
✅ Share results with stakeholders through live links, automated emails, or branded PDFs on a schedule
The manual side of this adds up fast. Maatwerk Online, a full-service digital agency managing over 100 clients, was spending at least an hour per client per month just on building and updating reports.
After switching to Whatagraph, that time dropped dramatically - saving the team more than 100 hours every single month.
Whatagraph's AI saves time and energy for our marketing specialists. And the hours we're saving are just pure profit. We now have the time to focus on more strategic things that help both our agency and our clients grow. - Lars Maat, Co-Founder at Maatwerk Online
Whatagraph IQ connects directly to your email data sources, builds the full report for you, and writes the performance summaries automatically.
What Should An Email Performance Report Template Include
Based on the email reports created by marketers in Whatagraph, the most effective email campaign report templates follow a clear structure: context → performance → trends → breakdowns → insights → next actions.
This structure helps marketing teams move from raw metrics to clear, data-driven decisions, without spending hours building reports from scratch.
1. Reporting Context (Date Range, Comparisons, Goals)
Before analyzing any metrics, establish context.
Include:
- Reporting period (for example, monthly reporting)
- Comparison period (previous month or previous email campaign)
- Time elapsed versus goals
- High-level performance goals tied to engagement or revenue
Why it matters:
Stakeholders don’t want standalone numbers. They want to know whether performance is improving or declining. Context turns an email report into a true performance report.
2. Core Email Marketing KPIs (The Snapshot View)
This section gives stakeholders a quick, high-level view of email marketing performance.
Key metrics to include:
- Emails sent
- Open rate
- Click-through rate (CTR)
- Conversion rate
- Bounce rate
- Unsubscribe rate
- Total clicks and unique clicks
- Subscriber or list growth
What these numbers tell you:
These KPIs show whether your email campaigns are reaching inboxes, engaging recipients, and driving action.
What to do with them:
Use these metrics to flag issues early—such as declining engagement or deliverability problems—before drilling into individual campaign performance.
That said, the goal isn't to include every available metric.
The snapshot view only works when it's focused on the KPIs that actually match what the client is trying to achieve. As Cheyenne Skye, Digital Marketing Analyst at Noise New Media, explains:
There's a ton of metrics that we as marketers look at that would make no sense and probably overwhelm the customers. So we always try to be very specific about what the client's goal is and then just show the metrics for that.
3. Engagement and Deliverability Analysis
The best email marketing report templates go beyond surface-level key performance indicators.
Include:
- Hard and soft bounce rates
- Deliverability indicators
- Open and click trends over time
- Engagement changes by campaign or audience segment
What this tells you:
High bounce rates or falling open rates often point to list quality issues, deliverability challenges, or ineffective subject lines.
What to do next:
- Clean and segment your email list
- Adjust sending frequency
- Test subject lines and preview text
- Improve targeting by audience segments
4. Email Campaign Performance Breakdowns
This is where insights start replacing assumptions.
Include a campaign report table with:
- Campaign name
- Emails sent
- Opens and open rate
- Clicks and CTR
- Conversion rate
- Unsubscribe rate
- Bounce rate
Why this matters:
Campaign-level breakdowns reveal which email campaigns actually drive results and which ones need optimization.
Optimization angle:
Compare subject lines, CTAs, timing, and formats across campaigns to improve future performance.
5. Funnel Visualization (From Send to Conversion)
High-performing email analytics report templates visualize the journey, not just the outcomes.
Include an email funnel showing:
- Emails sent
- Opens
- Clicks
- Conversions
- Total conversion rate
What this tells you:
Funnels make it easy to spot drop-offs—whether they happen at the inbox, content, or conversion stage.
What to do if performance drops:
- Low opens → test subject lines and send times
- Low CTR → refine CTAs and email copy
- Low conversion rate → align email messaging with landing pages
6. Trend Analysis (Performance Over Time)
Static metrics don’t tell a story. Trends do.
Include time-based graphs for:
- Emails sent versus opens
- Opens versus clicks
- Click-through trends
- Subscriber growth over time
Why it matters:
Trend analysis helps marketing managers identify seasonality, campaign fatigue, and performance shifts tied to specific email campaigns.
7. Ecommerce-Specific Metrics (If Applicable)
For ecommerce brands, email marketing reports should directly connect to revenue.
Include:
- Email-attributed revenue
- Transactions
- Ecommerce conversion rate
- Average order value (AOV)
- Refunds
- Revenue per email campaign
Advanced breakdowns:
- Top-performing email campaigns by revenue
- Top products and product categories driven by email
- Email performance compared to other marketing channels
What this tells you:
This section proves return on investment and shows how email marketing supports overall marketing efforts.
Check out: eCommerce report template
8. Data Source Transparency
Professional email marketing reports clearly show where data comes from.
Include data sources such as:
- Email platforms like Mailchimp, HubSpot, or Klaviyo
- Google Analytics for conversions and ecommerce data
- CRM or marketing platform data when relevant
Why it matters:
Transparent data sources build trust with stakeholders and reduce confusion during reviews.
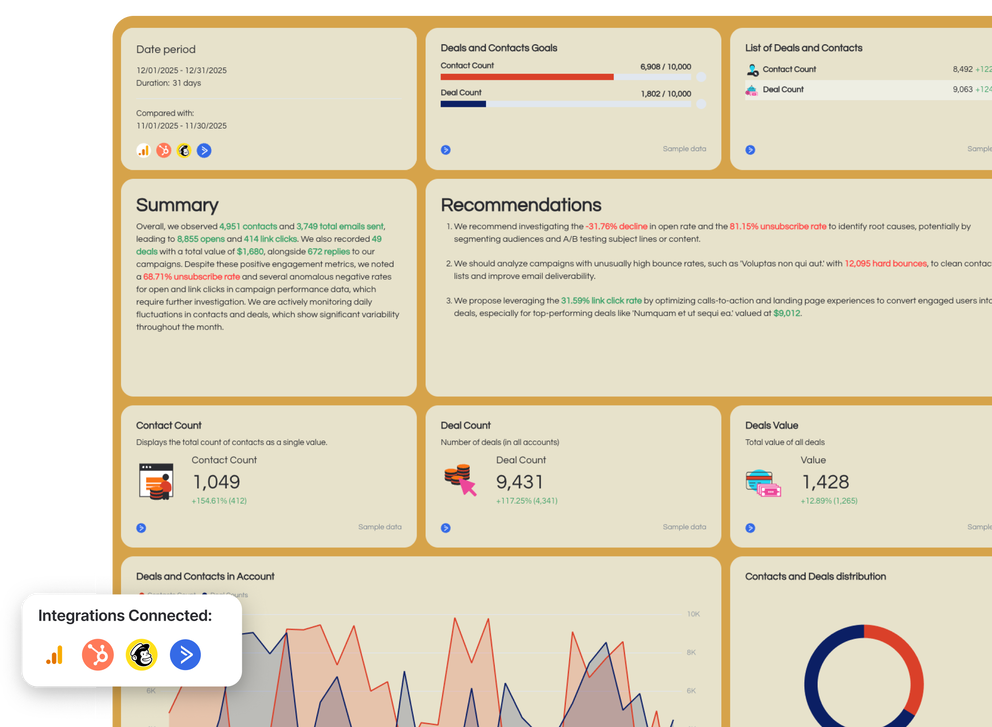
9. Actionable Insights and Recommendations (Non-Negotiable)
The best digital marketing reporting templates always include interpretation.
Include:
- A concise performance summary
- Key wins and risks
- Two to four concrete, data-backed recommendations
Examples:
- Optimize subject lines to improve open rate
- Improve CTAs to lift CTR
- Segment audiences to reduce unsubscribe rate
- Scale campaigns that drive conversions
Without this section, even a well-structured email marketing report leaves stakeholders with charts but no direction.
Yevhenii Tymoshenko, CMO at Skylum, puts it plainly:
The worst mistake is throwing data at people without any context. A five percent drop in email open rates means nothing unless you know why it happened and how to fix it. - Yevhenii Tymoshenko, CMO, Skylum