Google Analytics 4 (GA4) Dashboard for Agencies
Present your clients with a custom Google Analytics 4 dashboard that pulls real-time data from their GA4 accounts. Track key web analytics metrics and transform them into actionable client-ready GA4 dashboards. Get a 360-degree view of your client’s marketing performance with cross-channel insights and key metrics from 45+ other digital marketing platforms.


What is a Google Analytics 4 dashboard?
A Google Analytics 4 dashboard is an interface that you can use to display website performance data in a high-level fashion using multiple visualization cards or widgets. These dashboards are convenient because they display the most important metrics, such as conversions, engagement rate, page view, and session duration, in one view. Unlike reports, GA4 dashboards display only the current or recent web analytics data.
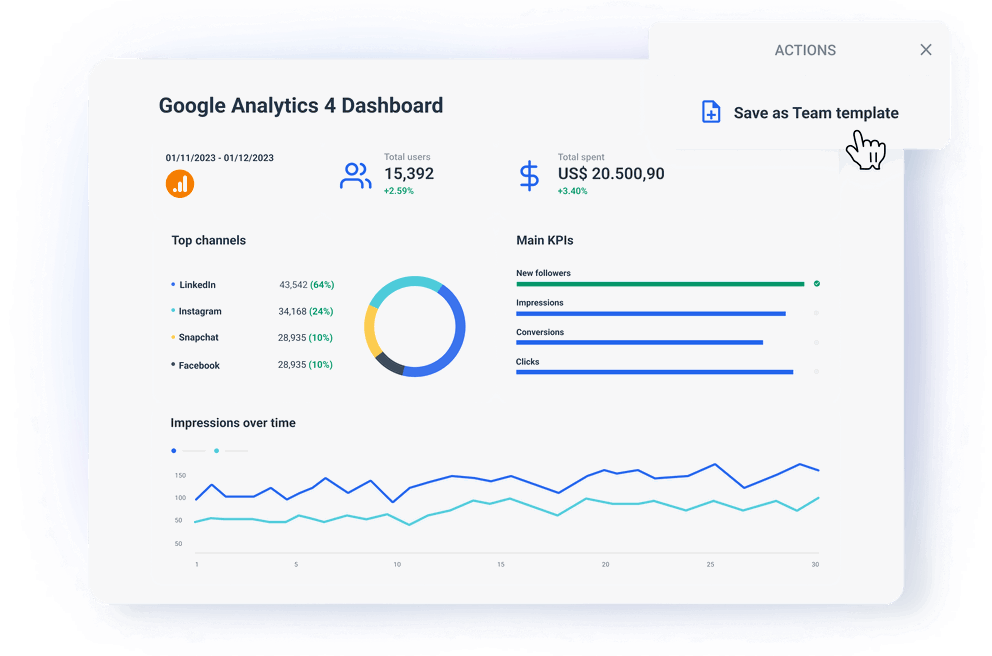
Create user-friendly GA4 dashboards
Harness the full power of Whatagraph’s streamlined data marketing data management for your agency. Use our user-friendly marketing dashboard software to connect clients’ GA4 data streams, visualize the key metrics, and share the insights as actionable marketing analytics dashboards. Save every dashboard you create as a new report template for future use.
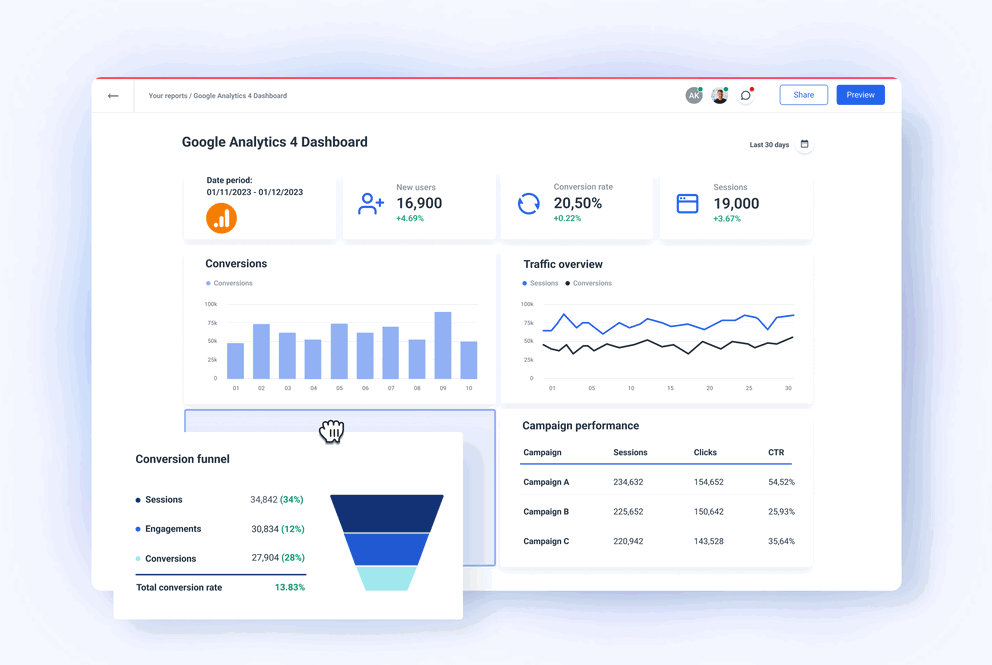
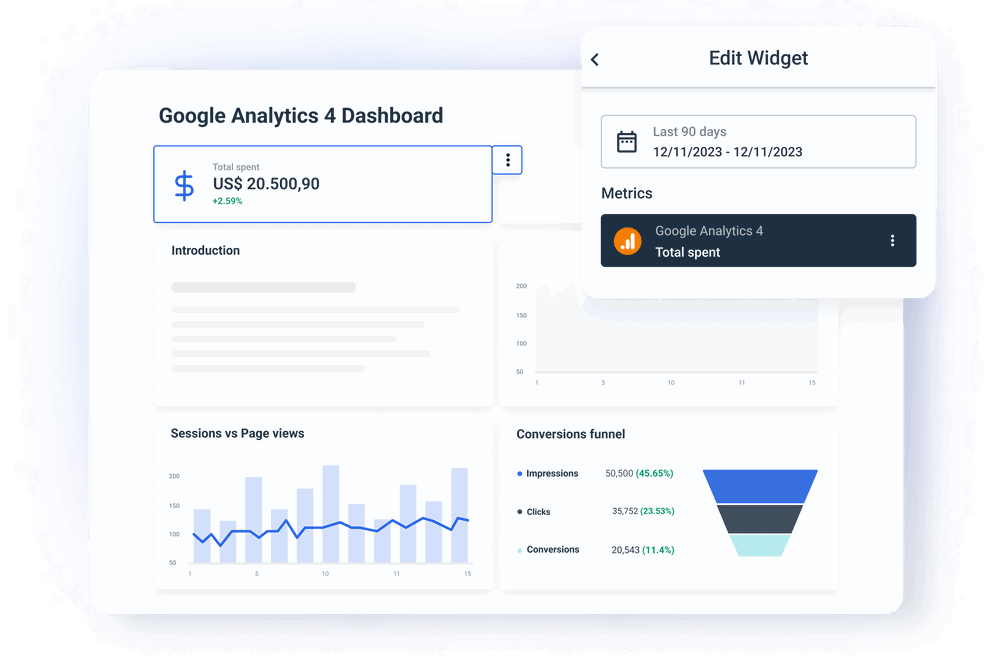
Track GA4 events and conversions
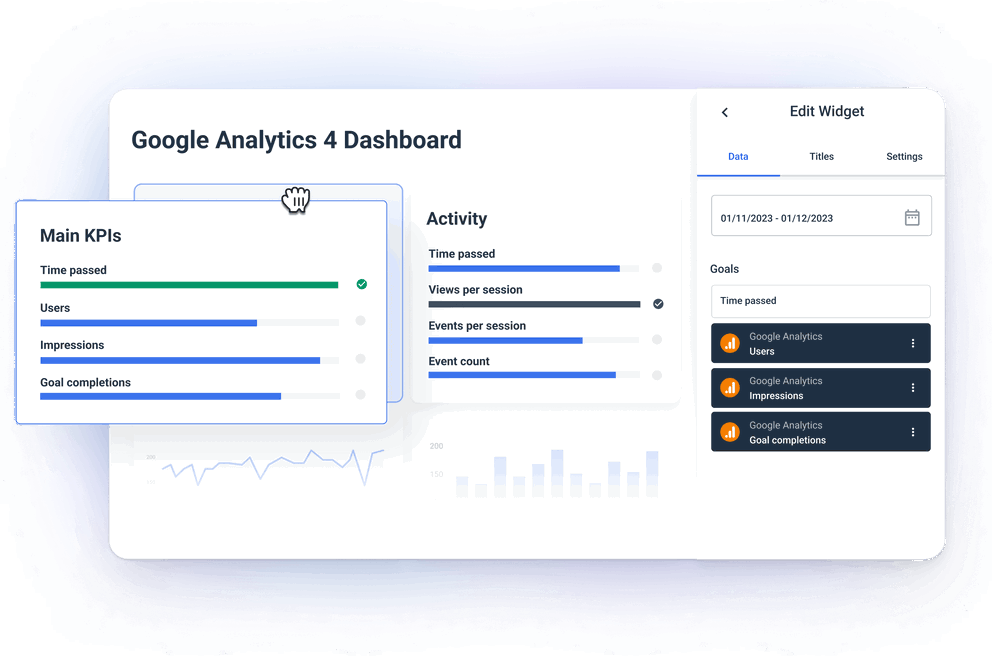
Scale your agency standards to your clients’ expectations. Build your GA4 dashboards to track events, conversions, and revenue across the customer journey. Drag and drop charts, graphs, tables, and single-value widgets to optimize your dashboard for the marketing strategy you’re developing for your client. Enrich the conversion insights with data from other streams such as PPC, eCommerce, and SEO analytics tools.
Build any marketing dashboard in three steps

Connect sources
Automatically pull data from 55+ native integrations. Log in to connect a source and get live data into your dashboard with swift automated updates.

Create a dashboard
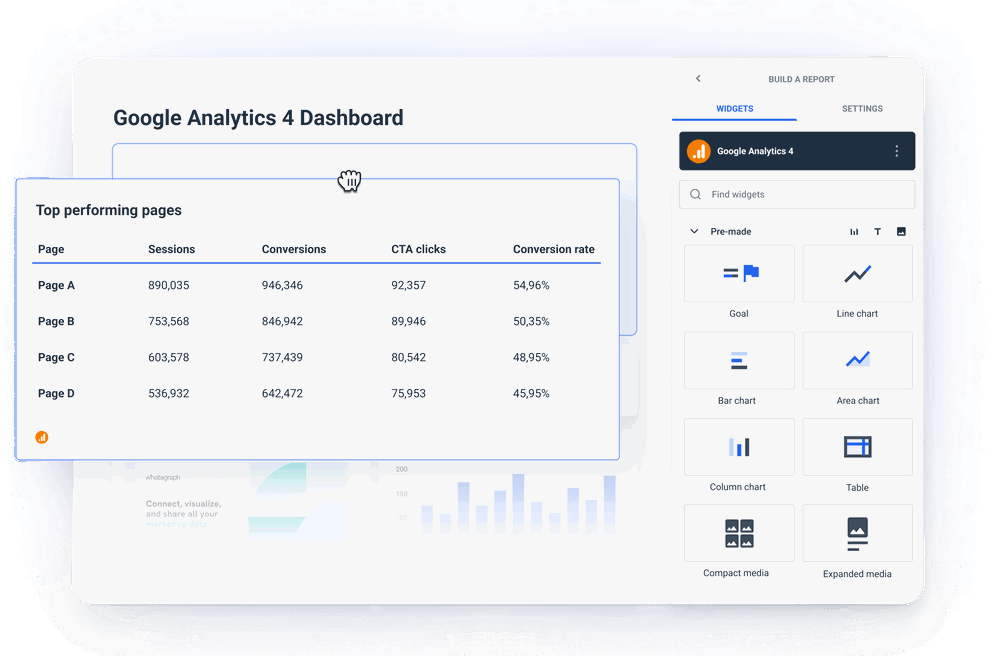
Pick a template from our gallery with all essential visual types and widgets already inside, or use our drag-and-drop builder.

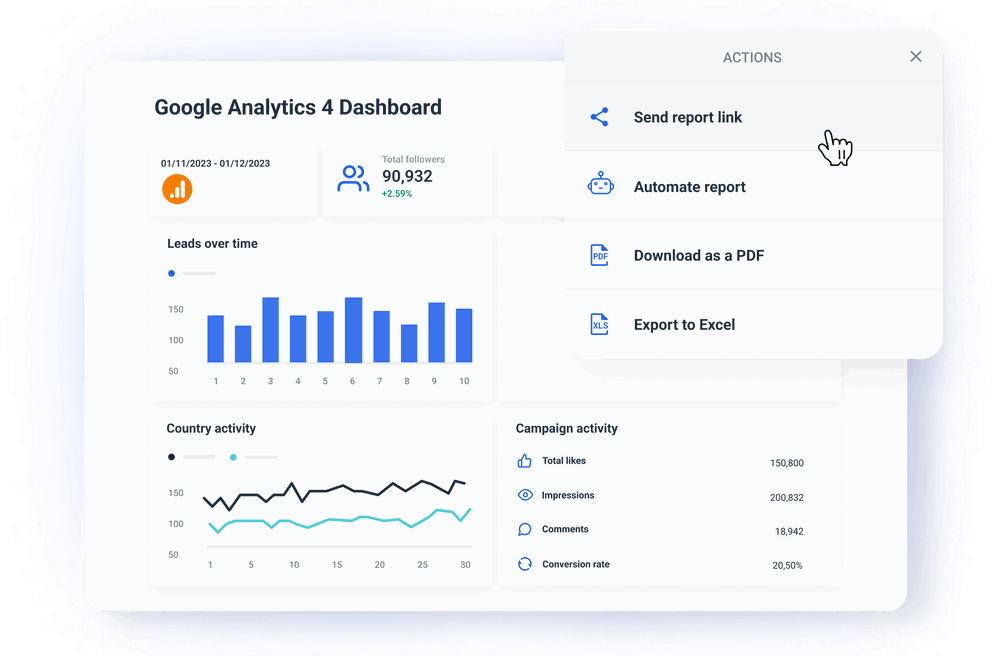
Share a live link
Share a password-protected live link to your dashboard for on-demand access at any time from any location.
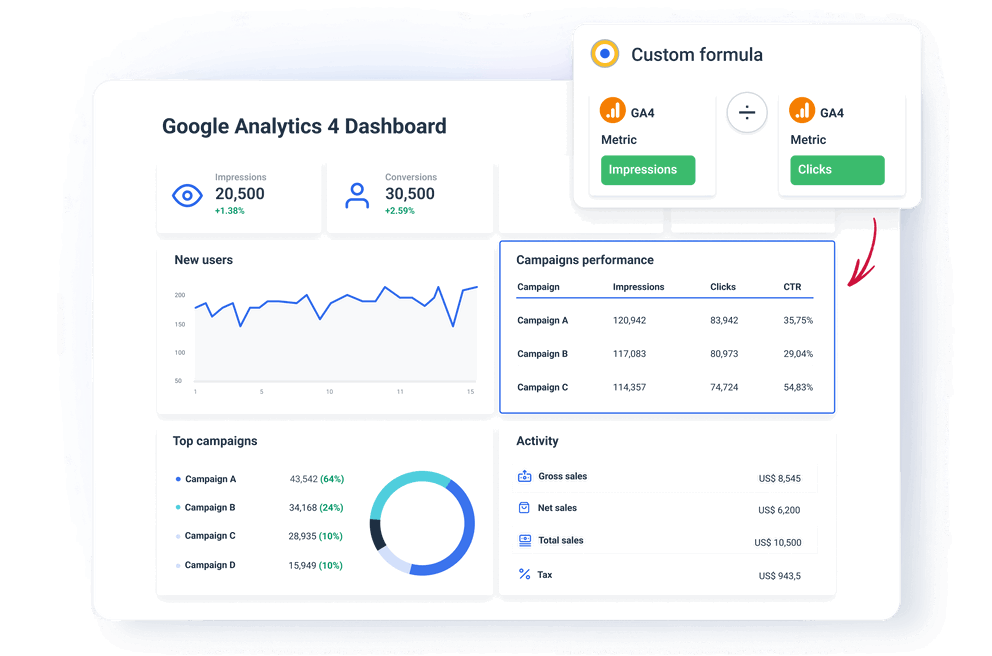
Custom analytics for every traffic channel
Whether you’re using a drag-and-drop builder or a pre-built GA4 template, you can add more granularity to your dashboard with custom formulas. Easily blend data and combine metrics from multiple sources. Pick any metric from the connected sources, add, divide, multiply, or take parts of it, or even build new metrics that the source API doesn’t provide. Want to show the likes/total impressions ratio? You can do it in a few clicks and save the formula as a new metric.
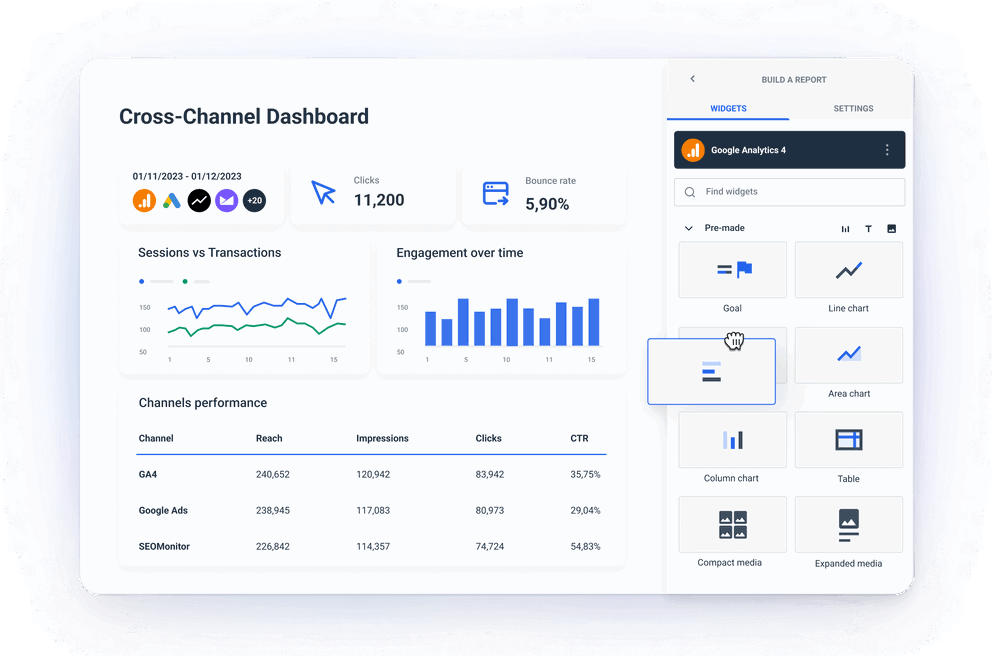
Build GA4 dashboards your way
Whether you start from our GA4 template or a blank page, you have complete control over the look of your GA4 reports and dashboards. Drag and drop every widget onto the report page or rearrange the existing widgets in the template. Change the metrics and add filters to each visualization. Change the color scheme and add comments explaining trends or goals. Use text widgets to create labels, sections, and headings in your custom reports and dashboards.
All dashboard features your agency needs


Page-level performance data
Rank and review your client’s pages by GA4 performance metrics. Identify top-performing pages and note those ripe for optimization and re-writes. Take a deep dive into different types of landing pages and content categories. Use landing page table overviews to compare the sessions, conversions, and conversion rate and segment page performance by the client’s marketing goals.
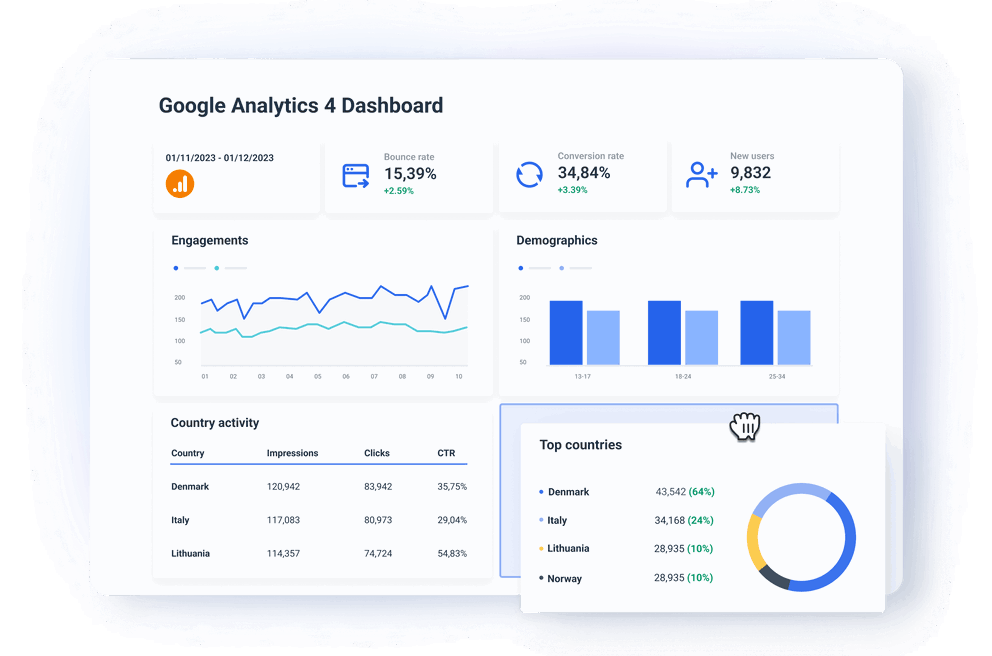
Analyze GA4 audience data
The demographic data of your client’s visitors can help you identify hotspots and areas that need your attention. A sudden surge in mobile users’ bounce rate might signal that the site needs to optimize for mobile app users. Is audience age shifting in an unexpected direction? Boost the engagement by adjusting the site messaging accordingly. With clear and user-friendly visualizations, GA4 audience data easily gives you leverage to optimize your client’s marketing strategy.
Advanced marketing data analytics features

All your client’s marketing data in one platform
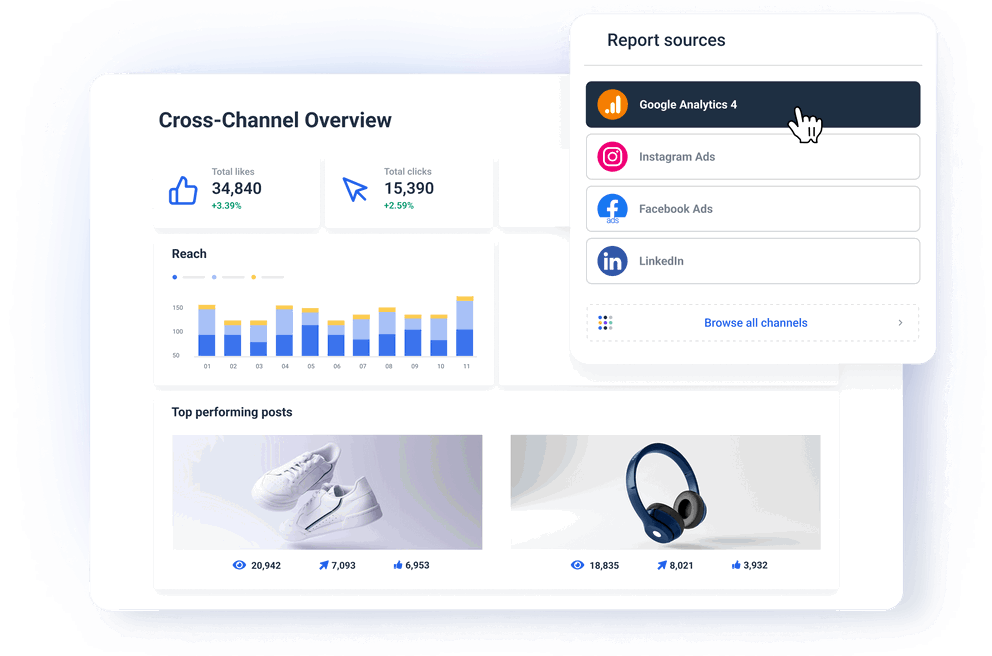
No single source has all the answers, and to get the full context, you need to cross the results from all your client’s marketing platforms. Whatagraph allows you to easily add more data sources to your marketing reports and dashboards and create cross-channel overviews. Add more context to your custom dashboard by adding SEO, social media, e-commerce, PPC, email marketing, and CRM data to your GA4 insights.
On track with your marketing goals
Show your clients how close you are to hitting success with our Goals widget. The visual progress bar highlights how your marketing efforts come against set objectives. You can use the widget to break up the monthly GA4 performance targets into day-to-day action items and keep your team on track. Create goals on any metrics, edit the labels, and add filters like with every Whatagraph widget. Add text widgets to offer your expert insights and explain your results.
Get the most out of your marketing data
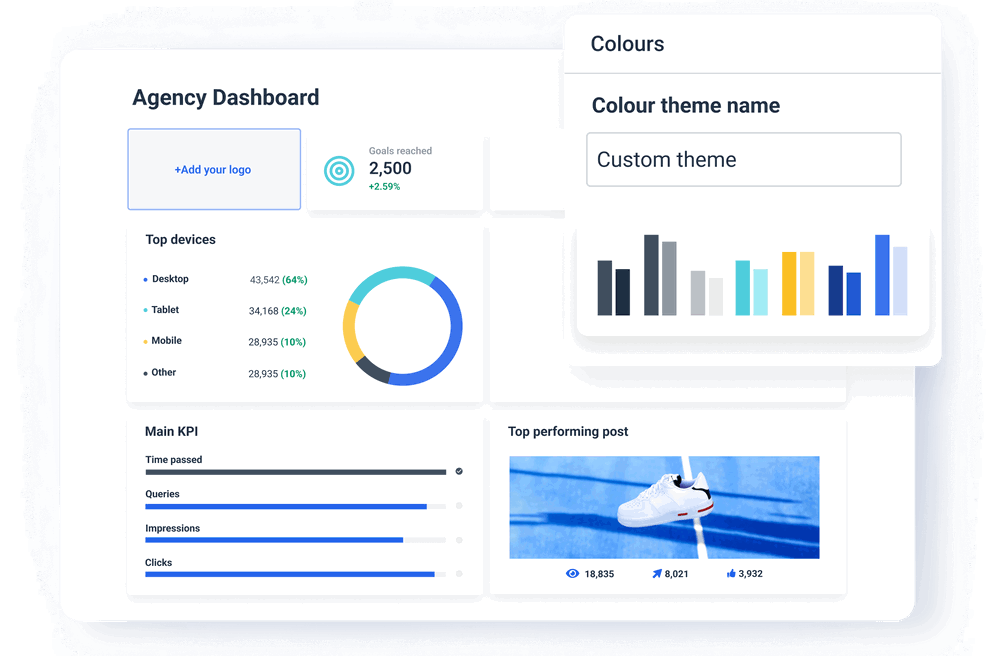
White-labeled agency dashboards
Show professionalism by presenting your client’s marketing success with professionally branded dashboards. Deliver each GA4 custom dashboard with its own logo and color scheme to show an extra level of commitment. Host client dashboards on your agency’s custom domain and create white-label profiles for different client brands.
Live links for instant sharing
Keeping clients in the loop with marketing developments is a time-consuming job that leaves no room for error. Automate how you share your reports by providing clients with a live link to their GA4 dashboards. This way, people who trust you with optimizing their funnel can always check the results of your hard work. Clients can hover over individual widgets to see more details about displayed metrics and edit the date range to see how their website performance has changed.
Frequently Asked Questions
What GA4 metrics can you track with Whatagraph dashboards?
You can track all the Google Analytics metrics available from GA4 API, including:
1. Users: Active Users, New Users, and Returning Users
2. Traffic Acquisition: Source/Medium, Channels, and Campaigns
3. User Behavior: Pageviews, Average Time on Page, Engagement Rate (including Bounce Rate in Universal Analytics), and Events (specific to client goals)
4. Conversions: Goal Completions, E-commerce Purchases, Conversion Rate (First Time and Total), Total Revenue
5. User Engagement: Engaged Sessions, Session Duration, Interactions per Session, Retention
6. Audience: Demographics, Interests, Device Category
7. Events: Specific events related to key actions, Event Count
8. Custom Metrics: Any custom metrics that are specifically relevant to the client's objectives
What PPC channels can I add to my GA4 analytics dashboard?
You can add Google Ads, Facebook Ads, LinkedIn Ads, TikTok Ads, Snapchat Ads, Amazon Ads, Pinterest Ads, and Microsoft Advertising accounts to your GA4 dashboard. Apart from these advertising platforms, Whatagraph has integrations with 9 more PPC tools like Adroll, StackAdapt, and CampaignManager 360.
Why is Whatagraph better for GA4 dashboards than Looker Studio?
Whatagraph has several advantages over Looker Studio (ex-Google Data Studio).
First, Looker Studio is more of a dashboard tool, while Whatagraph is a marketing data platform. This means all data collection, visualization, and sharing occur within one environment.
Then, whether you use a template or build your own dashboard, you can connect more sources natively with Whatagraph, while with Looker Studio, you have to buy third-party connectors for every source outside of the Google platform. And that is possible only if you pay for the Looker Pro version.
Third, you can combine cross-channel data more easily with Whatagraph than with Looker Studio dashboards.
Whatagraph has a linked templates functionality that allows you to link many dashboards and edit them all at once, as well as to save every dashboard or widget you create as a template for future use.
Finally, Whatagraph has live chat support and an intuitive interface, ensuring a better user experience. At the same time, with Looker Studio, you’re basically directed to Google’s extensive help sections and tutorials, which take your precious time whenever you need to solve a problem.
It’s good to be loved! Our clients are not shy about expressing it.
I made a switch from GDS and Sheets for reporting to Whatagraph, and I am saving literal hours each week on performance report creation. Our small firm actually managed to onboard 2 new clients as a result of all the time we saved on managing data and reporting. The customer service is also really helpful and easy to reach.

Capterra verified review by
Mindaugas S., Marketing Consultant
Having active customer support to help fix any issues was a big contributor, but we also really liked the ability to save templates and connect sources to multiple charts/widgets at once without having to edit them individually. And having the grid layout is much easier to stay consistent with than the free form setup that Data Studio has.

Capterra verified review by
Nico T., Media Planner
The system has standard templates that are easy and fast to use. Also you can build your own report with lightning speed. It is very easy to use, has a lot of integration, and let get started very fast.

Capterra verified review by
Rasmus Bernt K., External Senior Management Consultant
We love Whatagraph - we would definitely recommend and our account manager is great! I love how easy this tool is to use, everyone on the team finds it much more user-friendly than other dashboards. Integration was easy, we sent some example reports to the team who duplicated these for us. We literally had to log in and send it to our clients!

Capterra verified review by
Stephanie S., Digital Director
We are showing our clients the work that we're doing for them and this is incredibly important for our clients ROI. They want to see results and having a tool like Whatagraph that can show data from virtually every source we use is hugely important.

Capterra verified review by
John S., SEO Strategist
The tool is easy to use; you do not need to have development resources. Even my junior project managers are capable of making campaign reports in minutes. There are a lot of pre-made templates you can use as well as many pre-made widgets.

Capterra verified review by
Erman E., Marketing Specialist
Really easy to connect data sources within the tool. The library of report templates has been helpful. The customer support team has been responsive to all of our needs. Our team enjoys the simplicity of setting up the reports and how the data is presented.

Capterra verified review by
Brent N., Director of Operations
Easy to create really beautiful graphs and reports which can help other team members to understand the most important takeaways. I especially like the automated report function, so I don't have to check on the same thing repeatedly.

Capterra verified review by
Orsolya S., Online Marketing Manager