Free Instagram Report Template

Track, analyze, and share your Instagram performance in one place.

Use this ready-made Instagram report template to present your wins, highlight top-performing posts, and get actionable insights.

Instagram Report Template - Dashboard showing post performance metrics with charts and figures.

Create Custom Instagram Reports in Seconds

With Whatagraph IQ, just tell us what you need, and we'll build a stunning Instagram report for you. No templates or manual setup required.

What To Include in an Instagram Insights Report?

An effective Instagram report template should capture everything that matters about your profile’s performance, without making you dig through spreadsheets.

Here’s what to include:

1. Performance Summary

Instagram Report Template - A well-organized Instagram report with performance data, summary, and recommendations.

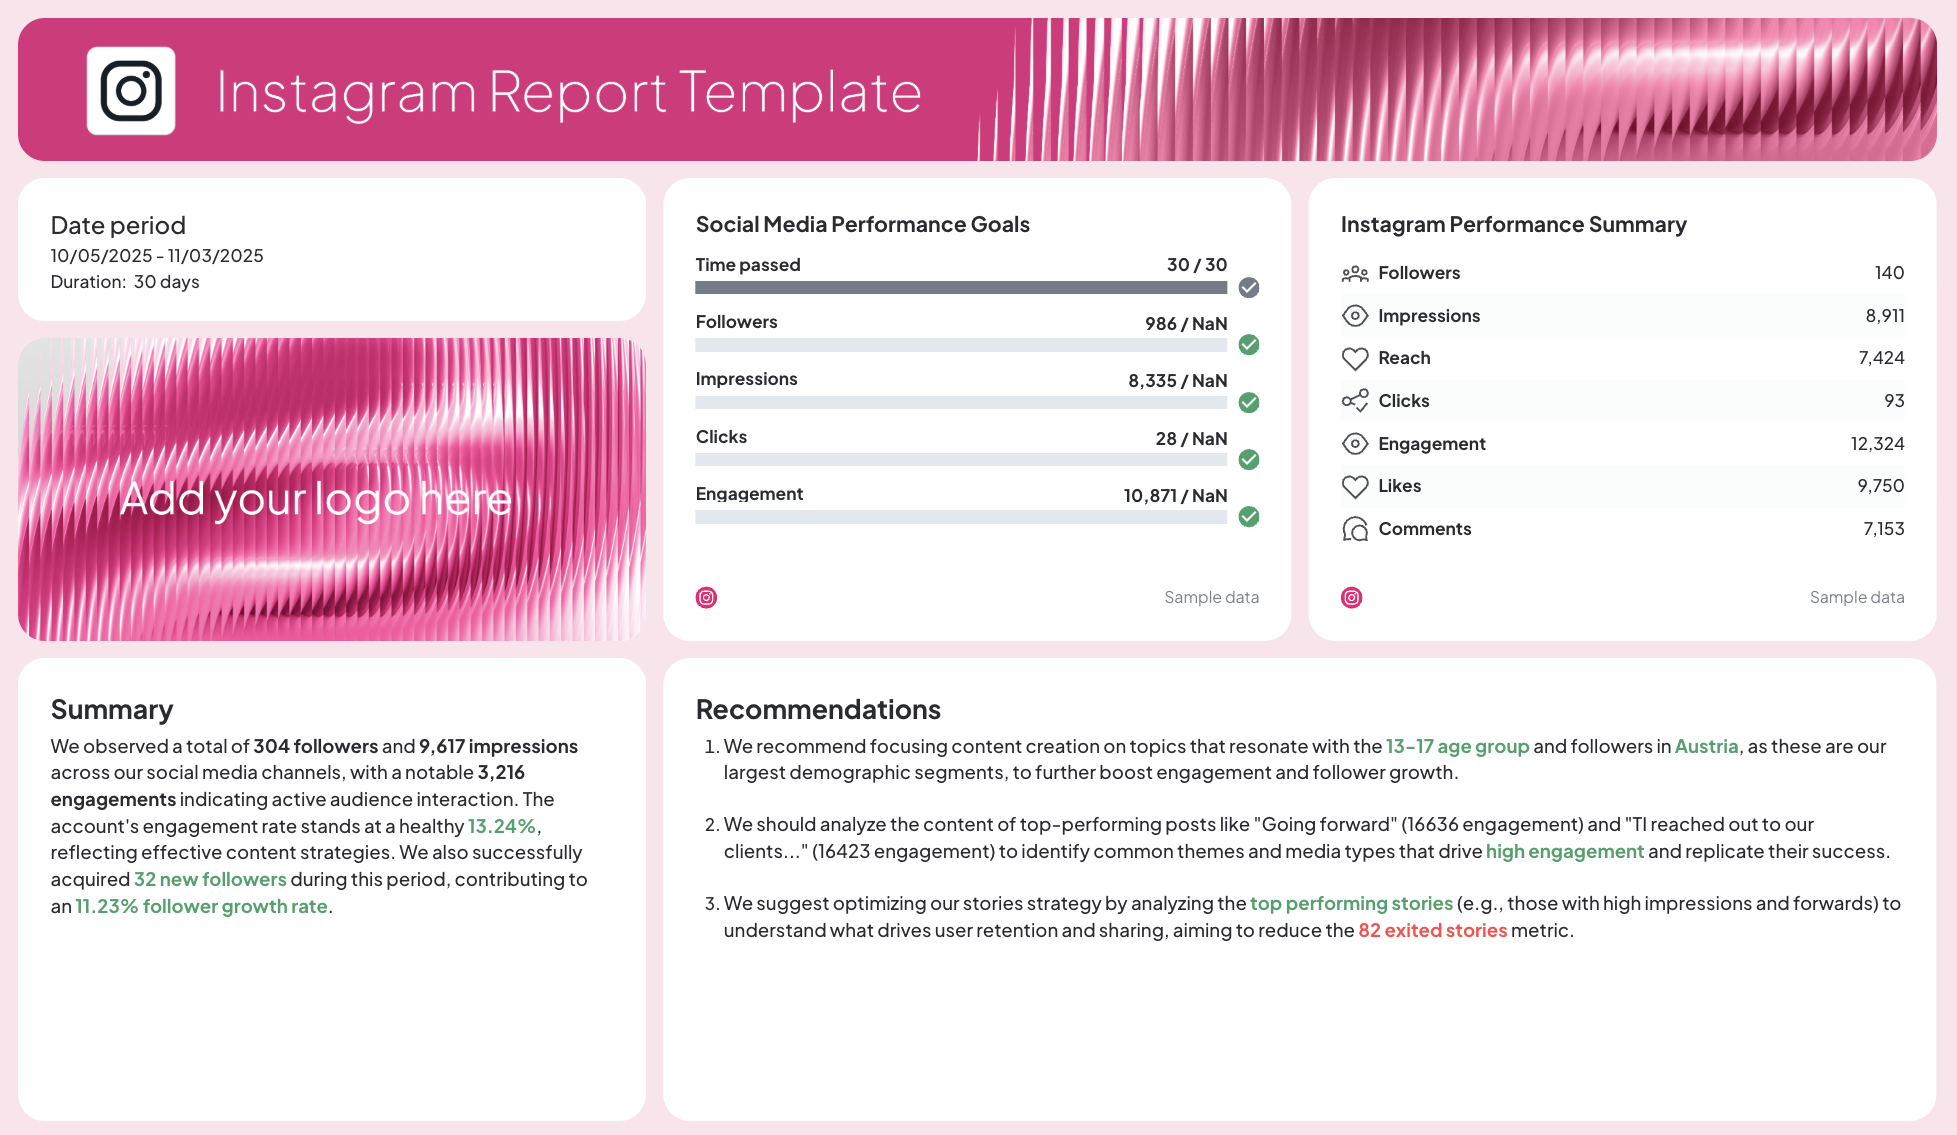
Start with the essentials:

  • The date period of the report to define your timeframe.
  • A goal widget that tracks your Instagram progress—see how close you are to hitting client or campaign targets.
  • An Instagram performance summary that lists your key metrics like reach, clicks, followers, engagement, and likes.

You’ll also want to include Summary and Recommendations widgets.

With Whatagraph IQ, you don’t have to write these manually. Choose from four content types—Summary, Wins, Issues, or Recommendations—or type your own prompt. Whatagraph reads your actual Instagram data and writes insights in seconds, in 18 languages.

No hallucinations, no data breaches—everything stays secure within Whatagraph, not an external AI tool like ChatGPT.

2. Followers Overview

Instagram Report Template - Dashboard with follower demographics, charts, and statistics.

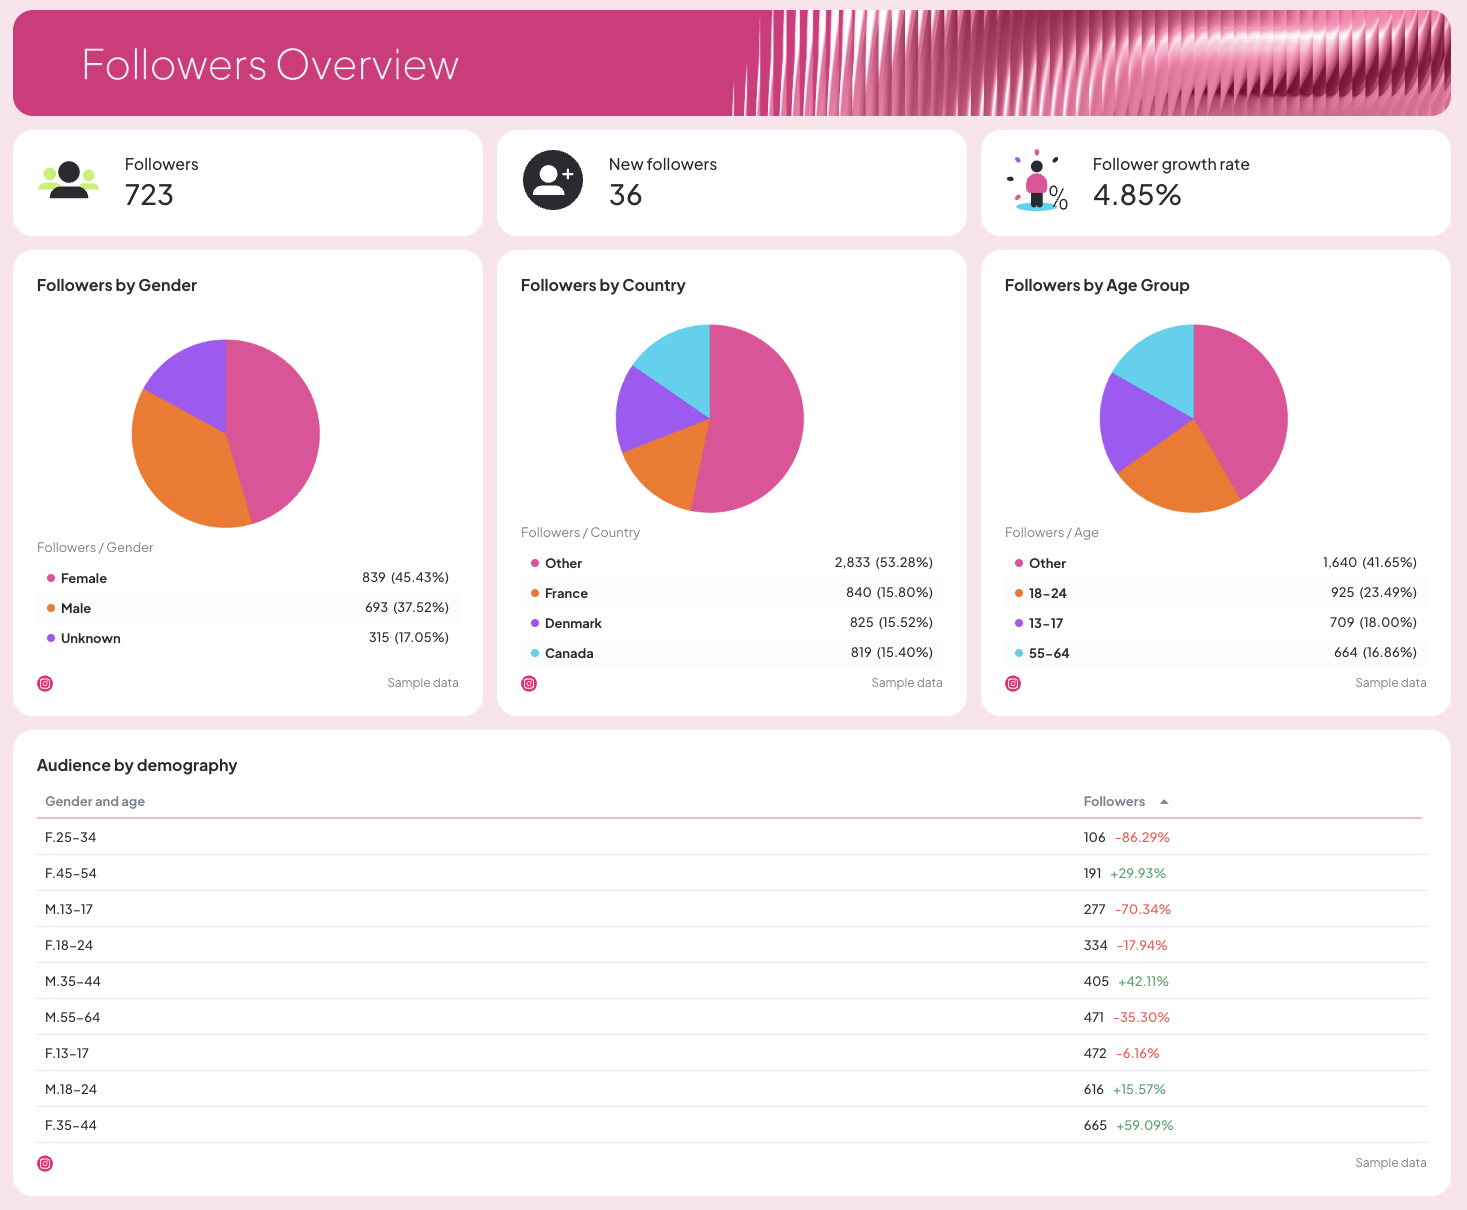
Show who’s following and how your audience demographics are changing.

Your report should include:

  • Total followers, new followers, and follower growth rate.
  • Charts breaking down followers by gender, country, and age group.
  • An audience demography table for a deeper view of who engages most.

This section helps your marketing team tailor your content strategy and track follower growth across campaigns.

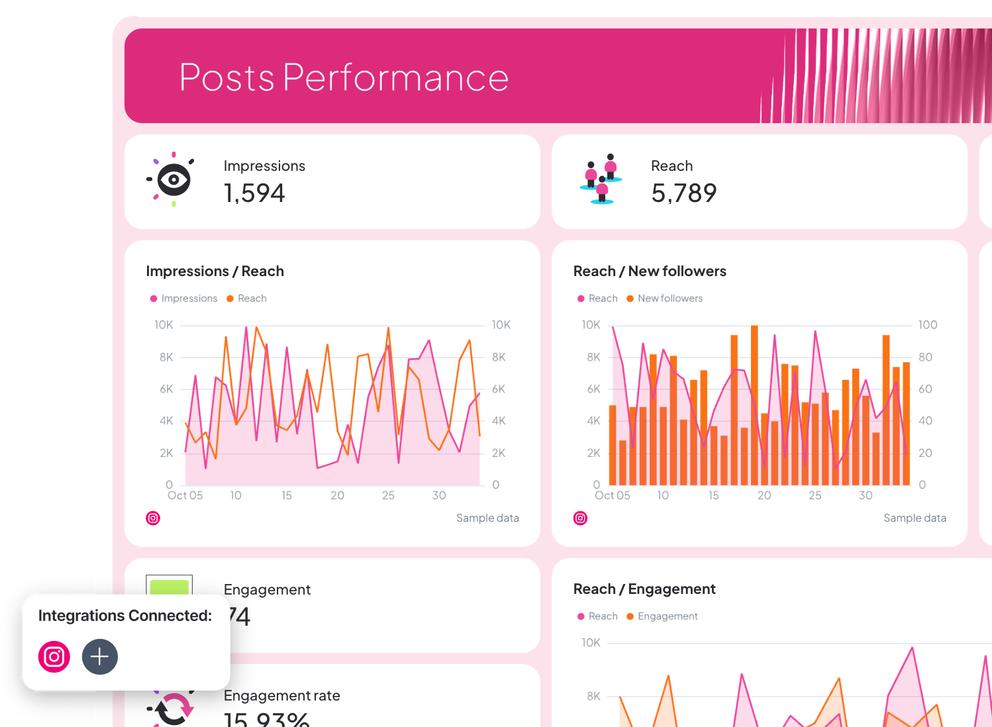
3. Posts Performance

Instagram Report - Dashboard showing social media posts performance metrics.

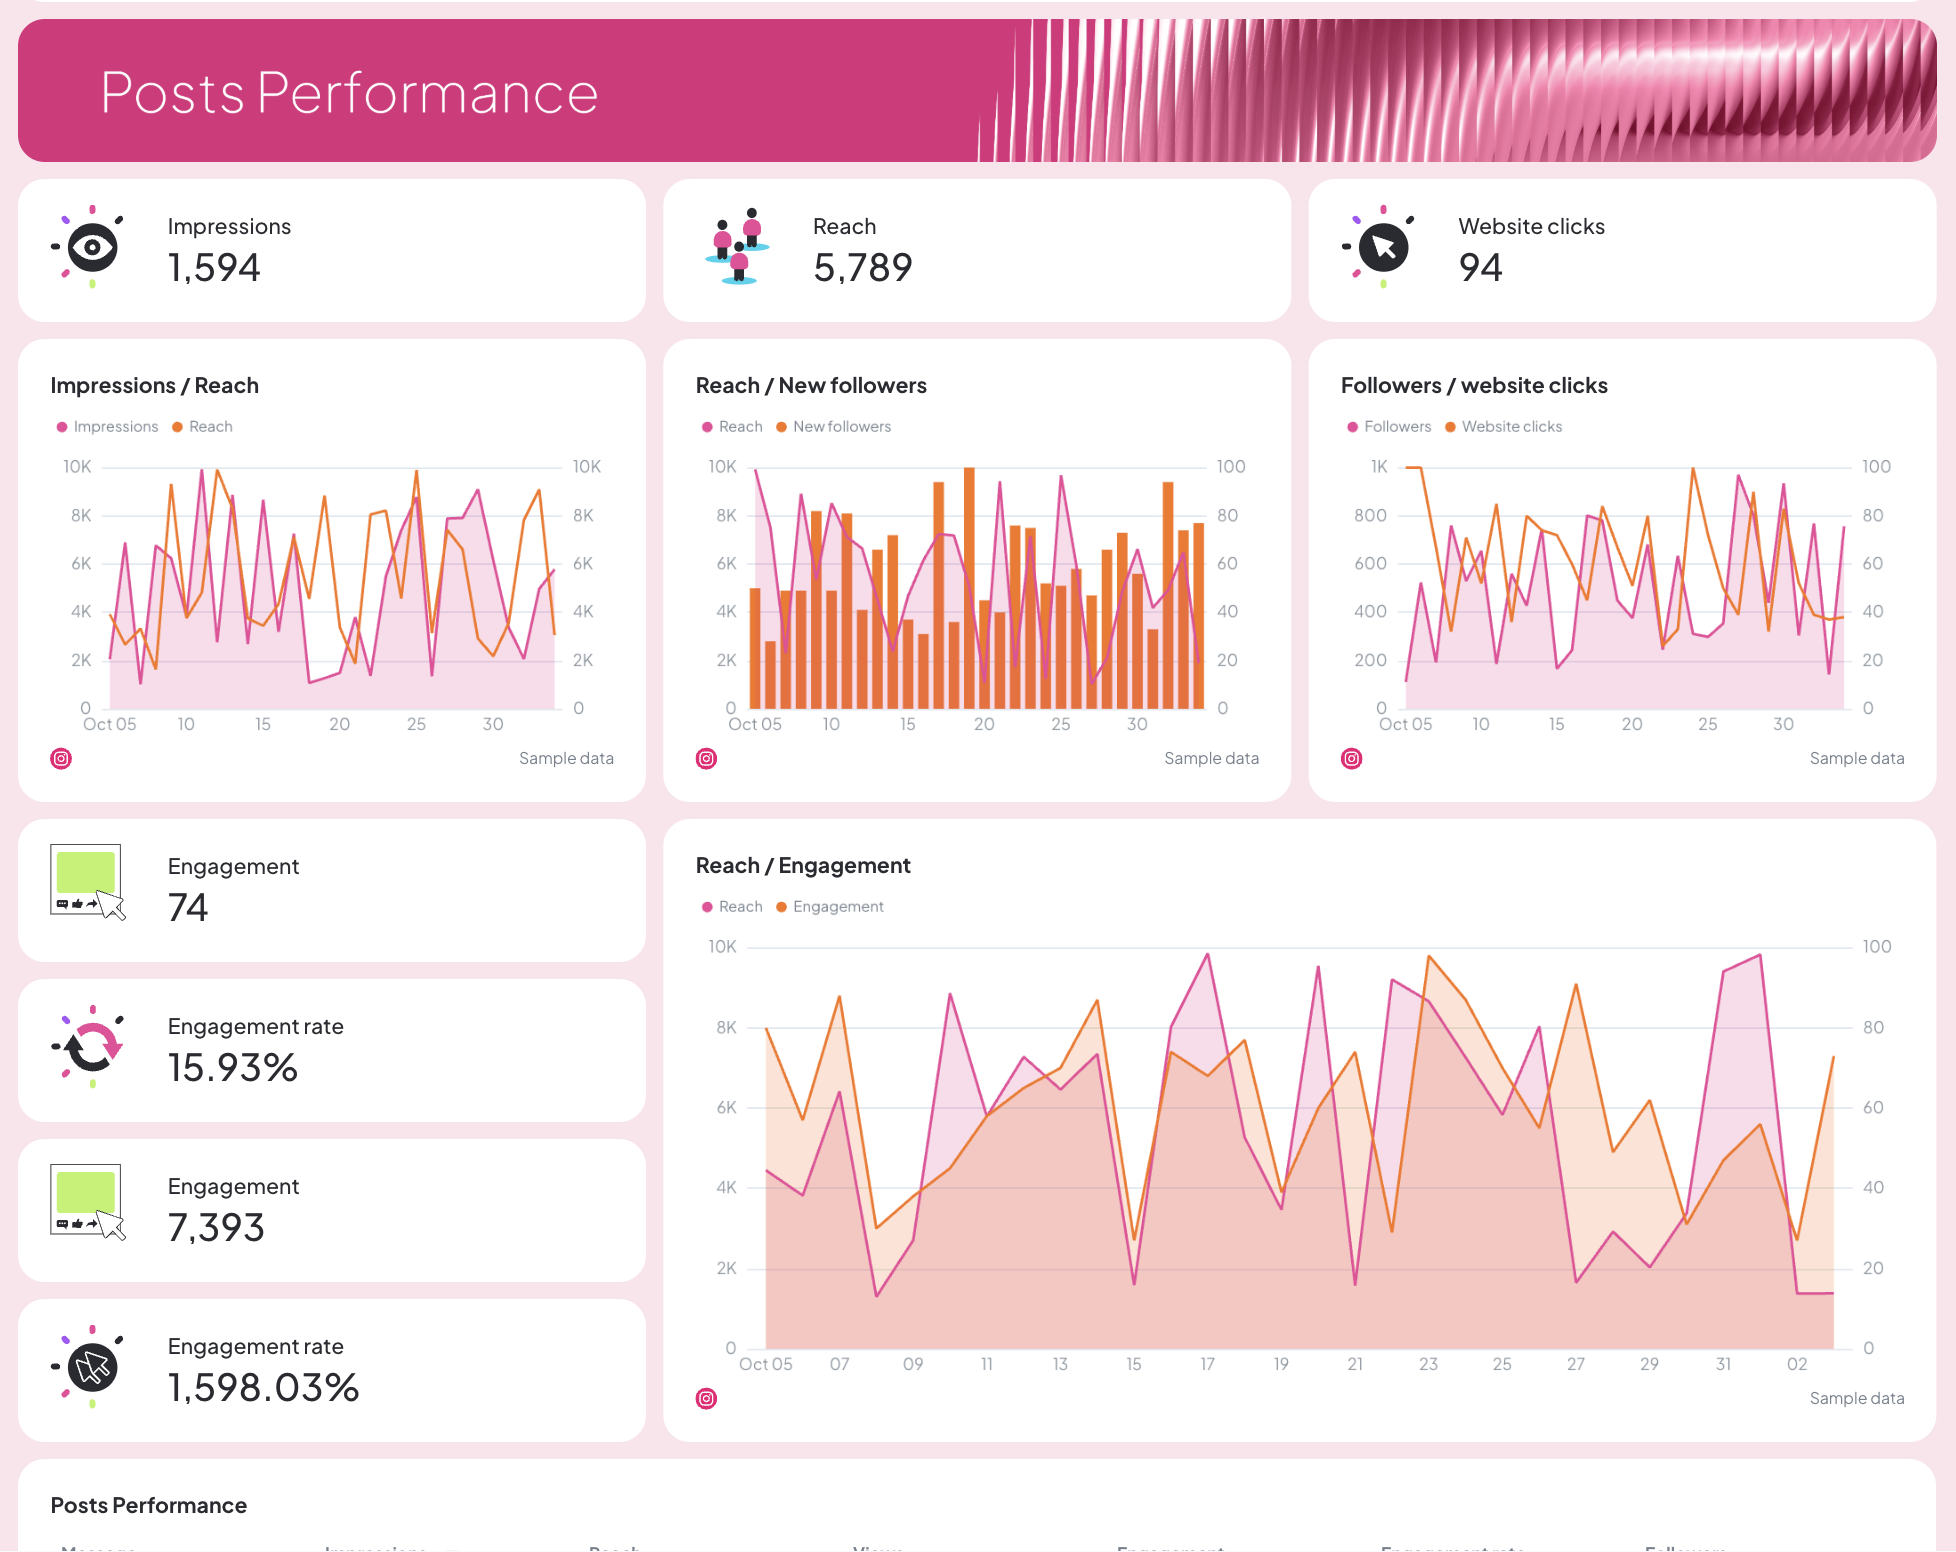
Visualize how your posts perform with clean charts and comparisons:

  • Core metrics like impressions, reach, and website clicks.
  • Graphs comparing impressions vs. reach, reach vs. new followers, and followers vs. clicks.
  • Engagement and engagement rate widgets, plus charts comparing reach vs. engagement.
  • A table showing post-by-post performance and key metrics like likes, comments, and engagement rate.
  • A carousel gallery of your top-performing posts, complete with engagement metrics and visual previews.
Instagram Report Template - Two tables showing posts performance and engagement metrics.

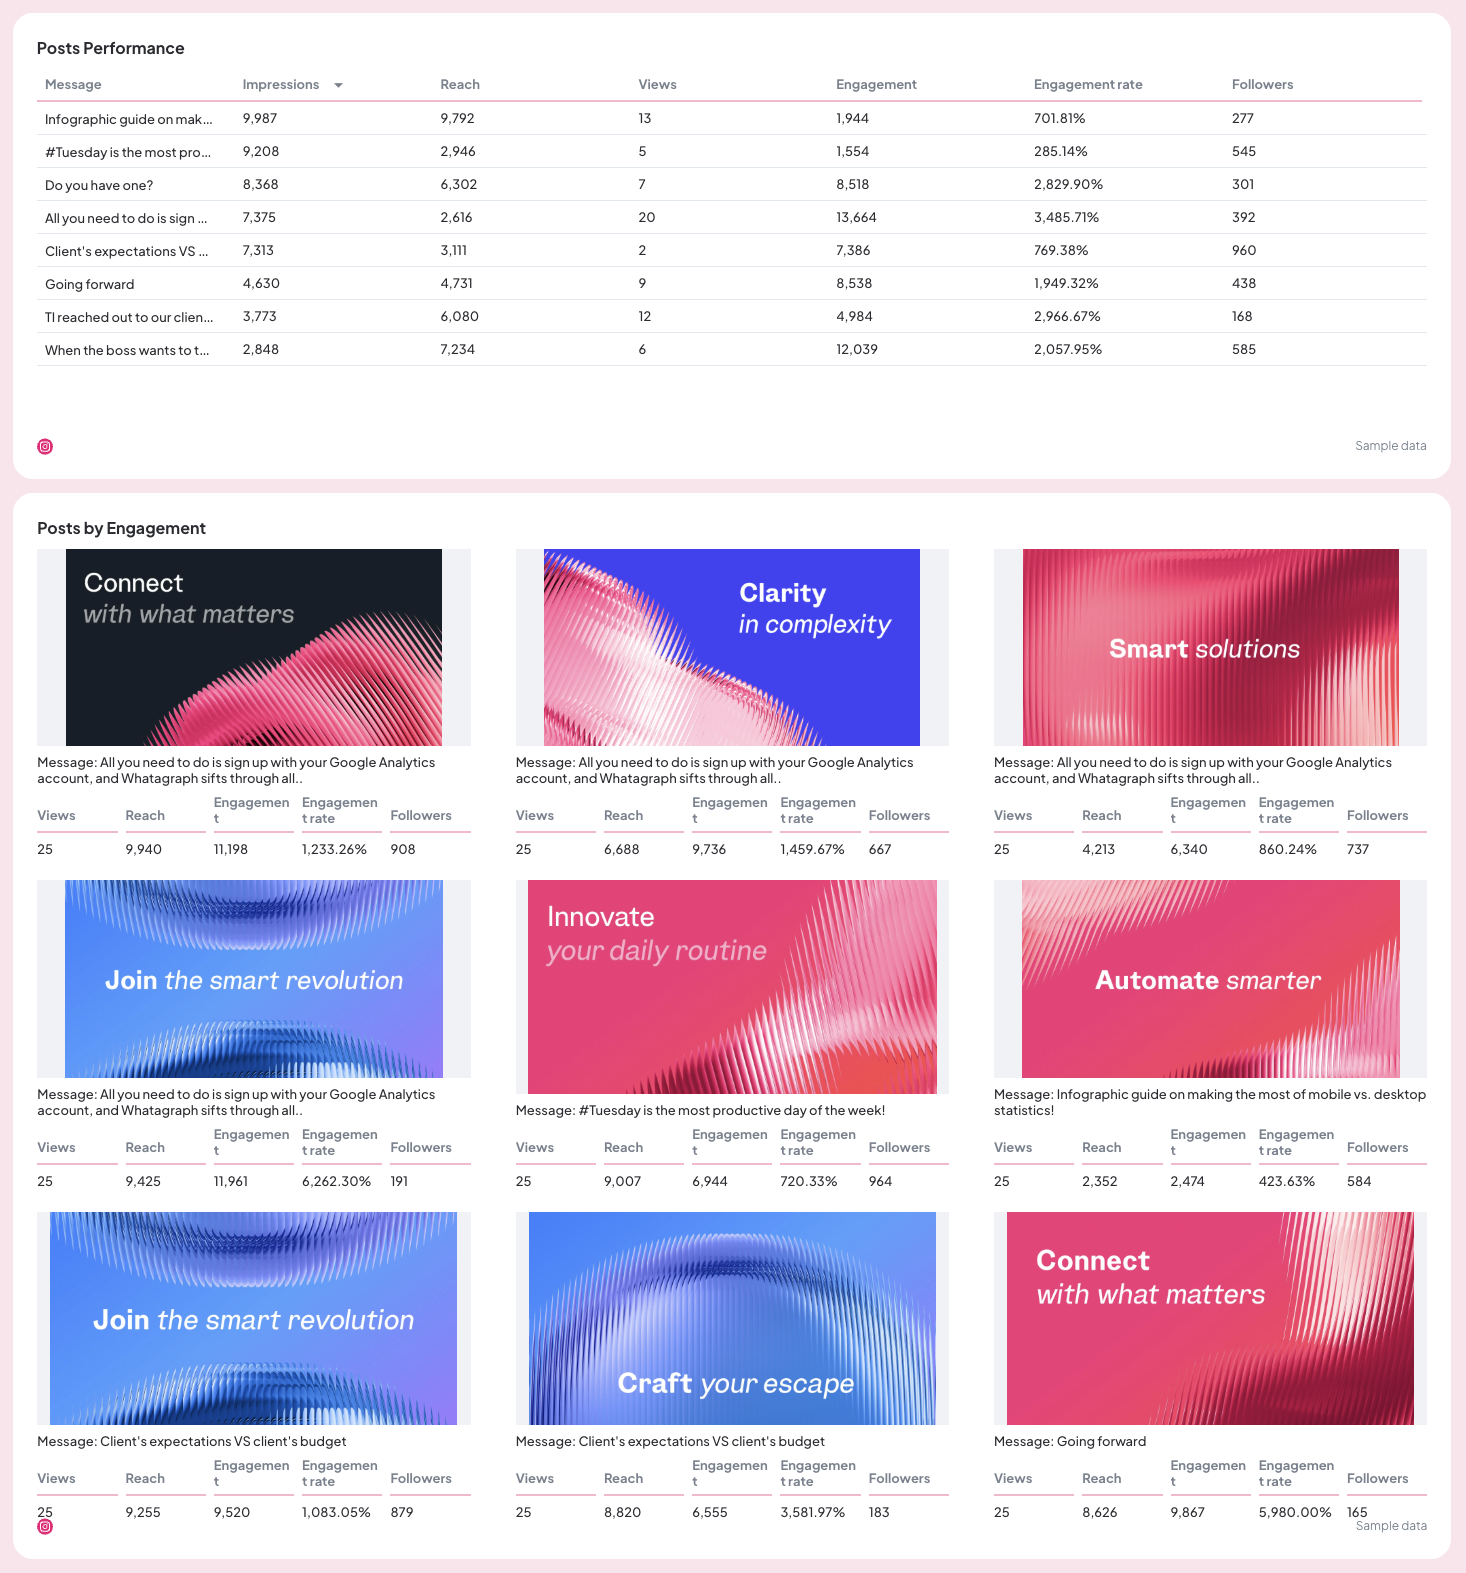
This is where Whatagraph dashboards make it easy to spot trends, optimize your strategy, and showcase content performance clearly to stakeholders.

4. Stories Performance

Stories Performance - Stories performance report with tables and graphs in pink theme.

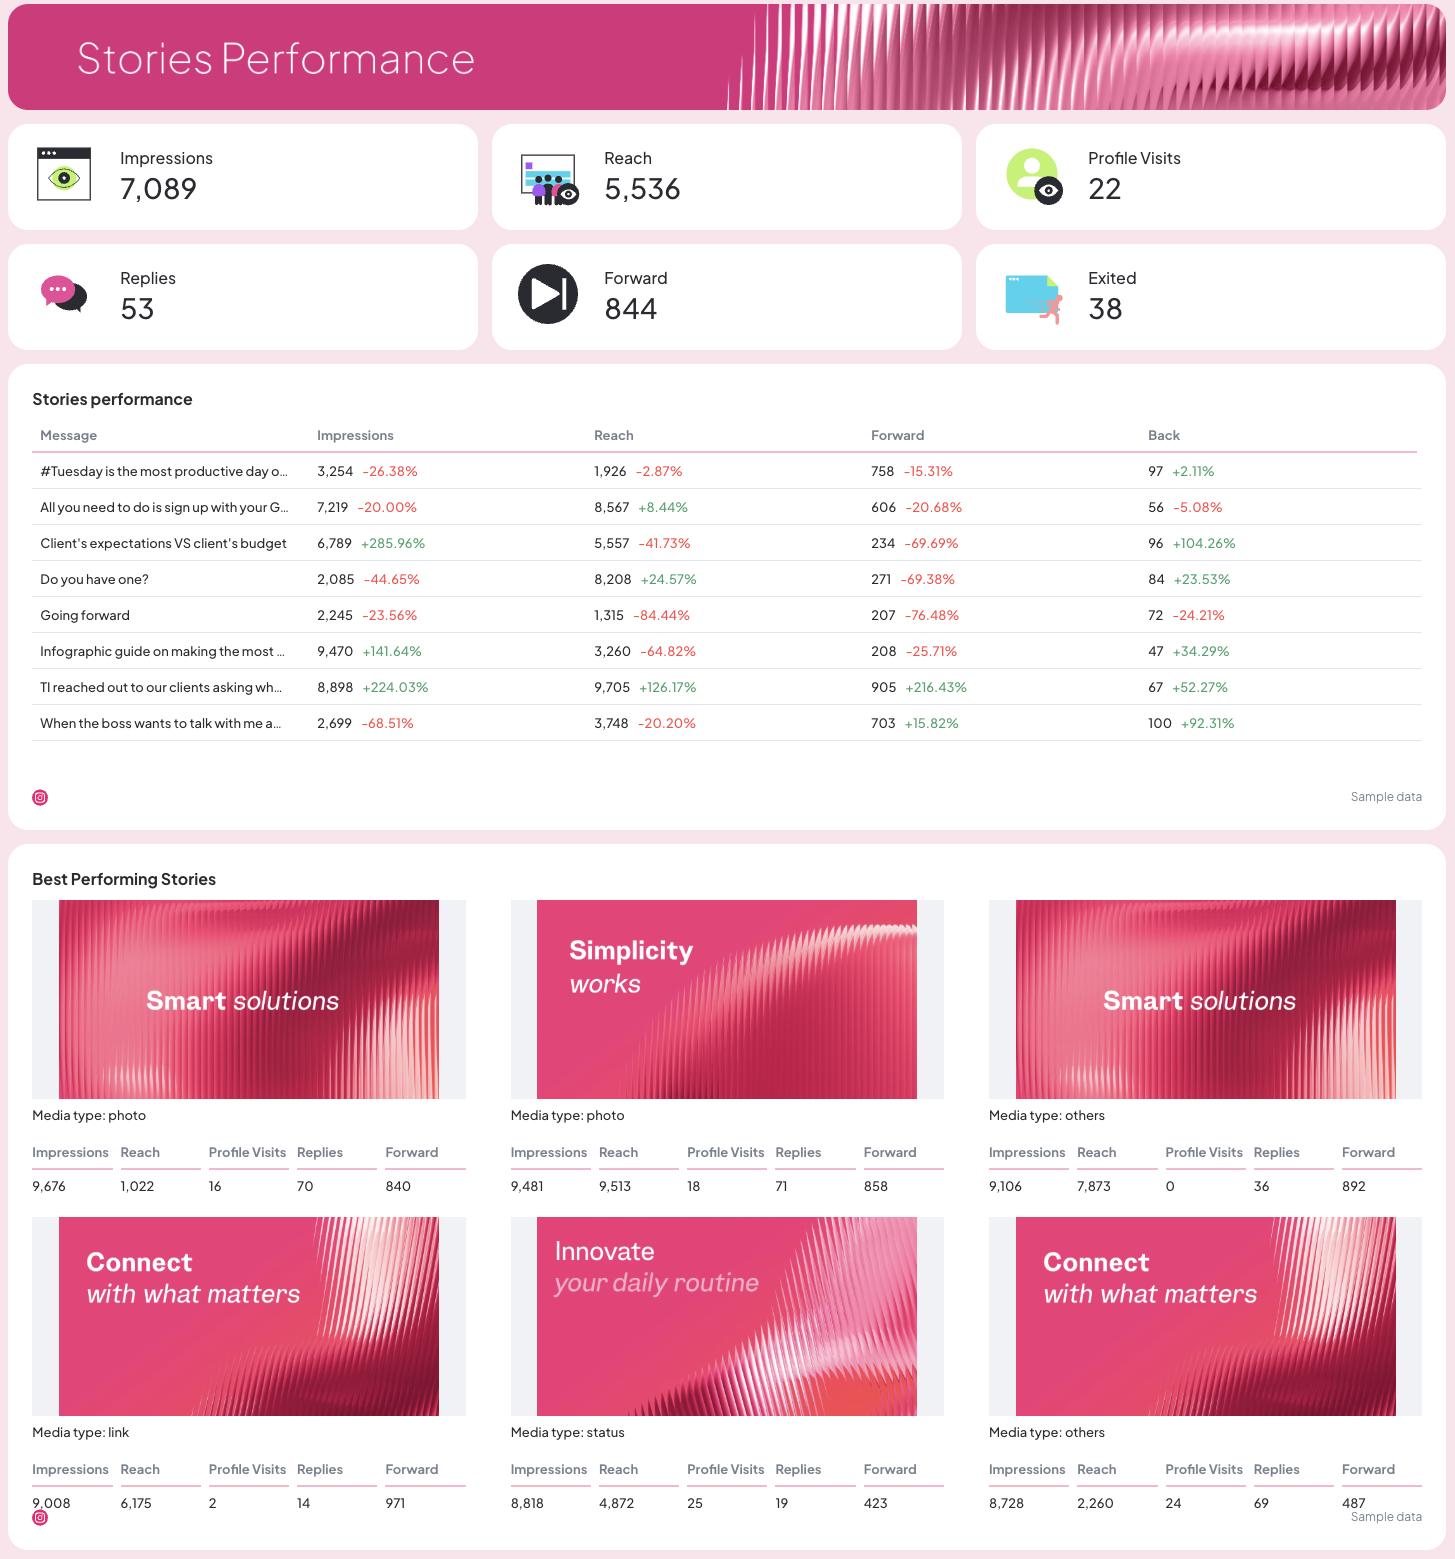
Stories deserve their own spotlight.

Include metrics like:

  • Impressions, reach, profile visits, replies, forwards, and exits.
  • A performance table that breaks down each story’s results by key data points.
  • A carousel of best-performing stories to highlight what resonates most with your audience.

These visuals help your social media managers pinpoint which stories drive engagement and which need refining.

5. Reels Performance

Instagram Report Template - Performance dashboard with metrics like impressions, reach, and engagement.

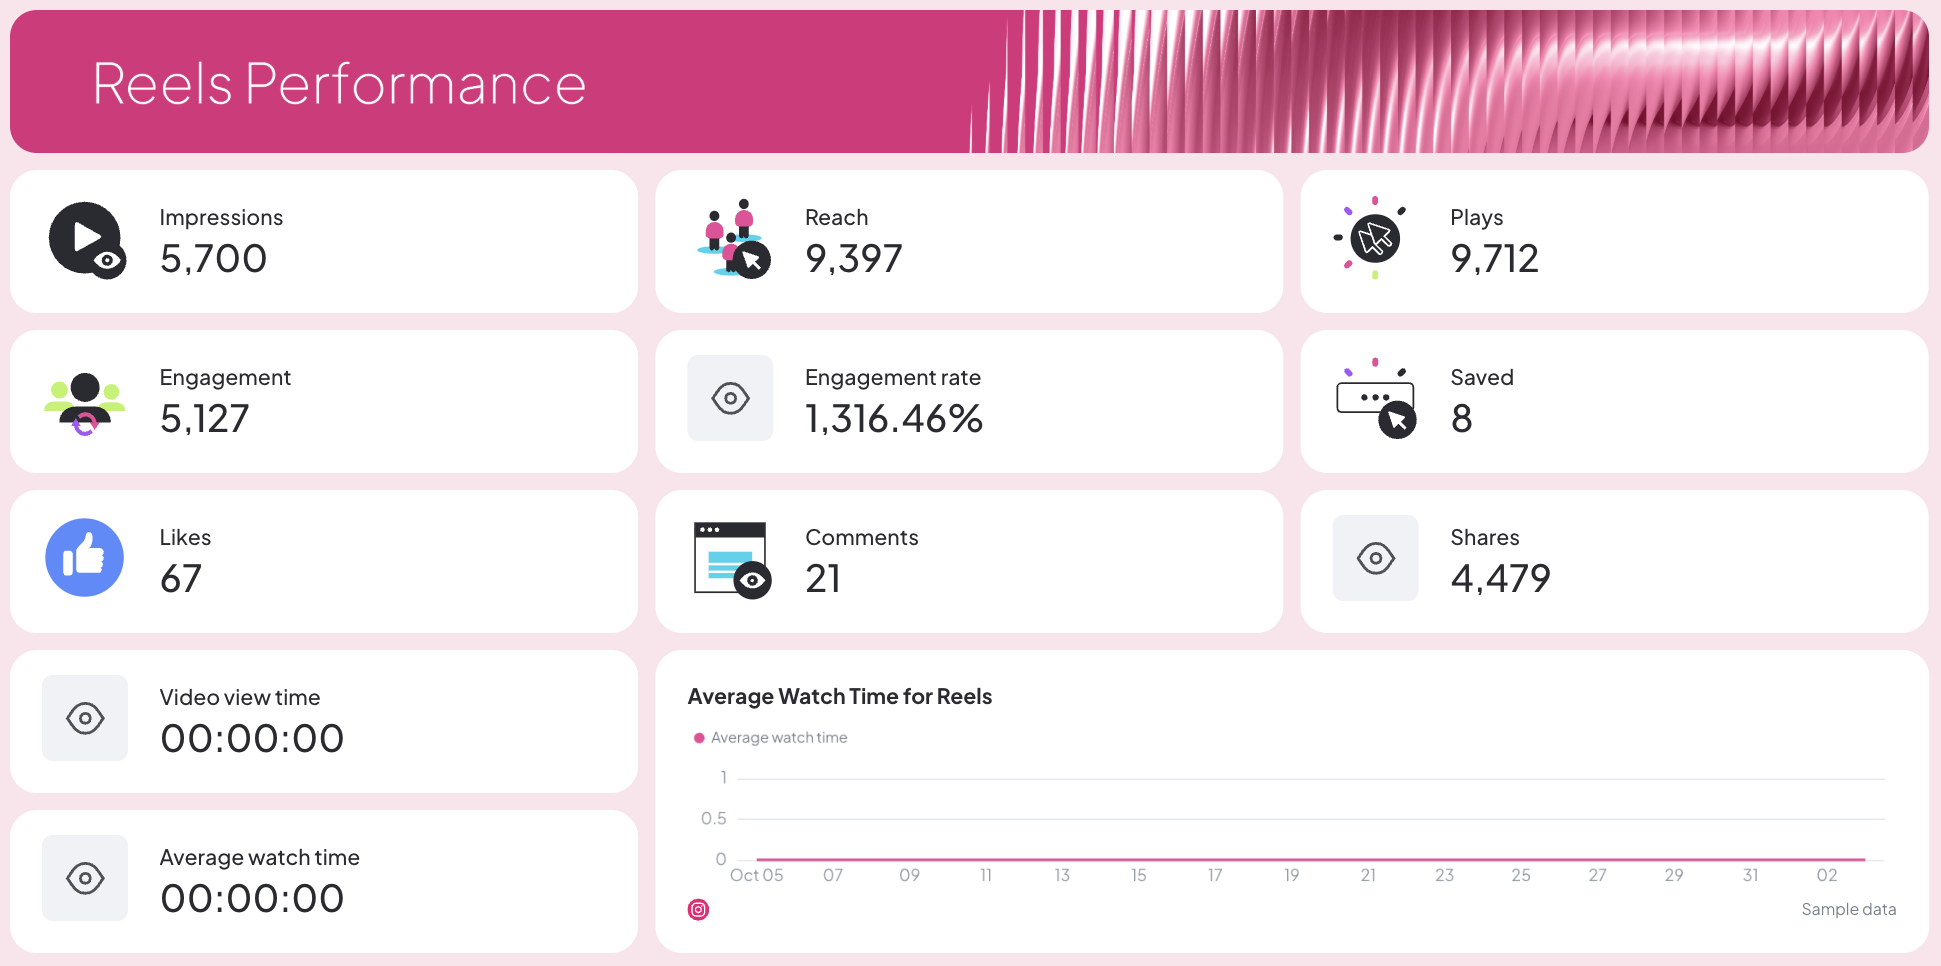
Your report should also track reel performance to capture full-funnel engagement:

  • Core metrics like impressions, reach, plays, engagement, engagement rate, likes, saves, shares, comments, and watch time.
  • A detailed table comparing reels by each performance metric.
  • A carousel of top-performing reels that visually displays which video formats and topics drive the best results.
Instagram Report Template - A dashboard of top performing Instagram reels with performance metrics.

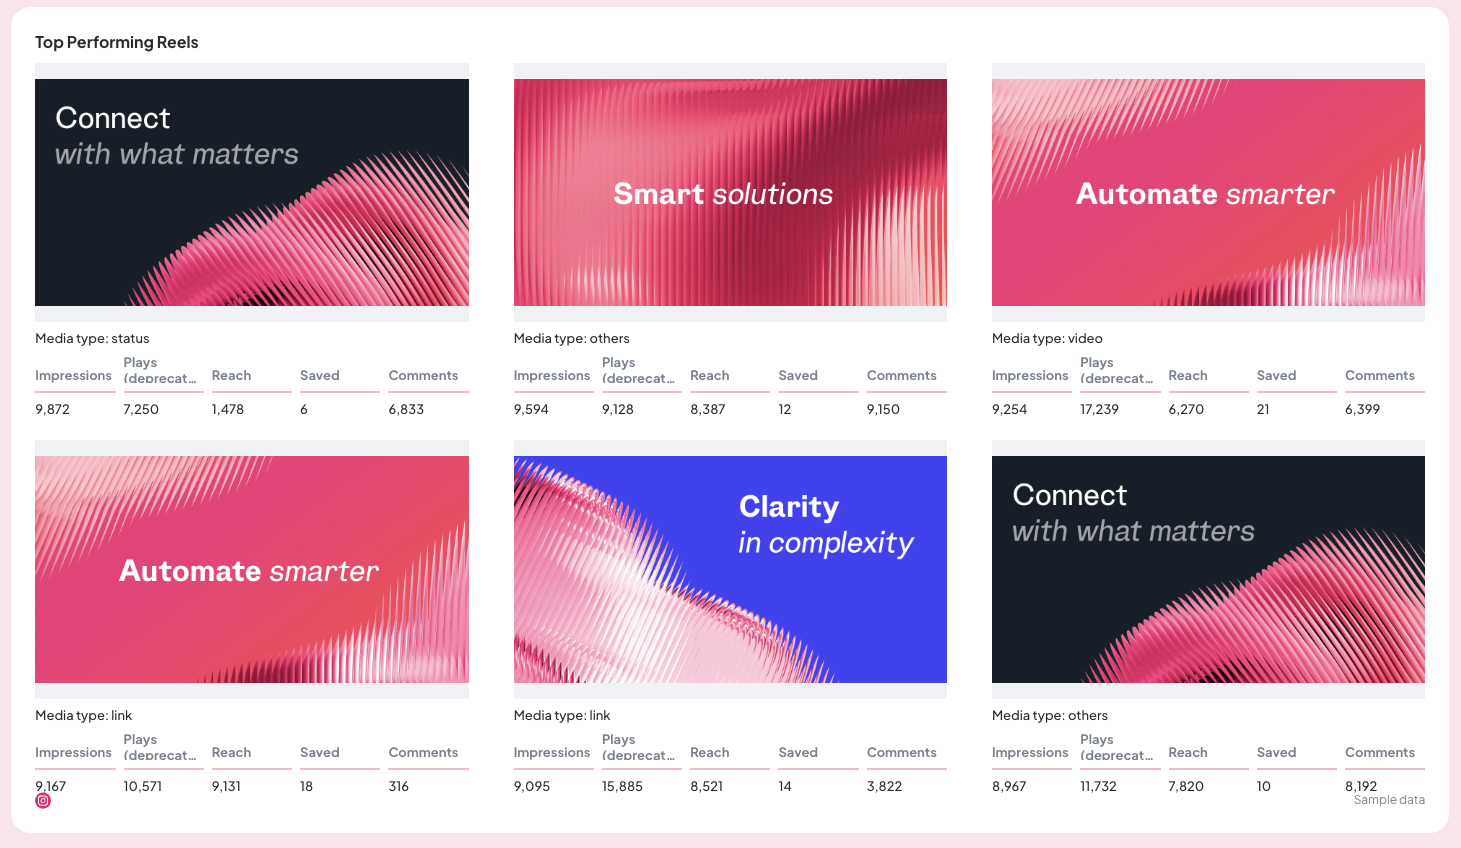
This section helps you understand what kind of content truly boosts engagement and conversions on Instagram.

Why Marketers Love Reporting With Whatagraph

Whatagraph's AI is saving so much time and energy for our marketing specialists. We now have more time to focus on strategic things that help both our agency and our clients grow.

Lars Maat

Lars Maat

Co-Founder @ Maatwerk Online

StarStarStarStarStar

Whatagraph took us to the next level with our clients and within our team. Our relationships with clients have been amazing, and we’ve even been able to retain them longer.

Kim Strickland

Kim Strickland

Digital Marketing Specialist @ Peak Seven

StarStarStarStarStar

Whatagraph has become an essential partner for scaling our reporting, and my teams love it because it saves so much time. We’d recommend it to any team looking to automate data reporting and use AI for insights.

Danielle Roberts

Danielle Roberts

Director of Implementation & Support @ Rentable

StarStarStarStarStar

Whatagraph is easy to use, visually attractive, and much smoother compared to tools like Looker Studio.

Stef Oosterik

Stef Oosterik

Quality Manager @ Dtch. Digitals

StarStarStarStarStar

Frequently Asked Questions

Have more questions? We answered them here.

How to write an Instagram report?

Start by defining your reporting period and goals. Then, pull in your key metrics—like reach, engagement, clicks, and follower growth—and explain what they mean for your overall Instagram performance.


In Whatagraph, you can skip the manual setup entirely. Just use the ready-made Instagram report template, connect your account, and Whatagraph automatically builds the dashboard and fills in the data for you.

What metrics to include in Instagram reporting templates?

An effective Instagram reporting template should track all your KPIs in one view. Include:


  • Reach and impressions to show visibility
  • Engagement rate, likes, comments, and saves to measure interaction
  • Follower growth and audience demographics to understand who’s engaging
  • Clicks and conversion rate to connect content with business goals


These key metrics help your marketing team turn data into actionable insights.

How do I create an effective Instagram report template?

Focus on clarity, automation, and storytelling. Use Whatagraph to:


  • Bring data from your Instagram accounts and data sources into the platform. 
  • Visualize key performance indicators using report templates or drag-and-drop widgets.
  • Organize your data, add summaries, and style your reports using AI. 
  • Automate reports or share live links


With Whatagraph, you’ll get a clean, easy-to-share Instagram marketing report that your stakeholders will actually read.

Where can I find free Instagram report templates?

You can find free Instagram report templates on Whatagraph! Here are a few:


These templates were built for social media managers and agencies who want to track and share results without spending hours in Google Sheets or spreadsheets. Just create a free account, connect your sources, and start reporting instantly.

Can you customize Whatagraph’s Instagram report template?

Yes. Every report template in Whatagraph is fully customizable. You can add or remove widgets, adjust your KPIs, edit charts, and even apply white-label branding with your logo and colors.


You can also build custom reports for different social media platforms like Facebook, LinkedIn, or TikTok—so your marketing strategy stays consistent across every channel.