

What is an Instagram analytics report template?
An Instagram analytics report template is a pre-built layout that pulls your Instagram account data into one structured, visual format - so you can track key metrics and share results with clients or stakeholders without rebuilding everything from scratch each month.
For most social media managers and agencies, Instagram reporting looks like this:
❌ Log in to Instagram Insights
❌ Export what you can
❌ Paste numbers into a spreadsheet or slide deck
❌ Format the metrics manually
❌ Write context around them
❌ Repeat that cycle for every client, every reporting period
This process is slow, it's inconsistent, and it doesn't scale.
The business case for getting Instagram marketing reporting right is real. With nearly 3 billion monthly active users (according to Statista’s 2025 data), Instagram is where audiences are. And per HubSpot's 2026 report, 48% of marketers say Instagram delivers the highest ROI of any social platform. The audience and the results are both there. The challenge is proving it to clients - clearly and consistently.
A well-built Instagram analytics report template solves that. It gives marketing teams and agencies a repeatable way to:
✅ Track key Instagram metrics like reach, engagement rate, follower growth, and impressions in one place
✅ Break down content performance by post type - photos, carousels, Reels, and Stories - to see what's actually resonating
✅ Show audience demographics, including age, gender, city, and country, to confirm you're reaching the right people
✅ Visualize trends over time and compare periods without manually pulling data
✅ Share polished, branded reports with clients through live links, scheduled emails, or PDFs
An Instagram reporting tool with AI - like Whatagraph IQ - take this further. Once your Instagram report template is live:
1. Whatagraph IQ writes performance summaries automatically from your actual report data
2. IQ brands the whole report to match each client in seconds - simply upload the client’s logo or image
3. IQ Chat gives the option for clients to ask questions about the data and get plain-language answers instantly.
Not only this, IQ helps to build the actual report for you - just type what you need, and it assembles the full layout, widgets, and charts in seconds.
For agencies managing multiple Instagram accounts, the time savings can be real.
Achtzehn Grad, a full-service creative agency based in Vienna, now saves 5 hours per new report after switching to Whatagraph - cutting what used to take half a day down to 30 minutes.
The biggest reason we chose Whatagraph was because of its holistic approach to reporting. We can blend data from different channels and see in one view what's the performance and what needs to be changed. Whatagraph also saves time, looks great, and makes it easy for clients to understand reports. - Tanja Keglić, Performance Marketing Manager at Achtzehn Grad
What Should an Instagram Analytics Report Template Include?
A good Instagram analytics report template should give you and your team a full picture of your Instagram account growth, audience behavior, and content performance.
Here’s what to include:
1. Performance Summary
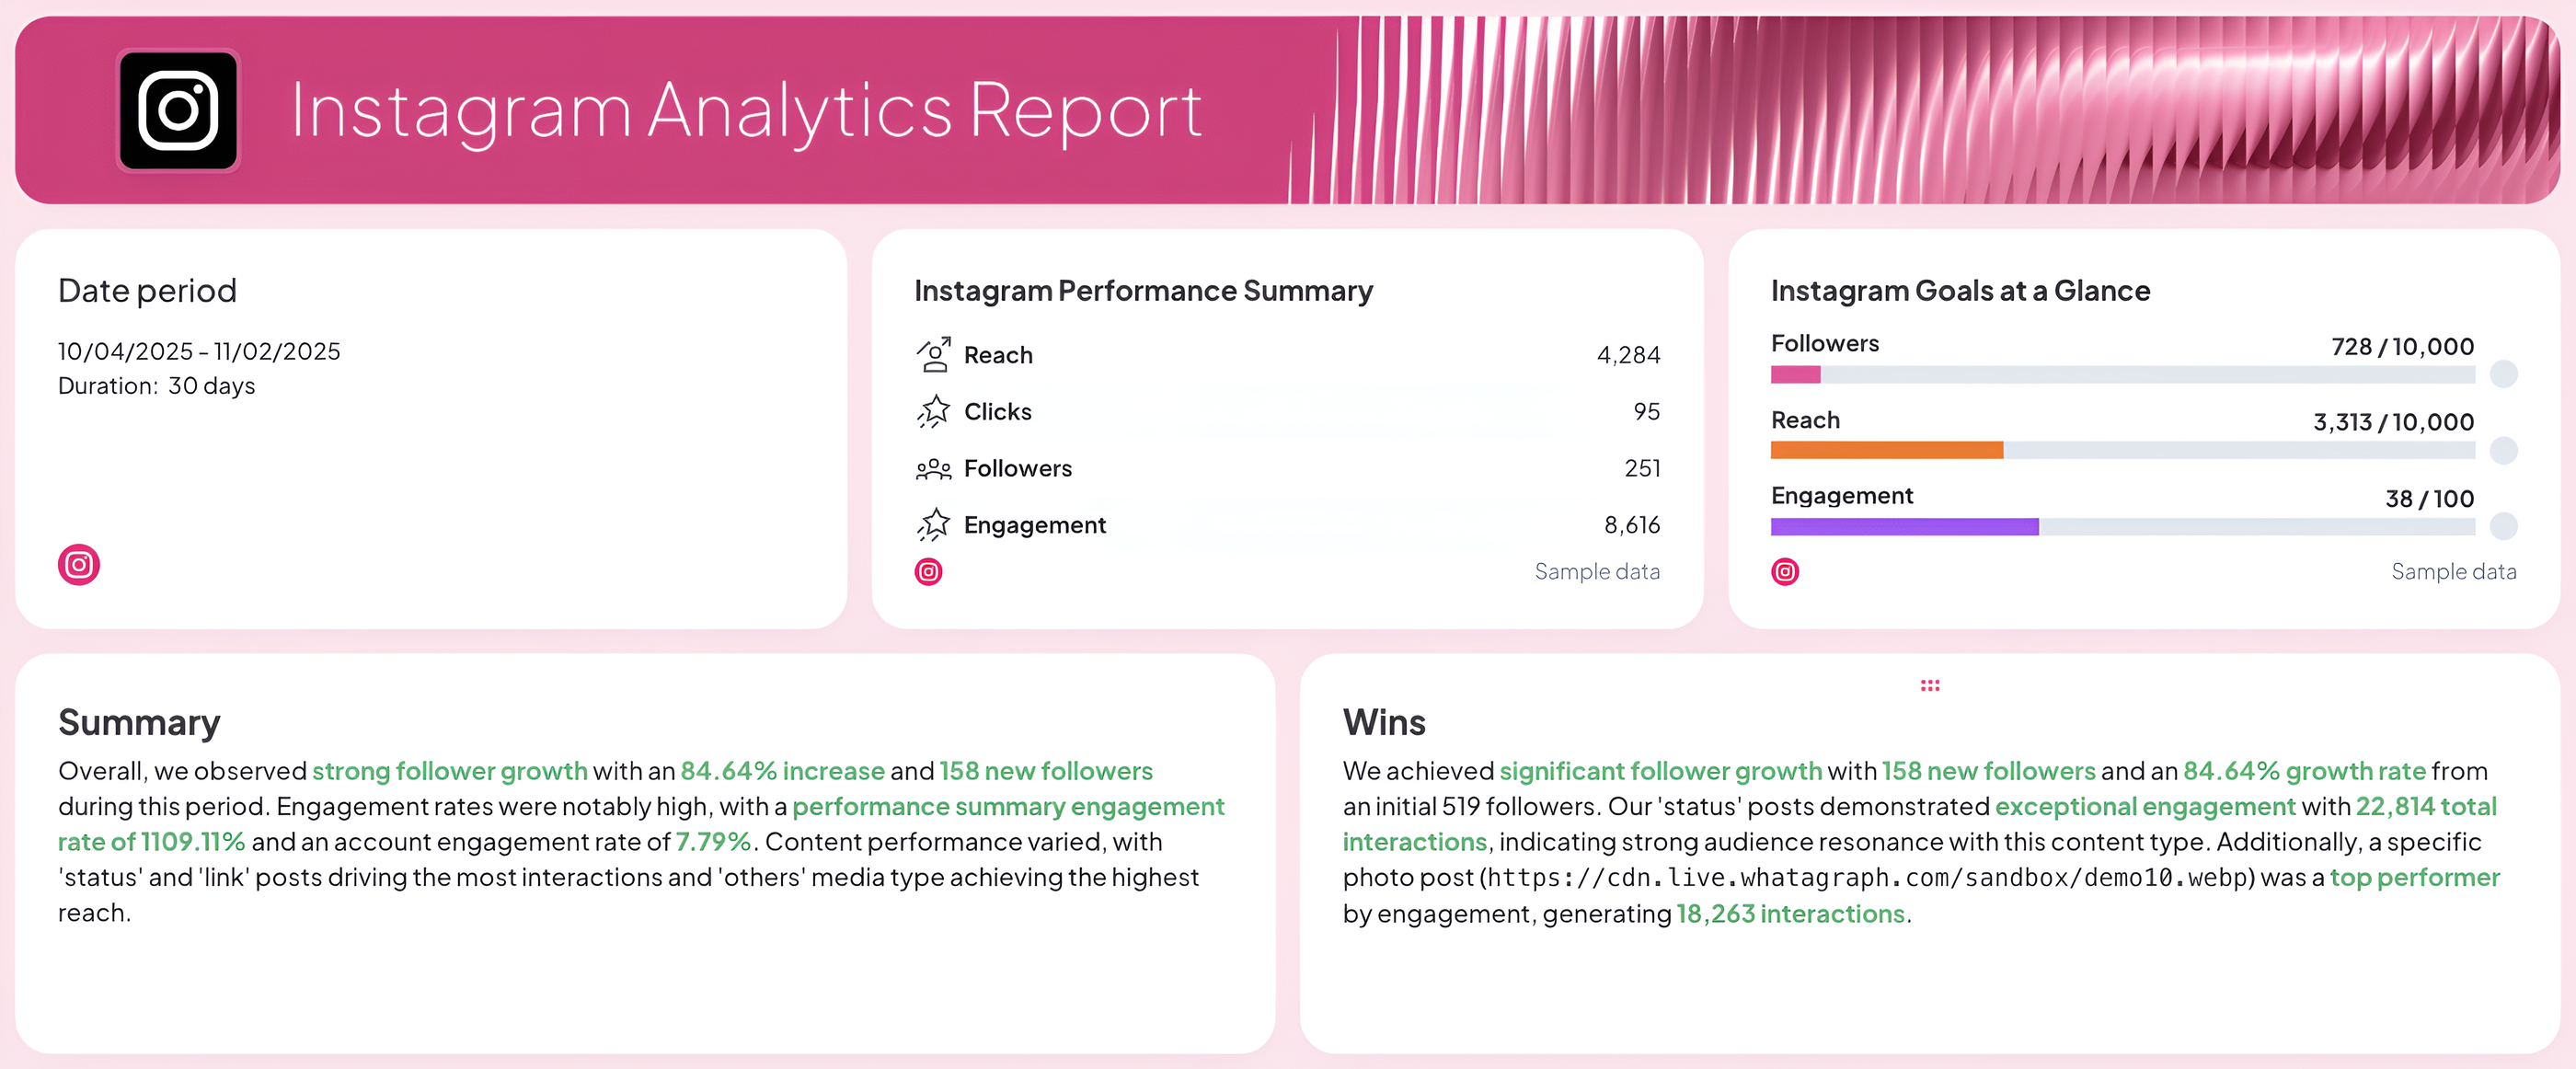 Start with the essentials:
- your reporting period
- a goal widget showing progress toward key KPIs
- and a performance summary list with the most important metrics like reach, clicks, followers, and engagement.
Add Summary and Wins text widgets to highlight growth areas, top-performing posts, and actionable insights.
With Whatagraph IQ Summary, you don’t need to write out summaries manually.
IQ analyzes the data on your report and automatically writes key insights in 18 different languages. You can also add custom prompts and fully edit the text after to fit your tone and voice.
2. Audience Breakdown
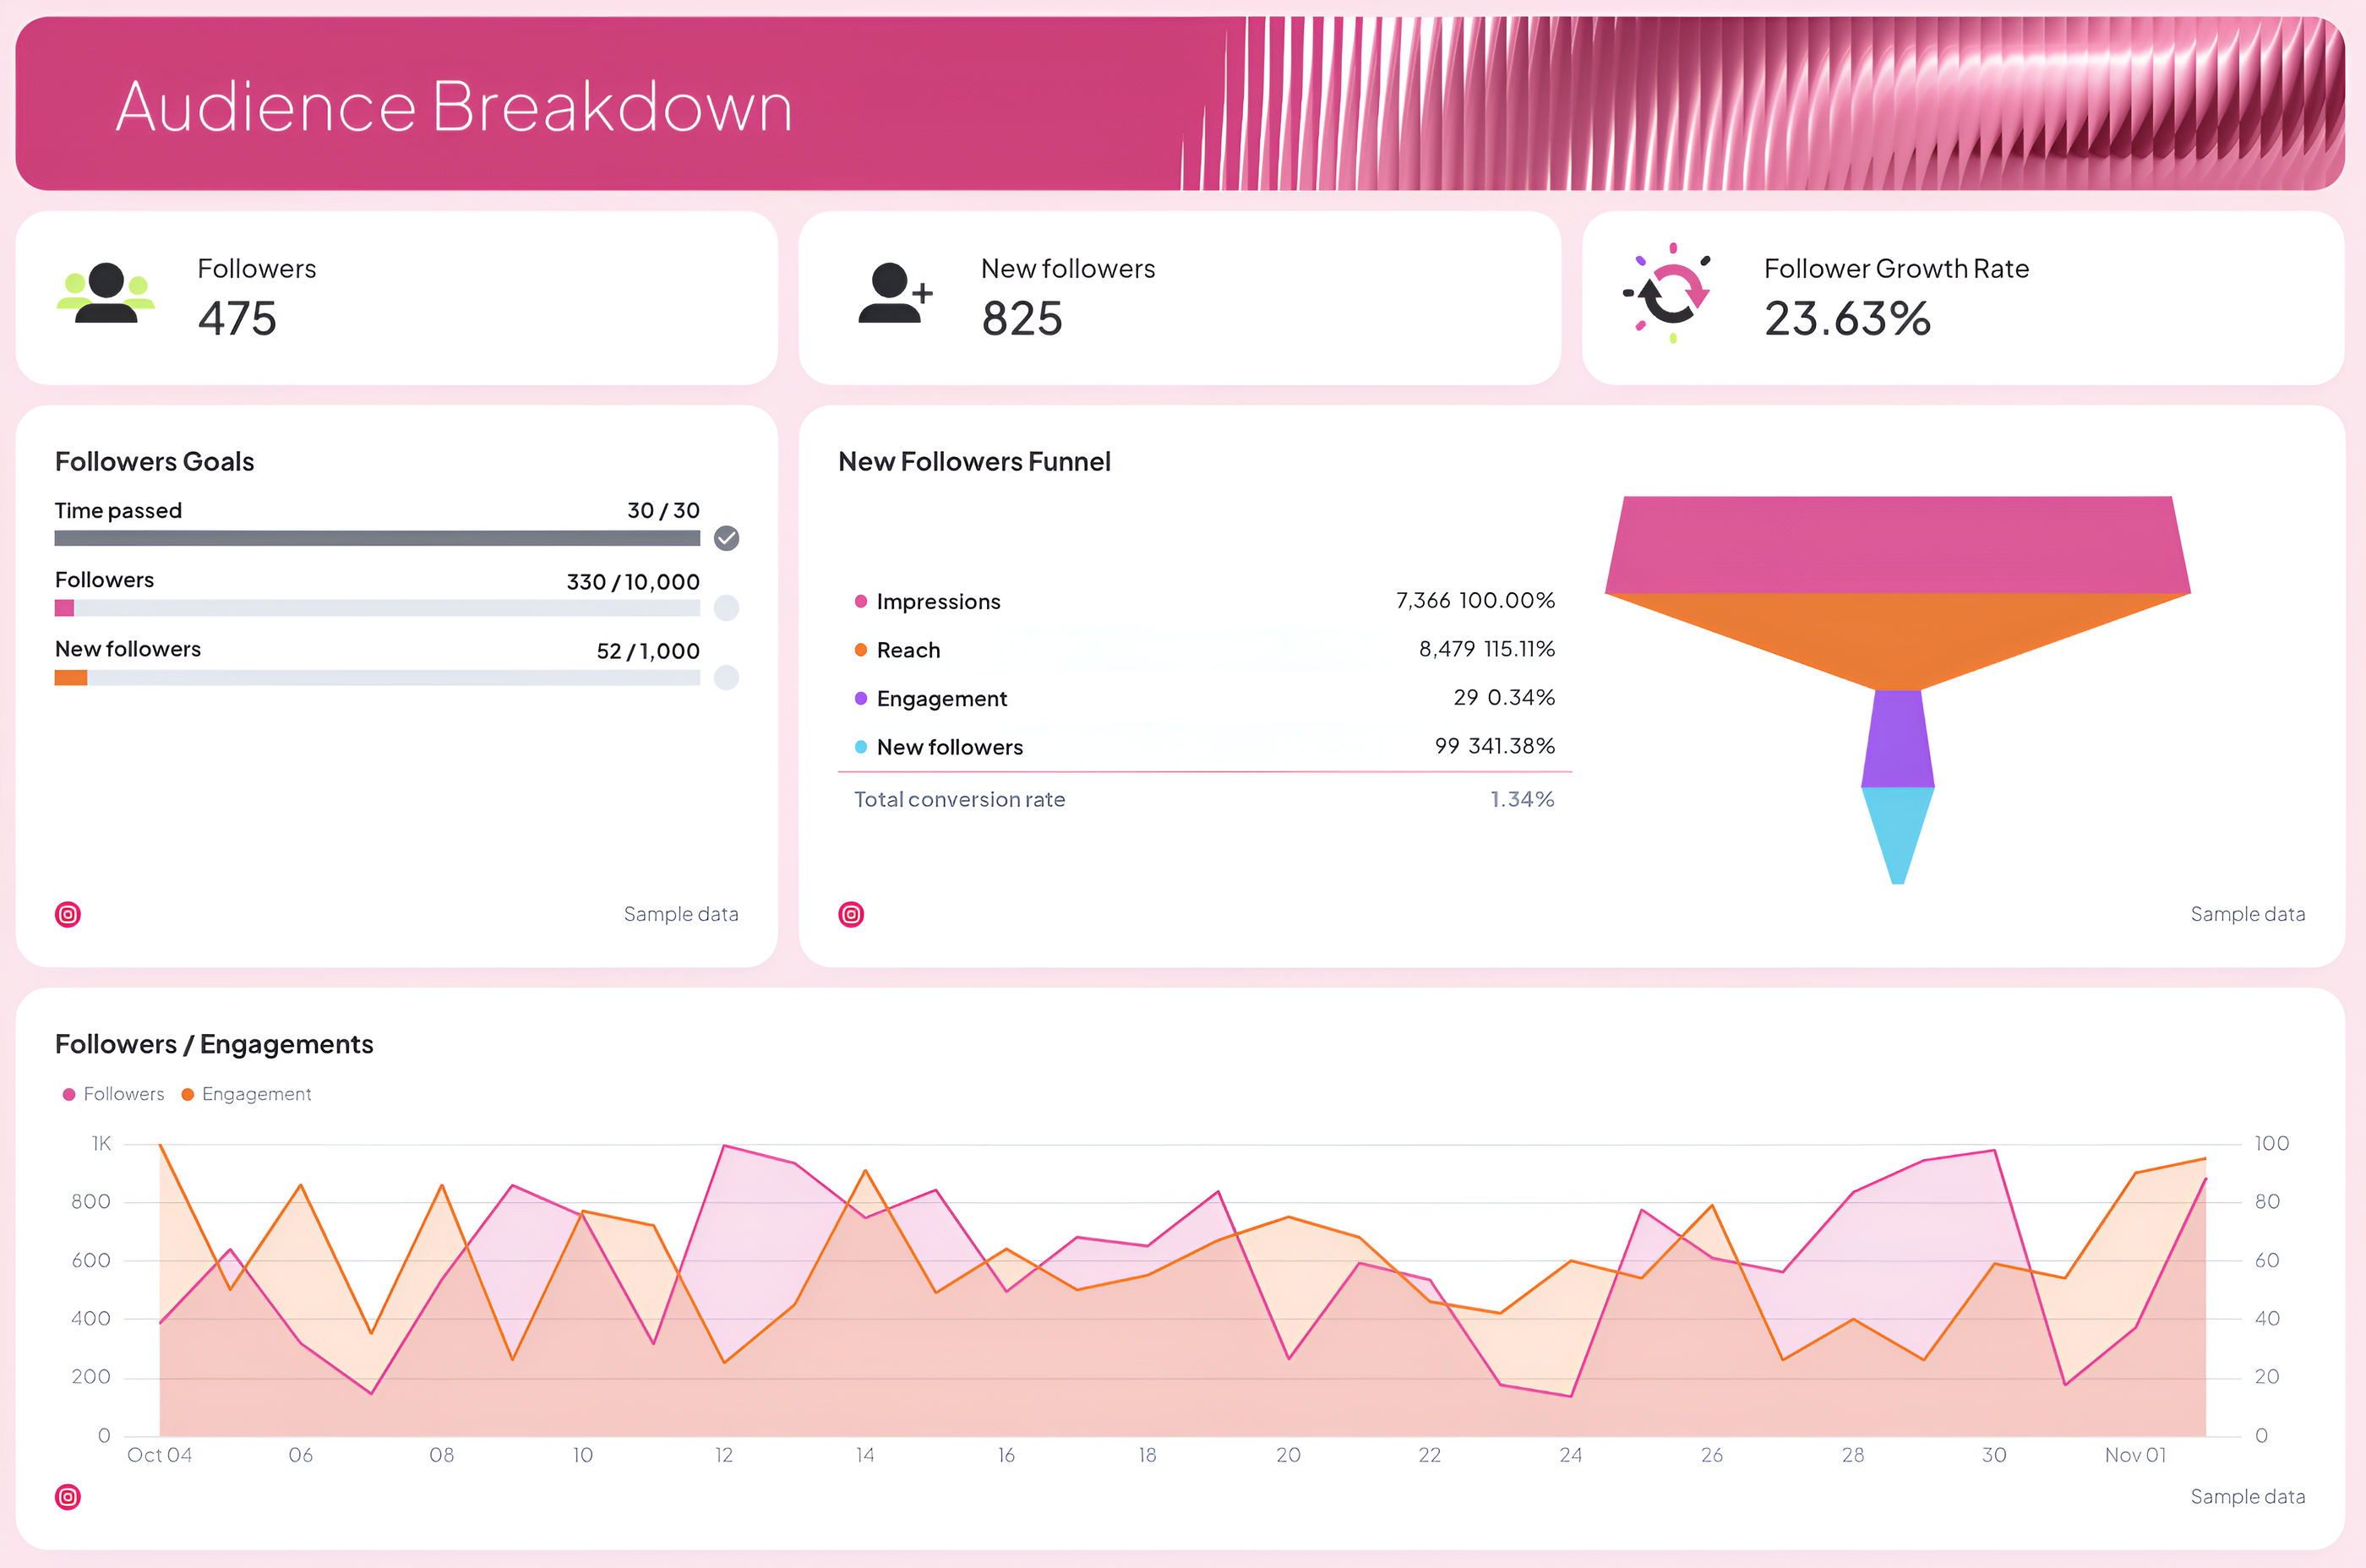
Track who’s following your account and how fast your audience is growing.
Include:
- Total followers, new followers, and follower growth rate
- Followers goals to visualize progress toward monthly or campaign targets
- A new followers funnel showing how impressions and engagement lead to new followers
- Followers demographics by age, gender, city, and country
This section helps your marketing team understand who’s engaging with your content and how your audience evolves over time.
3. Engagement Breakdown
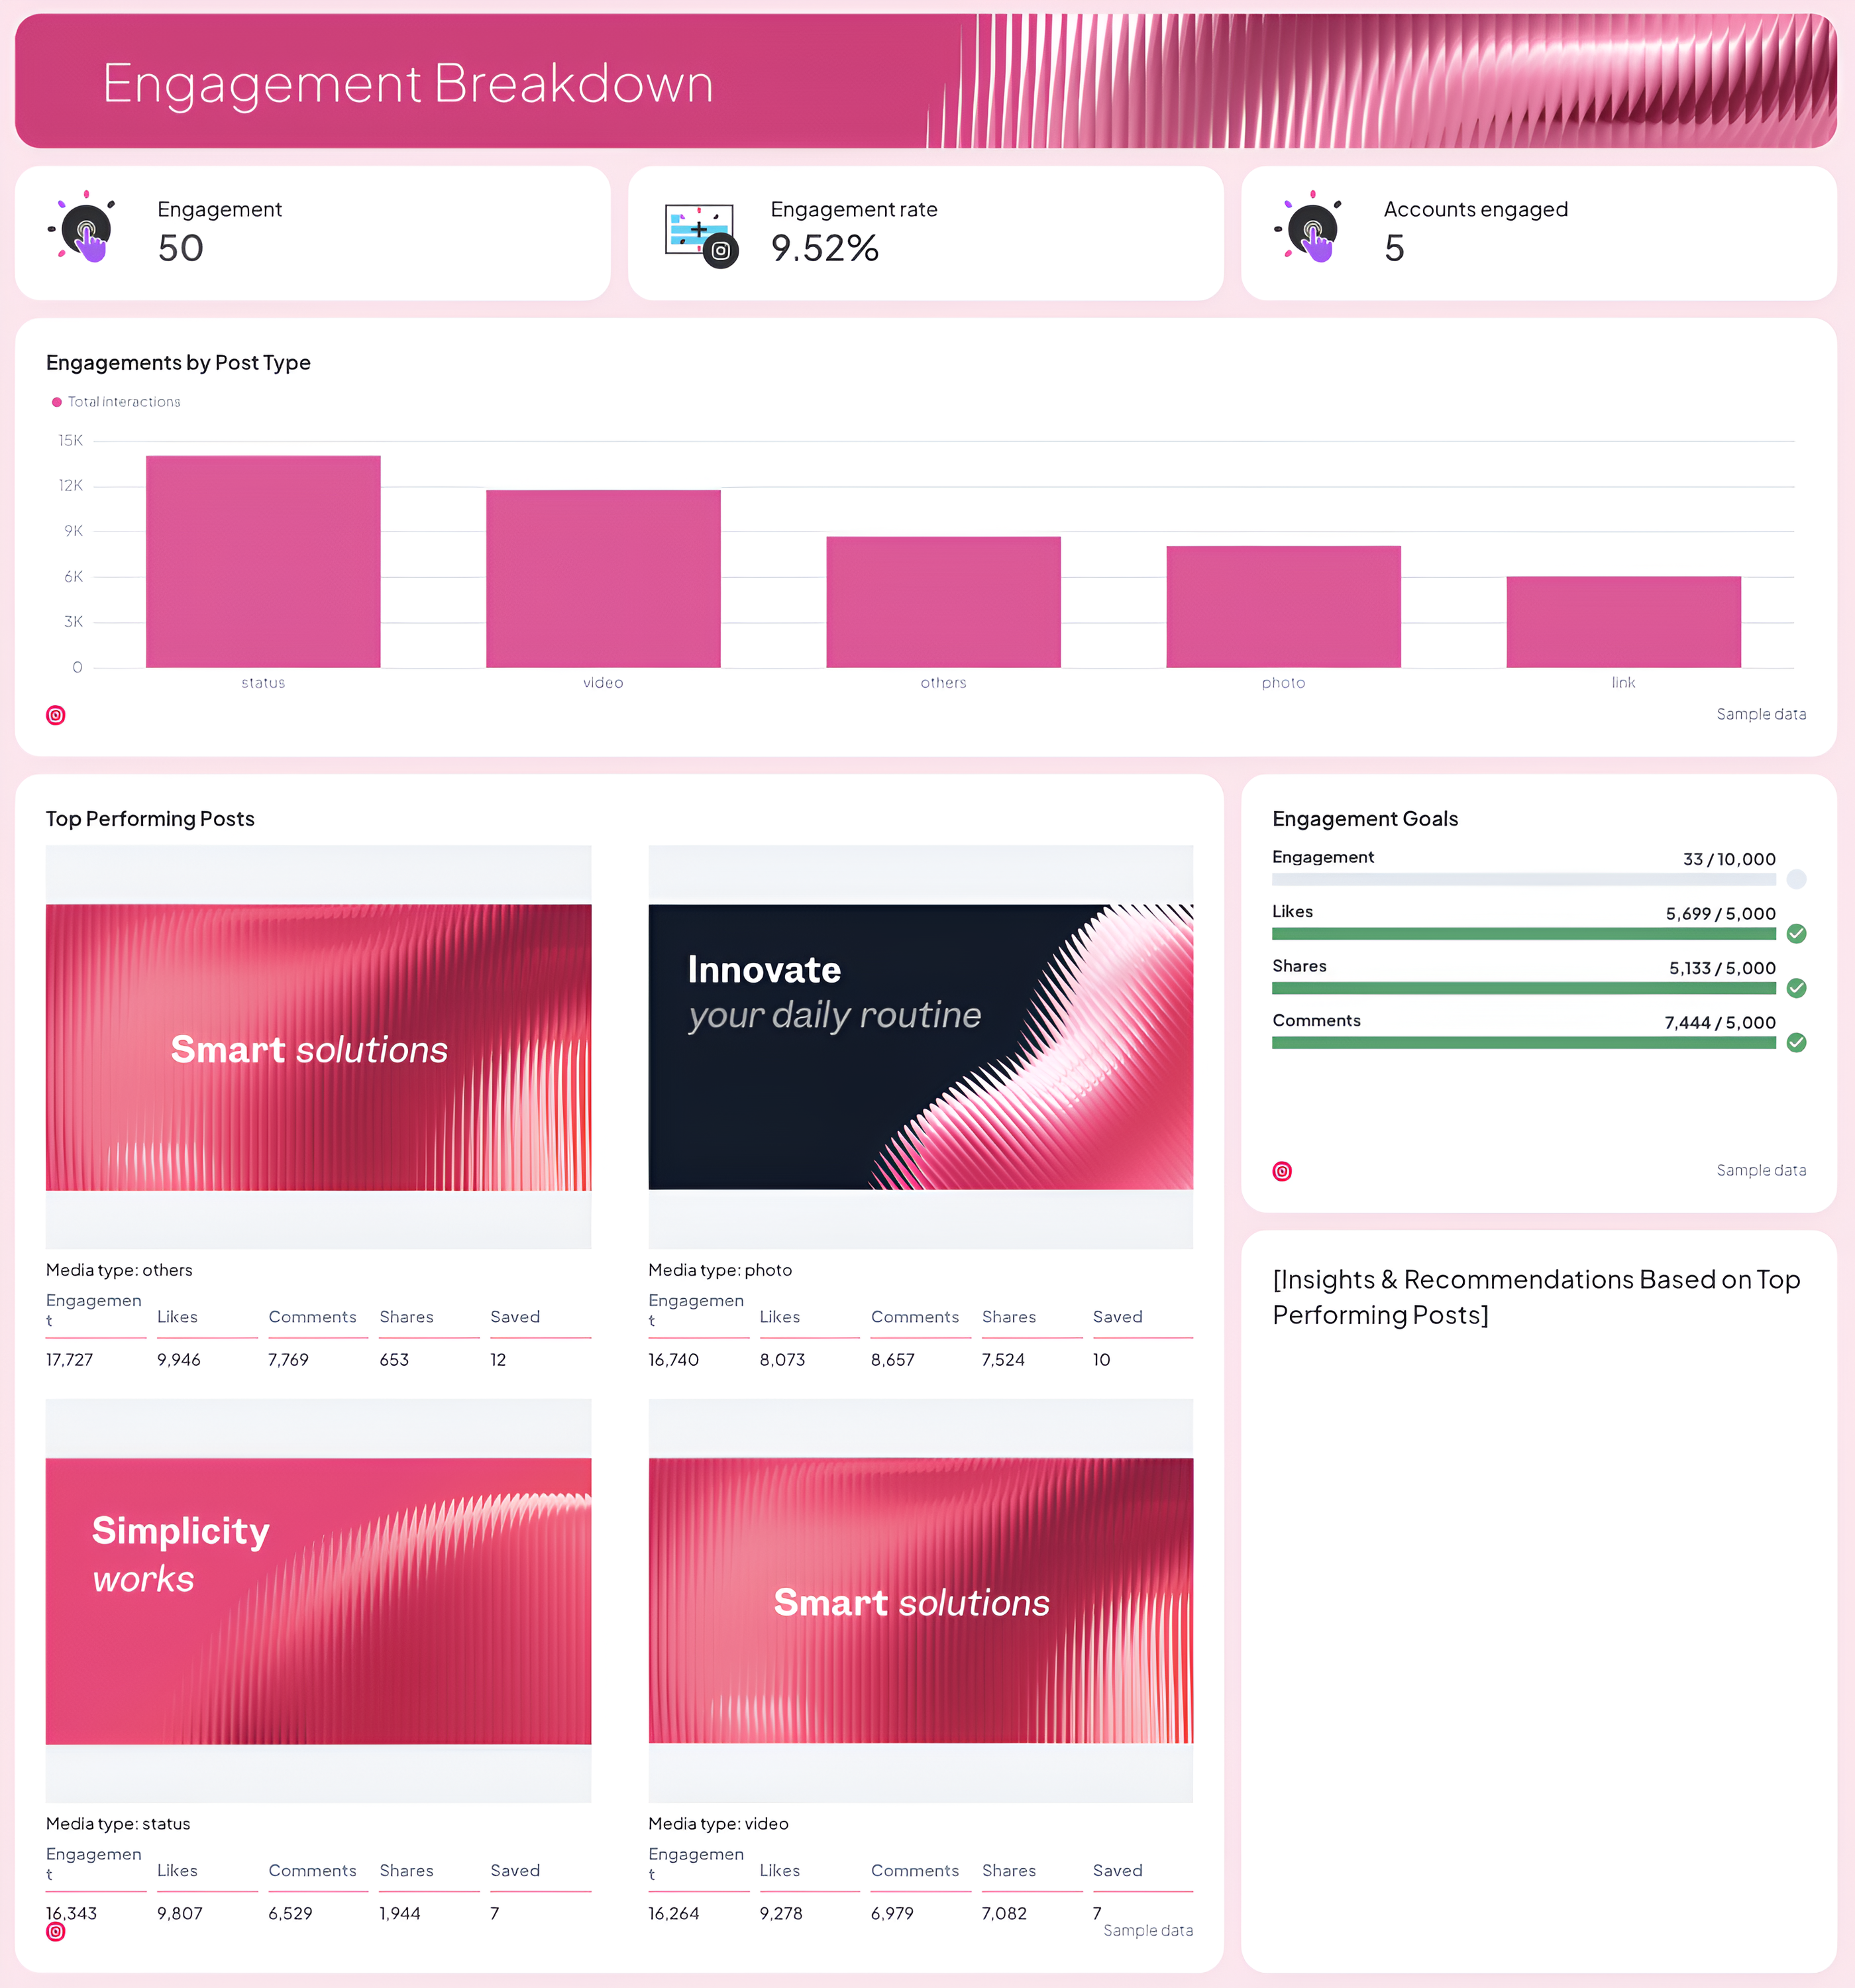
Show how well your content resonates with your audience.
Include:
- Total engagement, engagement rate, and accounts engaged
- Engagement by post type (photo, video, carousel, status)
- Engagement goals to track likes, shares, and comments
- Top-performing posts and stories, with text widgets to summarize key takeaways and recommendations
- Highlight which content types drive the most interactions so your team can optimize your future posts
Beyond the numbers, you also get a direct view of the creatives behind your top-performing posts and Stories.
Maryna Barysheva, CEO of LKI Consulting, explains why that visibility is so important:
Creative performance is often the biggest driver of results, but most reports focus heavily on campaign-level metrics instead of analyzing which messaging or creatives are actually working.
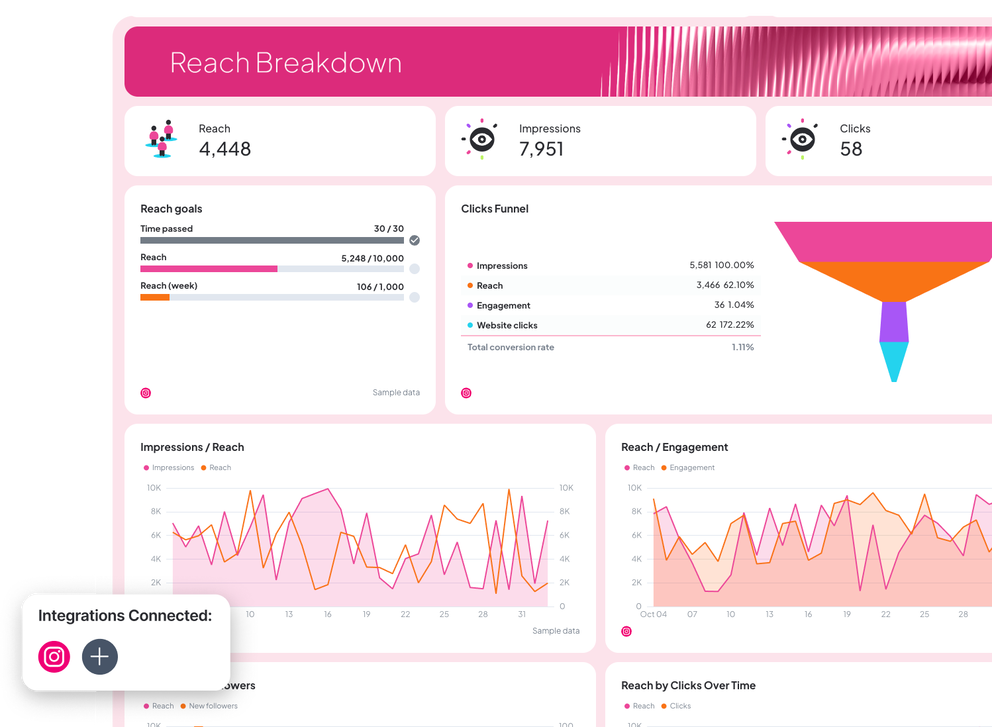
4. Reach Breakdown
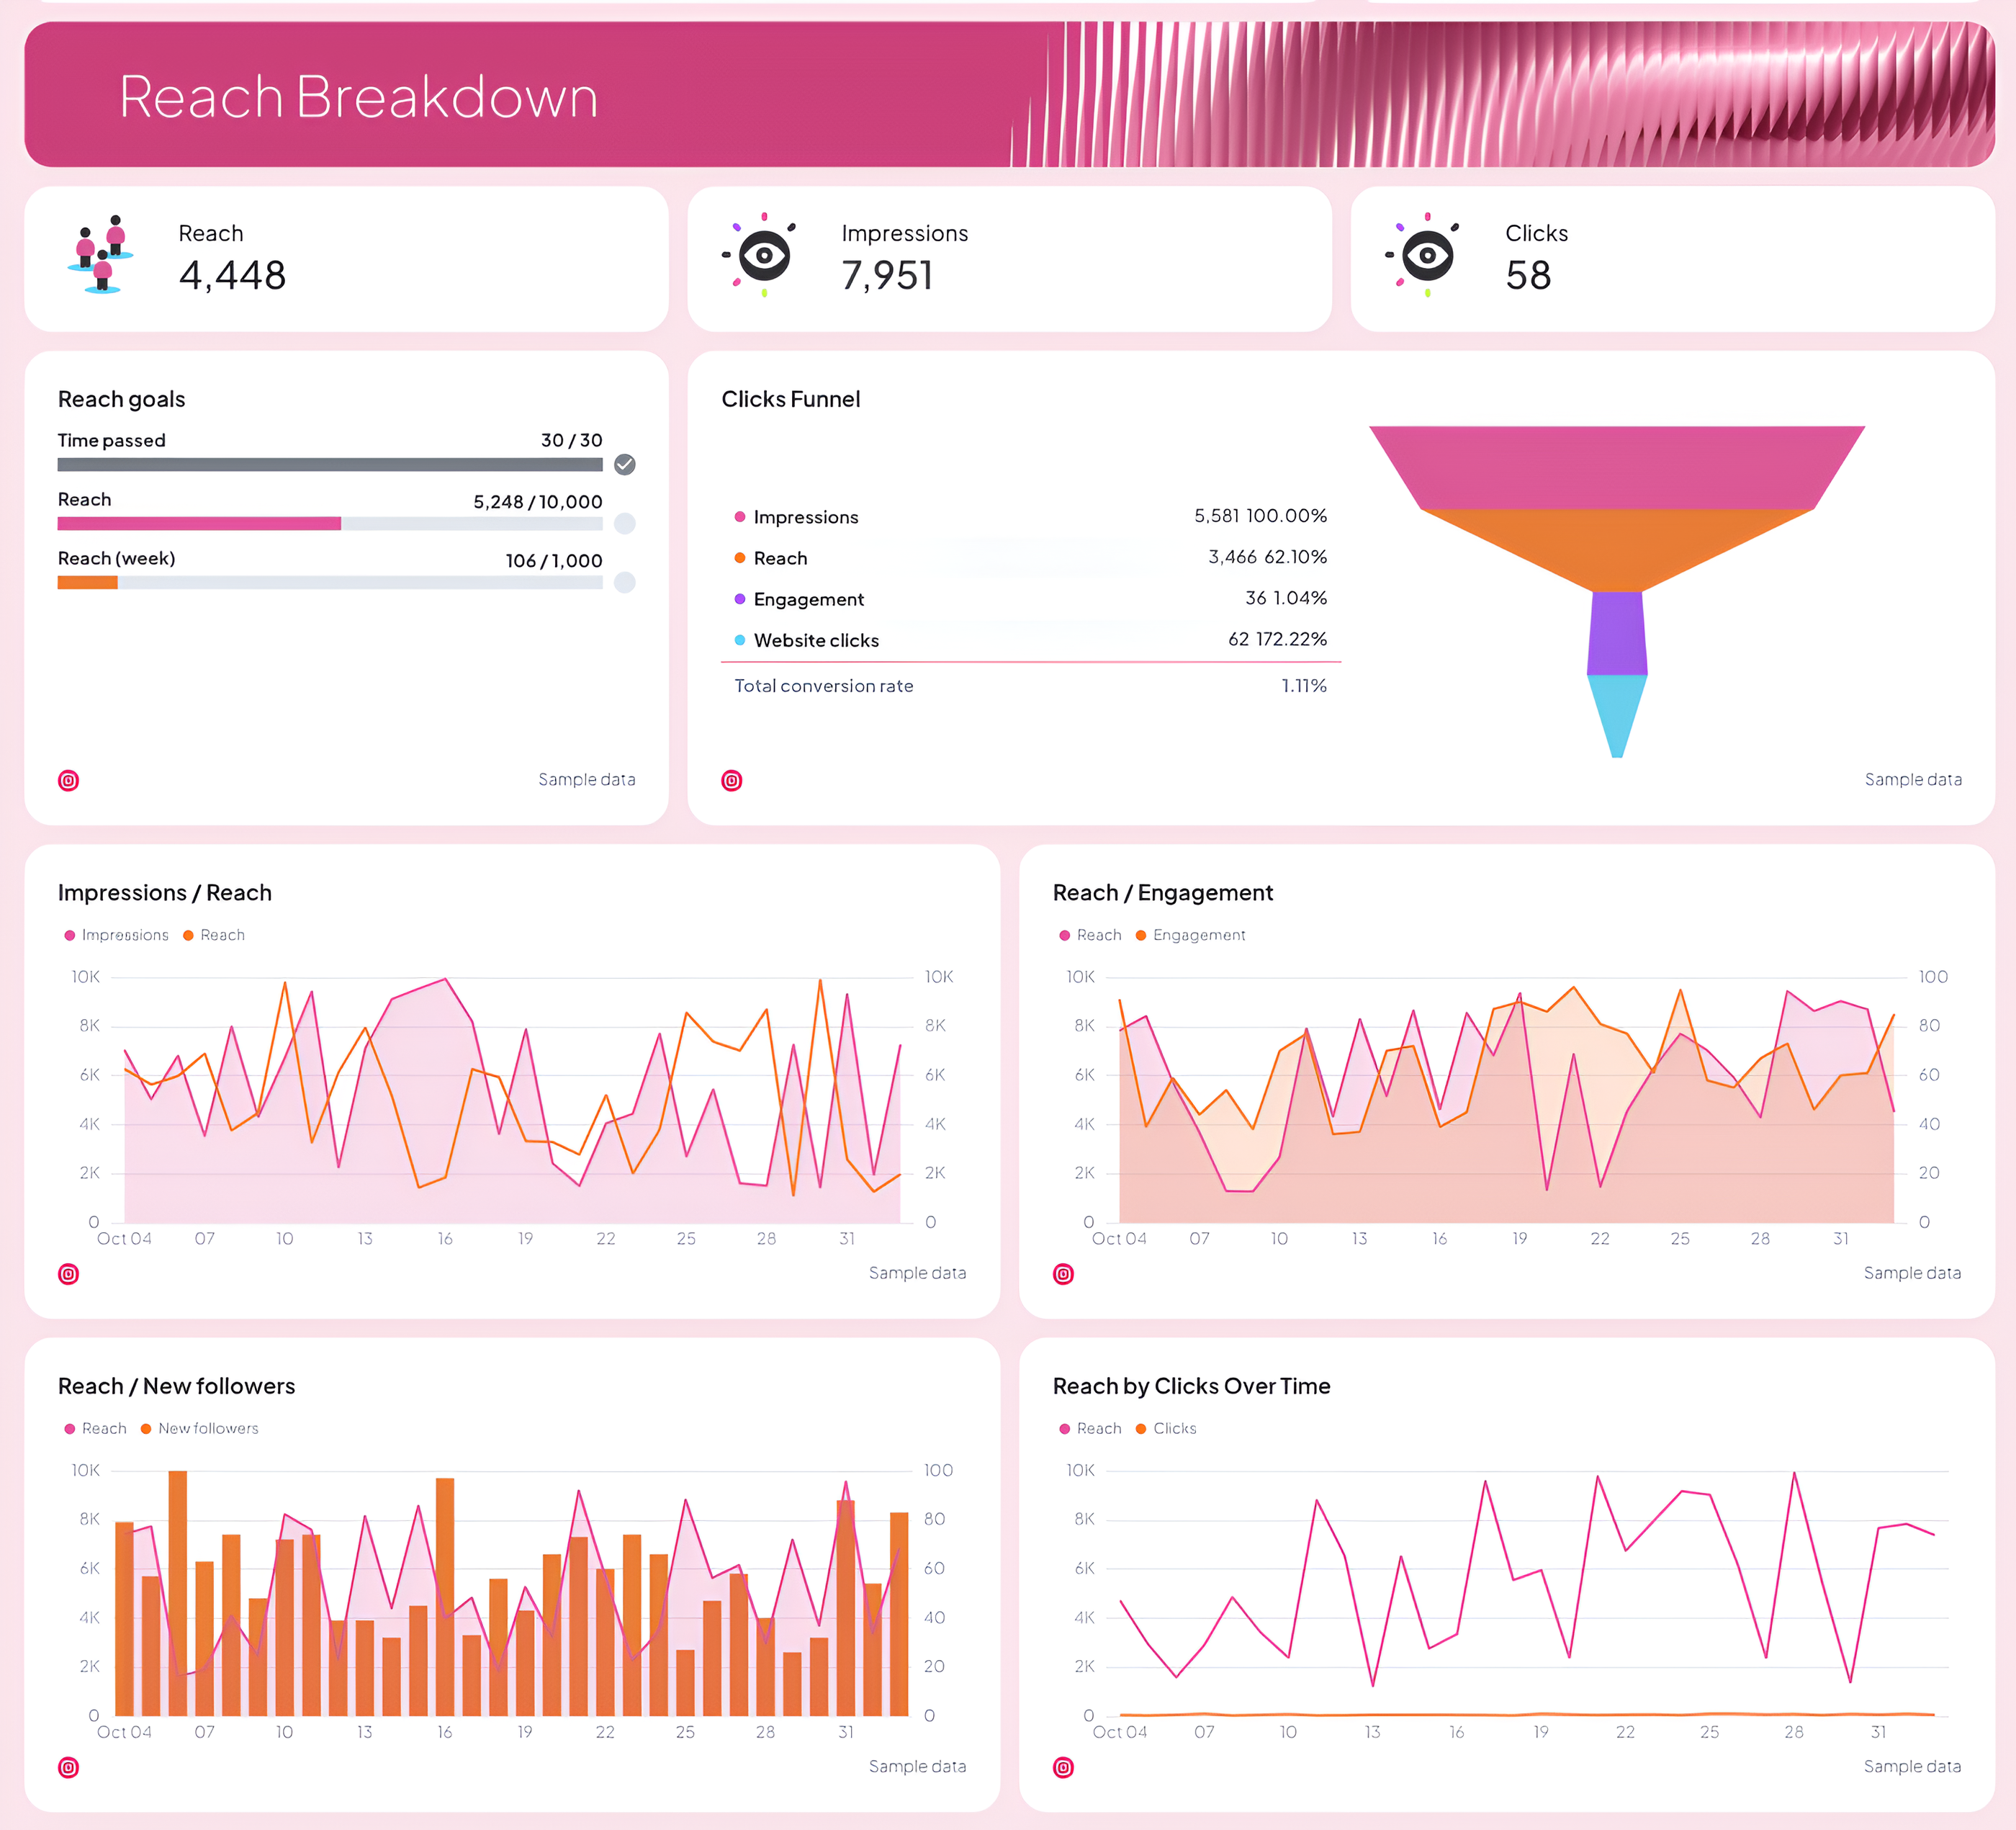
Measure how far your content travels and what drives traffic back to your site.
Include:
- Reach, impressions, and clicks
- Reach goals and clicks funnel to track conversion flow
- Visual charts for impressions vs. reach, reach vs. new followers, and reach by clicks
- A daily reach trend graph to see performance patterns across your posting schedule
These insights help you fine-tune your content strategy and maximize visibility.
5. Recommendations and Next Steps
As Janet Mesh, the CEO of Aimtal, says:
One of the biggest mistakes that marketers make when creating reports is just adding screenshots of performance charts without any context or analysis.
Wrap up your report with key takeaways, optimization tips, and next steps for the team.
Done right, this section transforms performance data into a clear action plan for the reporting period ahead.


