Best Instagram Dashboard Template for Marketers

Visualize all of your Instagram analytics data in one dashboard view.

Wow clients with a stunning Instagram dashboard template—built in seconds.

Let AI do the heavy lifting, so you can focus on what matters.

Hero Instagram Dashboard - Instagram dashboard with charts, metrics, and campaign data.
Trusted by 1,000+ marketing agencies and brands around the world
Lactogal - Logo with stylized leaf-like graphic to the left of the brand name.
Wise Pirates - A gray W-shaped design and a small gray circle on a black background.
Ticketmaster - The Ticketmaster logo.
Seo Sherpa - A logo displaying mountain graphic and text "seo sherpa"
Property Guru - Image completely black.
Awestruck Logo - The word "AWESTRUCK" in a bold, dark-colored sans-serif font on a black background.
Brand Logo 7
Rentable - The Rentable logo featuring a house inside of a square to the left of the company's name.
Brand Logo 9
Brand Logo 10
Brand Logo 11
Lekker Bikes - Logo featuring a stylized tulip and the word "Lekker" in outlined letters.

How Whatagraph saves you time on Instagram reporting & analytics

Connect your Instagram data in seconds

Connect all your Instagram ads and organic data into one place.


Our integrations are fully-managed, which means they’re extremely stable and always accurate.


No code needed—just plug in once and you’re good to go.

Connect Your Instagram Data - Dashboard with charts and account selection.

Organize your data without the guesswork

Build custom dimensions, data blends, and metrics in seconds with Whatagraph IQ. 


Just explain us how you want to organize your data, and we'll do it for you. 


No need to code or go through complex workflows.

Instagram Reporting Tool - Interface for grouping campaign names into categories.

Create a dashboard from just a prompt

Create fully-customized dashboards in seconds, simply from a prompt—or by using our Instagram dashboard template.


Complete them with widgets, layouts, and metrics. Ask AI to edit widgets or add new ones.


Ridiculously easy and no manual work needed.

Instagram Reporting Tool - Dialog for creating a report with prompts and data source.

Use AI to get performance summaries and insights

Get the right insights to make data-driven decisions—instantly.


Just ask AI in natural language and get back accurate insights and performance summaries based on your actual data.


With clear insights, everyone in your team understands how your Instagram campaigns are performing, without being a data scientist.

Instagram Reporting Tool AI chatbot - A summary of Instagram ad campaign performance, listed by month.

Easily brand your dashboards

Style your dashboards by uploading a screenshot with your brand book or from a prompt.


Whatagraph’s AI will apply branding to your dashboards in seconds.


No more complex copy-pasting across dashboards.

Instagram Reporting Tool - Analytics interface with branding theme customization options.

Hear from agencies and brands that love Whatagraph

I made a switch from GDS and Sheets for reporting to Whatagraph, and I am saving literal hours each week on performance report creation. Our small firm actually managed to onboard 2 new clients as a result of all the time we saved on managing data and reporting. The customer service is also really helpful and easy to reach.

Mindaugas S., Marketing ConsultantCapterra logo for Whatagraph review

Capterra verified review by

Mindaugas S., Marketing Consultant

Having active customer support to help fix any issues was a big contributor, but we also really liked the ability to save templates and connect sources to multiple charts/widgets at once without having to edit them individually. And having the grid layout is much easier to stay consistent with than the free form setup that Data Studio has.

Nico T., Media PlannerCapterra logo for Whatagraph review

Capterra verified review by

Nico T., Media Planner

The system has standard templates that are easy and fast to use. Also you can build your own report with lightning speed. It is very easy to use, has a lot of integration, and let get started very fast.

Rasmus Bernt K., External Senior Management ConsultantCapterra logo for Whatagraph review

Capterra verified review by

Rasmus Bernt K., External Senior Management Consultant

We love Whatagraph - we would definitely recommend and our account manager is great! I love how easy this tool is to use, everyone on the team finds it much more user-friendly than other dashboards. Integration was easy, we sent some example reports to the team who duplicated these for us. We literally had to log in and send it to our clients!

Stephanie S., Digital DirectorCapterra logo for Whatagraph review

Capterra verified review by

Stephanie S., Digital Director

We are showing our clients the work that we're doing for them and this is incredibly important for our clients ROI. They want to see results and having a tool like Whatagraph that can show data from virtually every source we use is hugely important.

John S., SEO StrategistCapterra logo for Whatagraph review

Capterra verified review by

John S., SEO Strategist

The tool is easy to use; you do not need to have development resources. Even my junior project managers are capable of making campaign reports in minutes. There are a lot of pre-made templates you can use as well as many pre-made widgets.

Erman E., Marketing SpecialistCapterra logo for Whatagraph review

Capterra verified review by

Erman E., Marketing Specialist

Really easy to connect data sources within the tool. The library of report templates has been helpful. The customer support team has been responsive to all of our needs. Our team enjoys the simplicity of setting up the reports and how the data is presented.

Brent N., Director of OperationsCapterra logo for Whatagraph review

Capterra verified review by

Brent N., Director of Operations

Easy to create really beautiful graphs and reports which can help other team members to understand the most important takeaways. I especially like the automated report function, so I don't have to check on the same thing repeatedly.

Orsolya S., Online Marketing ManagerCapterra logo for Whatagraph review

Capterra verified review by

Orsolya S., Online Marketing Manager

What is the Whatagraph Instagram dashboard?

If you're an agency owner, you probably spend a lot of time collecting data and manually creating dashboards.

Whatagraph's Instagram dashboards help automate this process by collecting Instagram ads and organic data, organizing it, and displaying it through charts, tables, and other visuals.

How do I create an Instagram dashboard?

The best way to create an actual Instagram dashboard is by using a dedicated Instagram reporting tool.

On Whatagraph, you can create Instagram analytics reports and dashboards in four steps:

Step 1: Connect your sources

The first step is connecting your Instagram account as a source to Whatagraph.

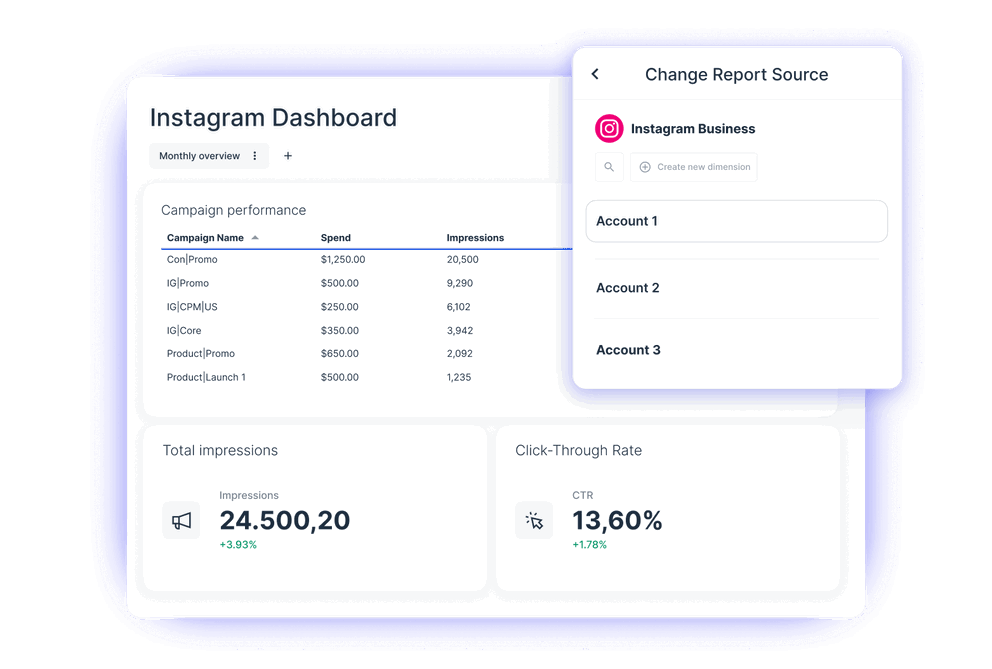
To do this, head to your Whatagraph workspace, select Instagram as a source, and authenticate with your login.

In addition to Instagram, we support 55+ other platforms, including Facebook Ads, LinkedIn Ads, TikTok, Google Ads, Shopify, SEO platforms like Ahrefs, and more.

You can even pull in data from Google Analytics, Google Sheets, or use API connections.

Step 2: Organize your Instagram data

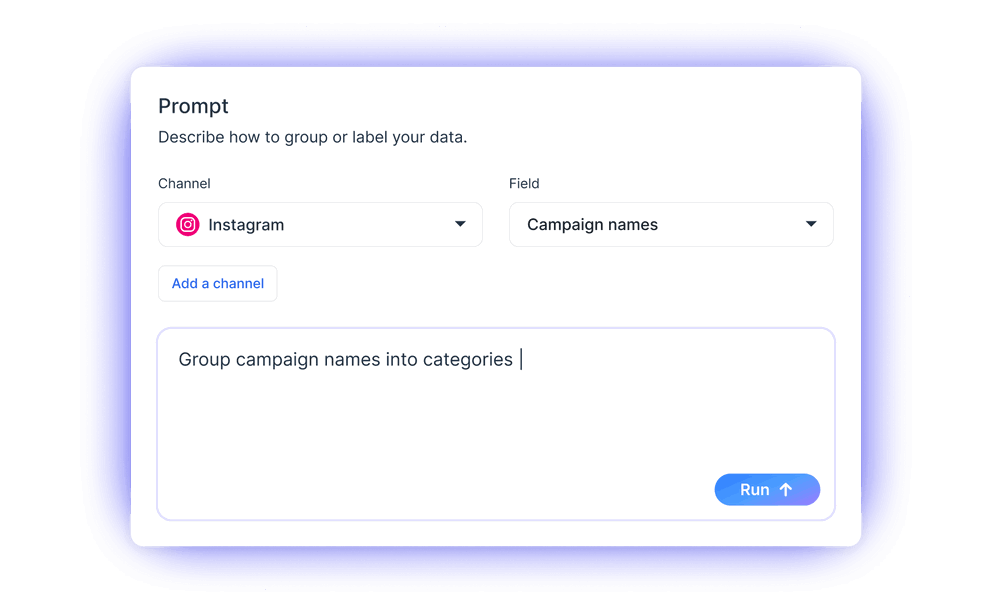
Once your Instagram account is connected, it’s time to organize your data so it’s easy for clients and team members to understand it.

By organizing your data, we mean:

  • Creating custom dimensions
  • Creating custom metrics
  • Blending different data sources together to create new ones

Fortunately, the new Whatagraph IQ makes organizing data extremely easy. You just tell us how you want your data sorted—like campaign names grouped by category or product reviews by language—and we'll do it for you.

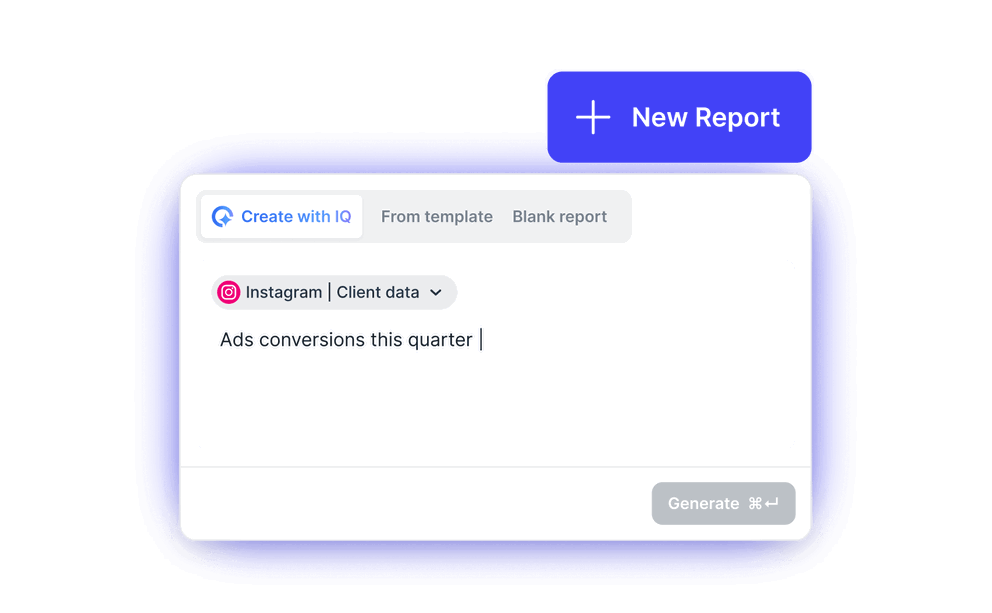
Step 3: Create automated Instagram dashboards

Whatagraph has two ways for creating Instagram analytics dashboards:

1. Use our ready-to-use Instagram analytics dashboard template (or the 50+ other available templates)

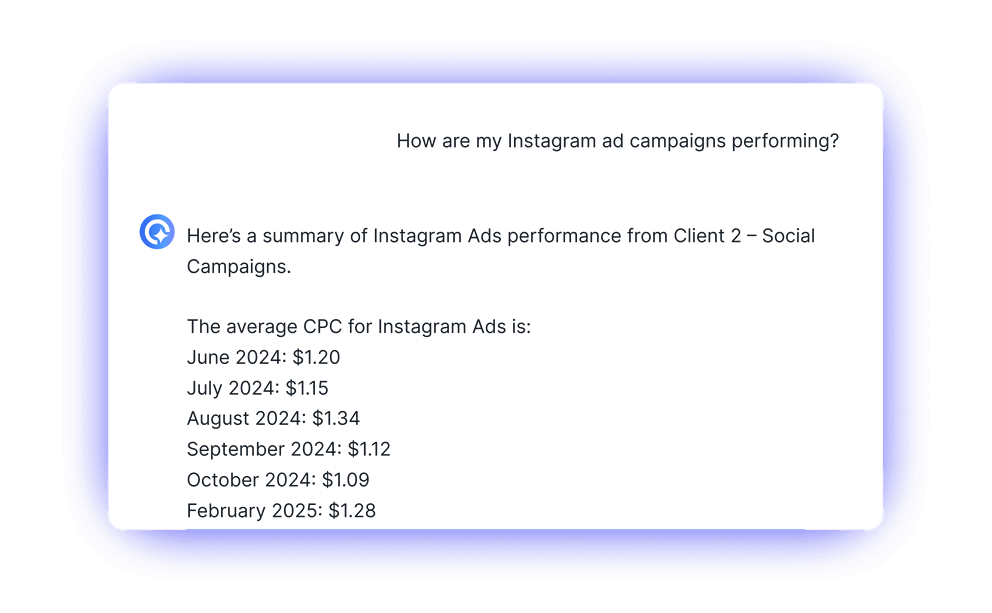
2. Use Whatagraph IQ to create an Instagram dashboard from a prompt

More and more people are choosing to use Whatagraph IQ to create Instagram dashboards, as it removes the need for using report templates altogether.

Whatagraph IQ also expands to other areas of dashboard creation:

  • AI handles data integration and formatting, so you don’t need to
  • Insights and summaries are generated instantly to highlight key takeaways
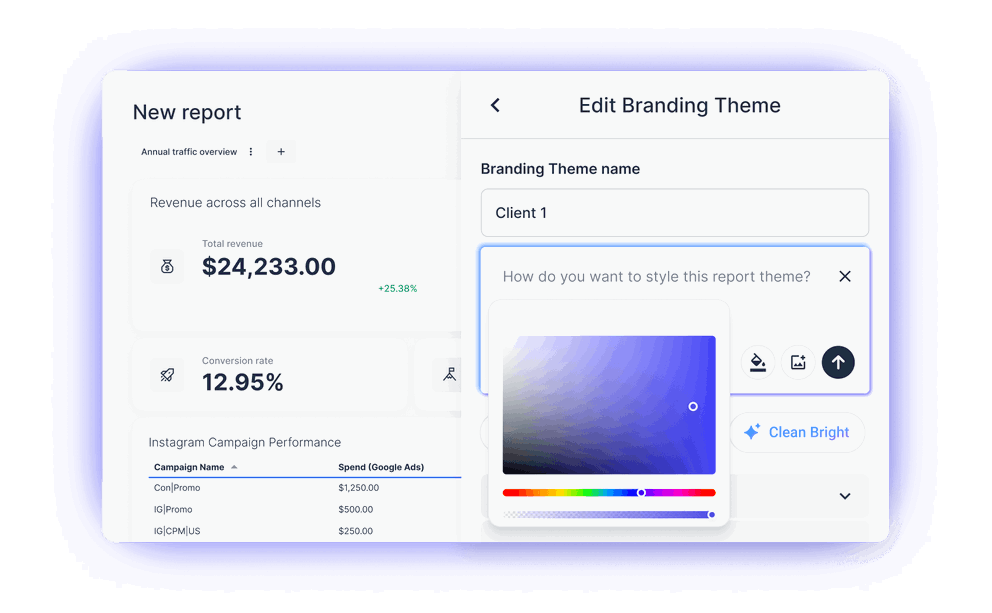
  • Styling can be done by uploading a screenshot of your brandbook or by a prompt
  • Custom dimensions, data blends, and other edits can all be done with natural language

With Whatagraph IQ helping create dashboards, you don’t need to:

✅ Manually drag-and-drop widgets and dashboard templates — just explain the type of widget or dashboard you need

✅ Dig through dozens of reports to understand your Instagram data — our AI will give you actionable insights instantly

✅ Work with code or create data blends and custom dimensions manually

This is not the future of reporting; it’s already a reality with Whatagraph.

Step 4: Share the reports

As a final step, it’s time to share your Instagram dashboards with clients and colleagues.

There are three ways to do this:

  • Share a live link to your marketing dashboard
  • Export the dashboard as an Excel or PDF file
  • Schedule your dashboards to be sent via email, for example, monthly, weekly, or daily

What metrics can be tracked using an Instagram Dashboard?

Having an Instagram insights dashboard isn’t enough on its own. You need to display the right metrics, so clients understand how their campaigns are performing.

Include these key performance metrics in your Instagram reporting dashboard:

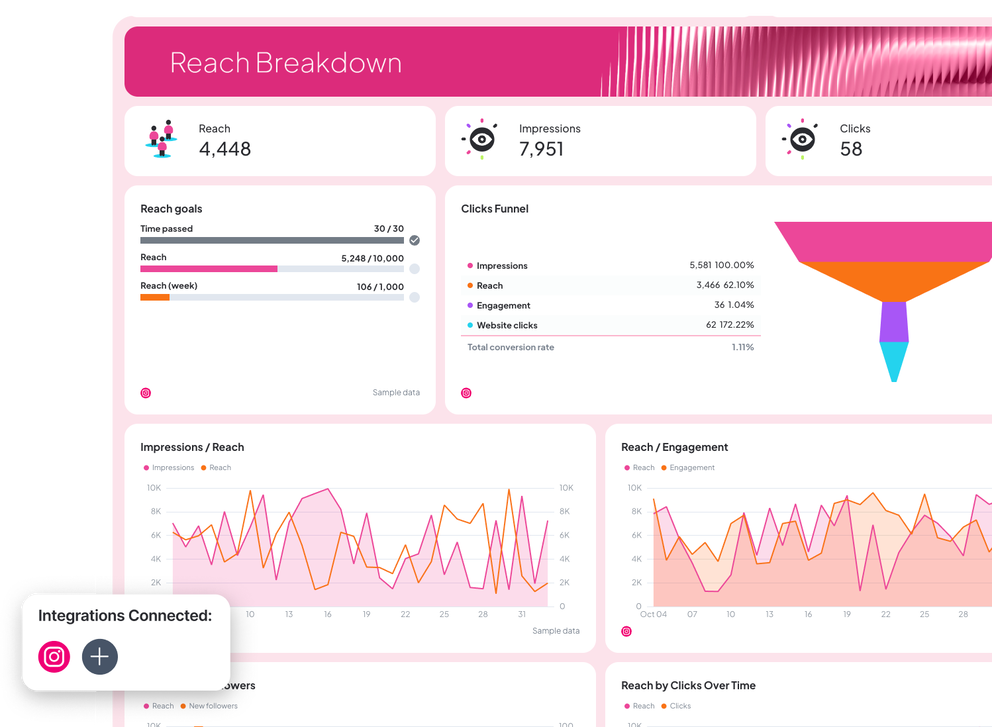
Reach: The number of unique visitors who saw your Instagram content; a key metric for measuring campaign visibility.

Followers: Tracks the total audience size and growth, and helps to monitor growth over time.

Impressions: Counts how many times your content was displayed—a good metric for understanding overall exposure.

Comments: Tracking the number of comments gives you an idea of how well your audience interacts with your content.

Likes: The total number of likes per post is a helpful metric for spotting which Instagram posts resonate with your audience.

Followers by age/gender: Breaks down the number of new followers by age and gender—helpful for understanding your audience demographic.

Impressions & reach by day: Shows how much impressions and reach vary each day—helpful for understanding the best days to post.

Post performance: Highlights the best-performing posts by impressions and likes, which is useful to know when optimizing your Instagram marketing and content strategy.

Frequently Asked Questions

All your questions answered. And if you can’t find it here, chat to our friendly team.

How do I monitor my Instagram ads?

The easiest way to monitor your Instagram ad campaigns is to use a dedicated reporting software, like Whatagraph.


These tools make it easy to create Instagram ads dashboards by collecting, managing, and visualizing data. The data can also be combined with organic data and data from other social media platforms.

Where can I find free Instagram dashboard templates?

A few Instagram reporting tools, including Whatagraph, offer free Instagram dashboard templates you can take inspiration from.


You can see the type of metrics you should include, how to structure them, and how to present your insights so clients can understand them easily.

How do you make a dashboard on Instagram?

To make a dashboard on Instagram, first you need to have a professional (creator or business) account. To access the professional dashboard, go to your Instagram profile and click View professional dashboard on the top. Here, you can find sections to:


- Track your performance: View key insights on the people you've reached in the last 30 days.


- Grow your business: Learn where to access and discover new creator and business tools, such as subscriptions, branded content, badges, ads, quick replies, orders and more.


- Stay informed: Find tips, tricks, guidance and inspiration from the @creators and @instagramforbusiness teams. Track your performance: View key Insights on the people you've reached in the last 30 days.


This way of analyzing Instagram data is good for freelancers and startups with a handful of campaigns. However, if you want to organize your data, include campaign results from other social media platforms, or scale up to monitoring hundreds of accounts in a month, you need to create a custom Instagram analytics dashboard in Whatagraph that allows you visualize multi-channel data while saving you time and automating most of the process.

Does Instagram have a dashboard?

Yes, there’s an Instagram analytics dashboard available for tracking account performance. It displays key features, like account reach, impressions, follower growth, and engagement metrics. 


For agencies and marketing teams that need more advanced data and cross-channel insights, Instagram’s built-in analytics simply aren’t enough.


How do you get to your dashboard on Instagram?

To access your Instagram business dashboard, you have to have a business or creator account on Instagram. After this, you simply need to follow these two steps:


1. Go to your Instagram profile


2. Click on “View professional dashboard” at the top


From this business account page, you can track your Instagram performance, find tips and tricks, and view key insights.