Marketing Analytics Report Template

Report the performance of your social media, PPC, SEO, email marketing, and many other channels in one place with our Marketing Analytics Report Template. Create your first report and aggregate cross-channel metrics and KPIs. Leverage marketing data to make the best business decisions. Connect any source and organize key metrics without any code. Share stunning visual reports as scheduled emails or live links for on-demand access.

Marketing Analytics Report Template - Ready to Use
You are in good company with 1,000+ marketing agencies and in-house teams worldwide
mc cann logo
Whatagraph image
Whatagraph image
Whatagraph image
Ogilvy logo
House dentsu logo
havas logo
n365 logo

Optimize your marketing campaigns with our marketing analytics template

Connect all your sources to one marketing analytics report

Connect any needed data sources and get each channel's metrics in one place. Social media, email campaigns, eCommerce, PPC, and SEO are just some of the many marketing channels you can report on with Whatagraph. More than 45 different integrations allow you to prepare custom reports for your clients’ marketing campaigns. Each marketing data source you connect comes with a choice of graphs, tables, and other widgets pre-loaded with relevant metrics that you can adjust to your needs.

SVG image
Connect all your sources to one marketing analytics report

Visualize your data and create reports in minutes

Turn marketing data into appealing digital marketing analytics reports fast, without any training or tech background. Connect your data to this template and charts and tables will automatically populate with the source data. Add more rows or pages and insert a custom cover image. Enable tabs for different report sections. The widgets stick conveniently to the grid, giving you a neat and organized report you can later easily rearrange and adapt based on client feedback.

SVG image
Visualize your data and create reports in minutes

Gain fast cross-channel insights in one place

Our marketing analytics report template is all you need to monitor your marketing channels. Compare the results from multiple paid ads or social media platforms or blend related metrics from multiple sources for a total count of different channels. Our marketing analytics report will highlight your organic search rankings, content marketing effectiveness, web analytics, and other critical KPIs. Immediately learn where your marketing performance is spot on and where to improve. Use the cross-channel findings to see whether or not your efforts generate a return on investment. 

SVG image
Gain fast cross-channel insights in one place

Build any marketing analytics report in three steps

Connect data sources icon

Connect sources

Automatically pull data from 45+ native integrations. Log in to connect a source and get live data into your report with swift automated updates.

Create marketing reports icon

Select a template

Pick a template from our gallery with all essential visual types and widgets already inside, or use our drag-and-drop builder.

Automate data reports sharing icon

Automate sharing

Choose the recipients, frequency, and delivery time, and automate emails with attached PDF reports.

Save anything you create as a template

Our marketing analytics report template is not set in stone. It’s fully customizable to adapt and evolve to your needs. Save any calculation, filter, widget, or whole report as a team template and use it again. Build custom widgets and easily adjust the scale by selecting minimum and maximum values. Add custom titles and descriptions for more context. Apply custom color schemes, headings, and messaging. Link up to hundreds of reports to one master template and edit them in bulk.

SVG image
Save anything you create as a template

Fully automate your marketing analytics reports

Sending reports to clients or stakeholders takes time that you could otherwise use more productively. Once you are happy with your report, you can automate the whole process, from collecting fresh data to delivery. Pick the recipients, sending frequency, time of day, and never worry about the send-out. If needed, add a review step before sending to inspect the report and make final edits and comments.

SVG image
Fully automate your marketing analytics reports

All reporting features your agency needs

50+ sources to report

Create a true cross-channel digital marketing report in Whatagraph. Over 50 integrations for your cross-channel marketing campaigns.

Cross-channel reports

Combining cross-channel data is intuitive and takes a few clicks. Create a single client report for all channels instead of one report for each.

Full report automation

Schedule your reports at desired intervals or share a live link to a report so your clients can check for updates at any moment.

White-label reports

Customize colors and logos in each report to align it with your agency’s or clients’ branding and style.

What is a marketing analytics report template?

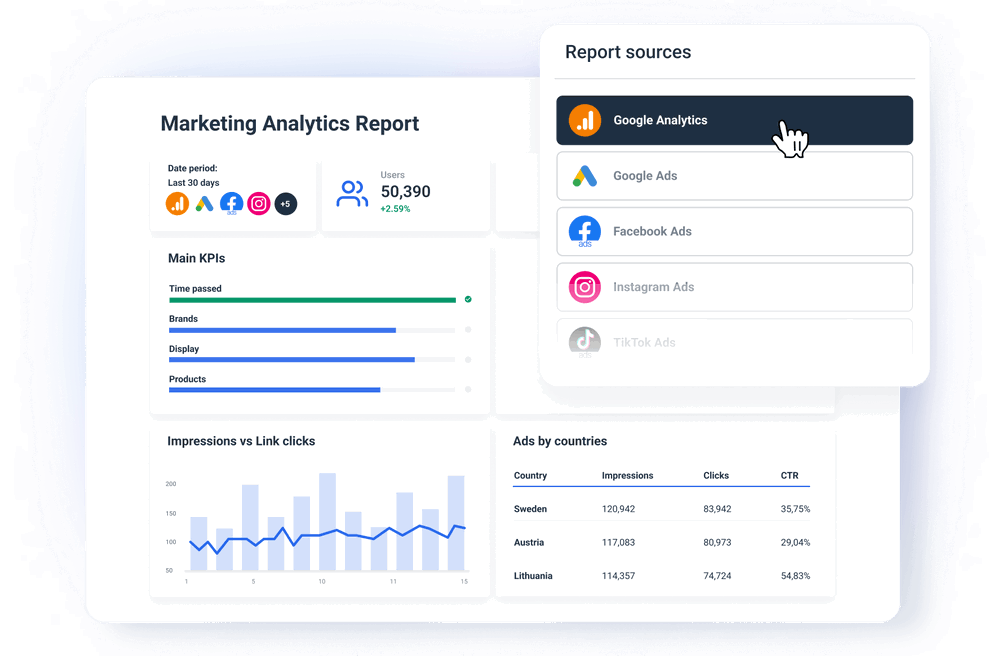
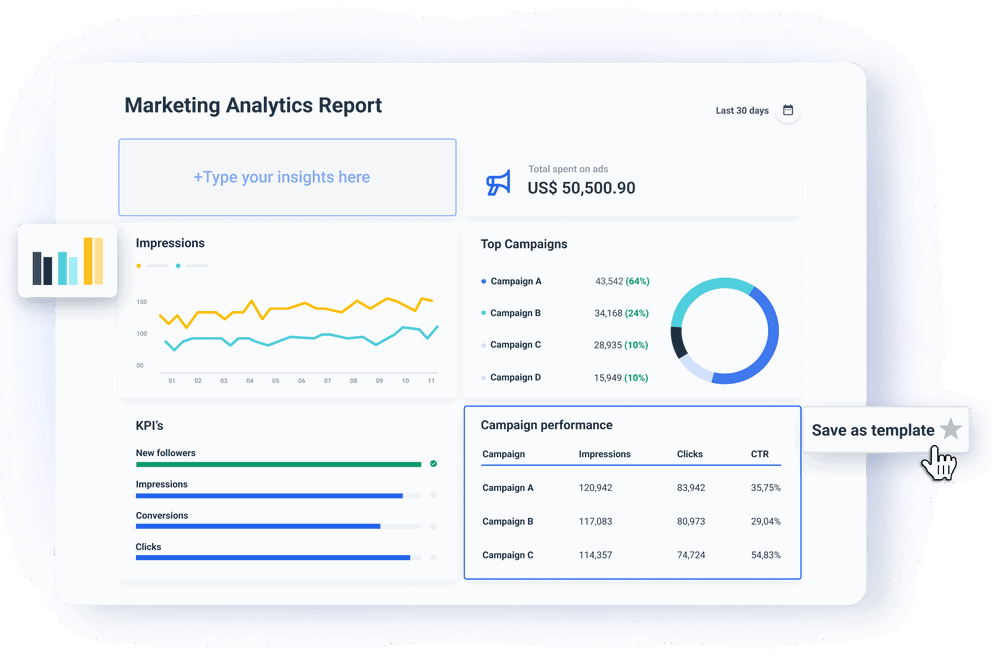
A marketing analytics report template is a digital document that allows marketing agencies to quickly and accurately connect data from their clients’ multiple marketing platform accounts, visualize and organize the critical KPIs and metrics, and enable easy sharing. In the case of the Whatagraph template, you can enrich the report with data from any 45+ integrated sources and save any customization as a new user template. 

Why should you use a marketing analytics report template?

As a marketing agency, you need a quick and easy way to gather and present marketing data to your clients. You need a solution that connects data rapidly and presents it in an engaging, easy-to-digest format. This marketing analytics template helps you achieve that. Let’s talk about a few reasons why you should use this template:

Save time and increase efficiency: A marketing analytics template streamlines the report creation process, freeing more time for new client acquisition and campaign optimization. Instead of starting from scratch for each report, you can simply connect the relevant data sources and customize the template as needed.

Standardized reports every time: Using a template to create reports ensures consistency and standardized UX across all marketing analytics reports within your agency. This helps maintain a unified brand image and ensures that all clients or stakeholders receive reports in a familiar format. What is more, whenever you need to change your company or client details, you can easily do it for all reports at once.

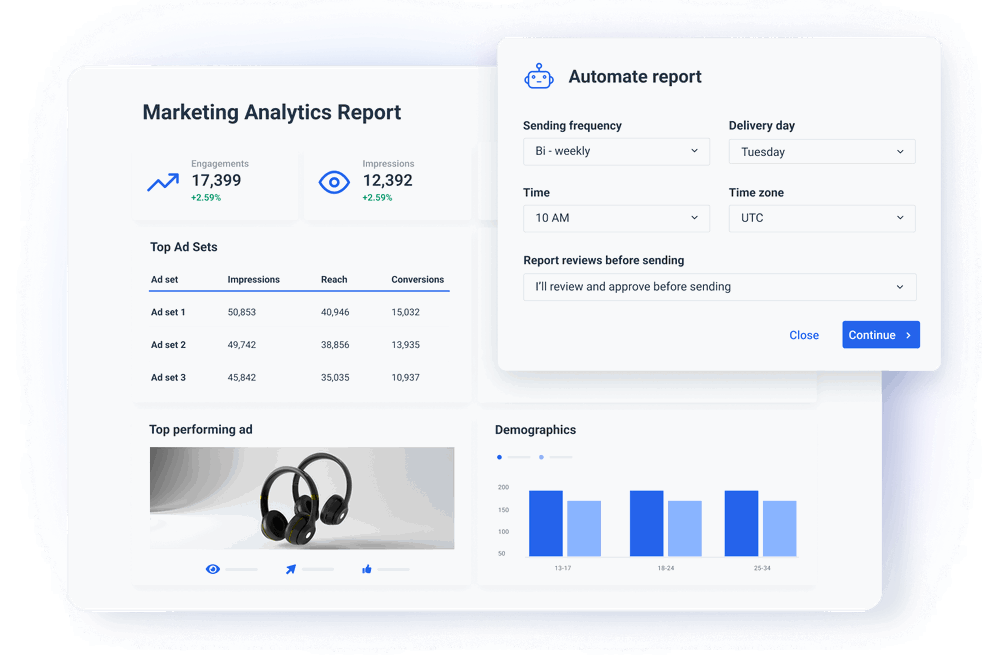
Accurate insights: Whatagraph’s marketing analytics report templates reduce the risk of errors and inconsistencies by providing a structured and automated system for gathering and organizing data and presenting insights. This minimizes the chance of mistakes and ensures that reports are reliable every time, especially when compared to working with multiple Excel sheets, visualizing in third-party tools, or PowerPoint slides.

Scalability: Large marketing agencies handle large volumes of client accounts and campaigns, so scalability is essential. A marketing analytics template allows you to quickly generate reports for multiple clients and campaigns and ultimately helps you scale your operations without compromising quality.

Easy customization: Whatagraph templates provide a standardized format based on best practices and industry standards, but they are also flexible enough to be customized to meet clients' specific needs and preferences. Marketing teams can tailor the template to include different marketing KPIs, metrics, and visualizations relevant to each client’s goals and objectives.

Smooth client communication: Marketing analytics reports act as a key communication tool between agencies and their clients. Using templates ensures that reports are presented in a professional and organized manner, making it easier for clients to understand the insights and recommendations provided by the agency.

What can Whatagraph’s marketing analytics template tell you?
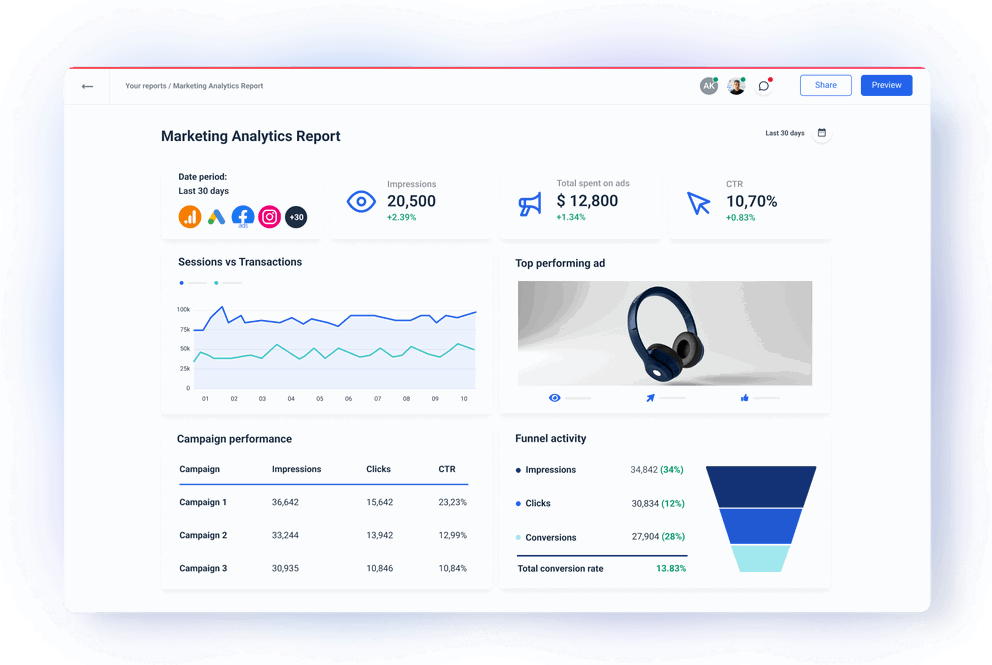
Executive summary

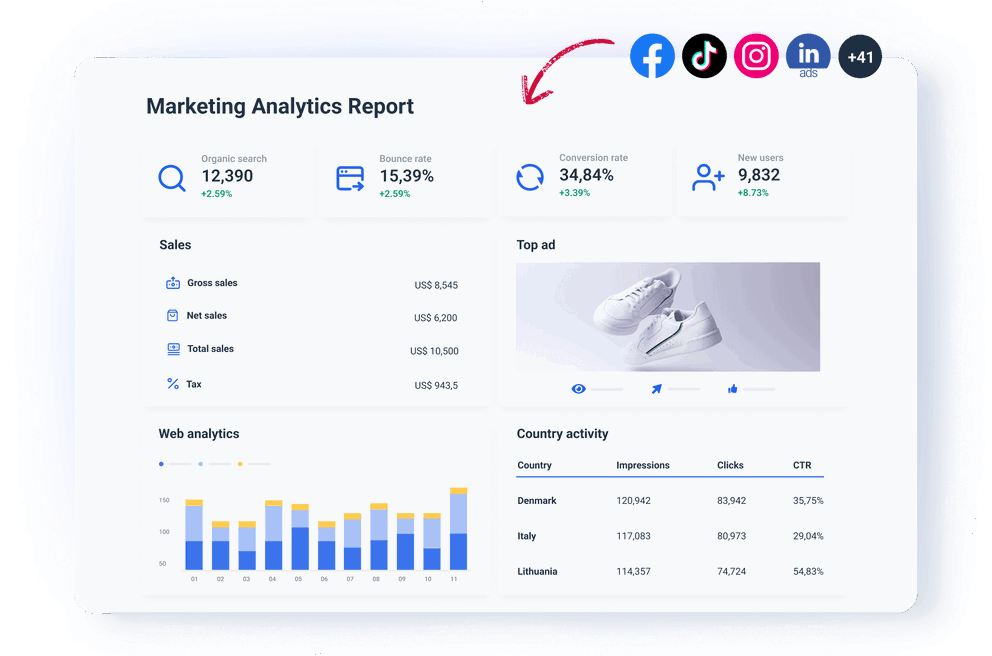
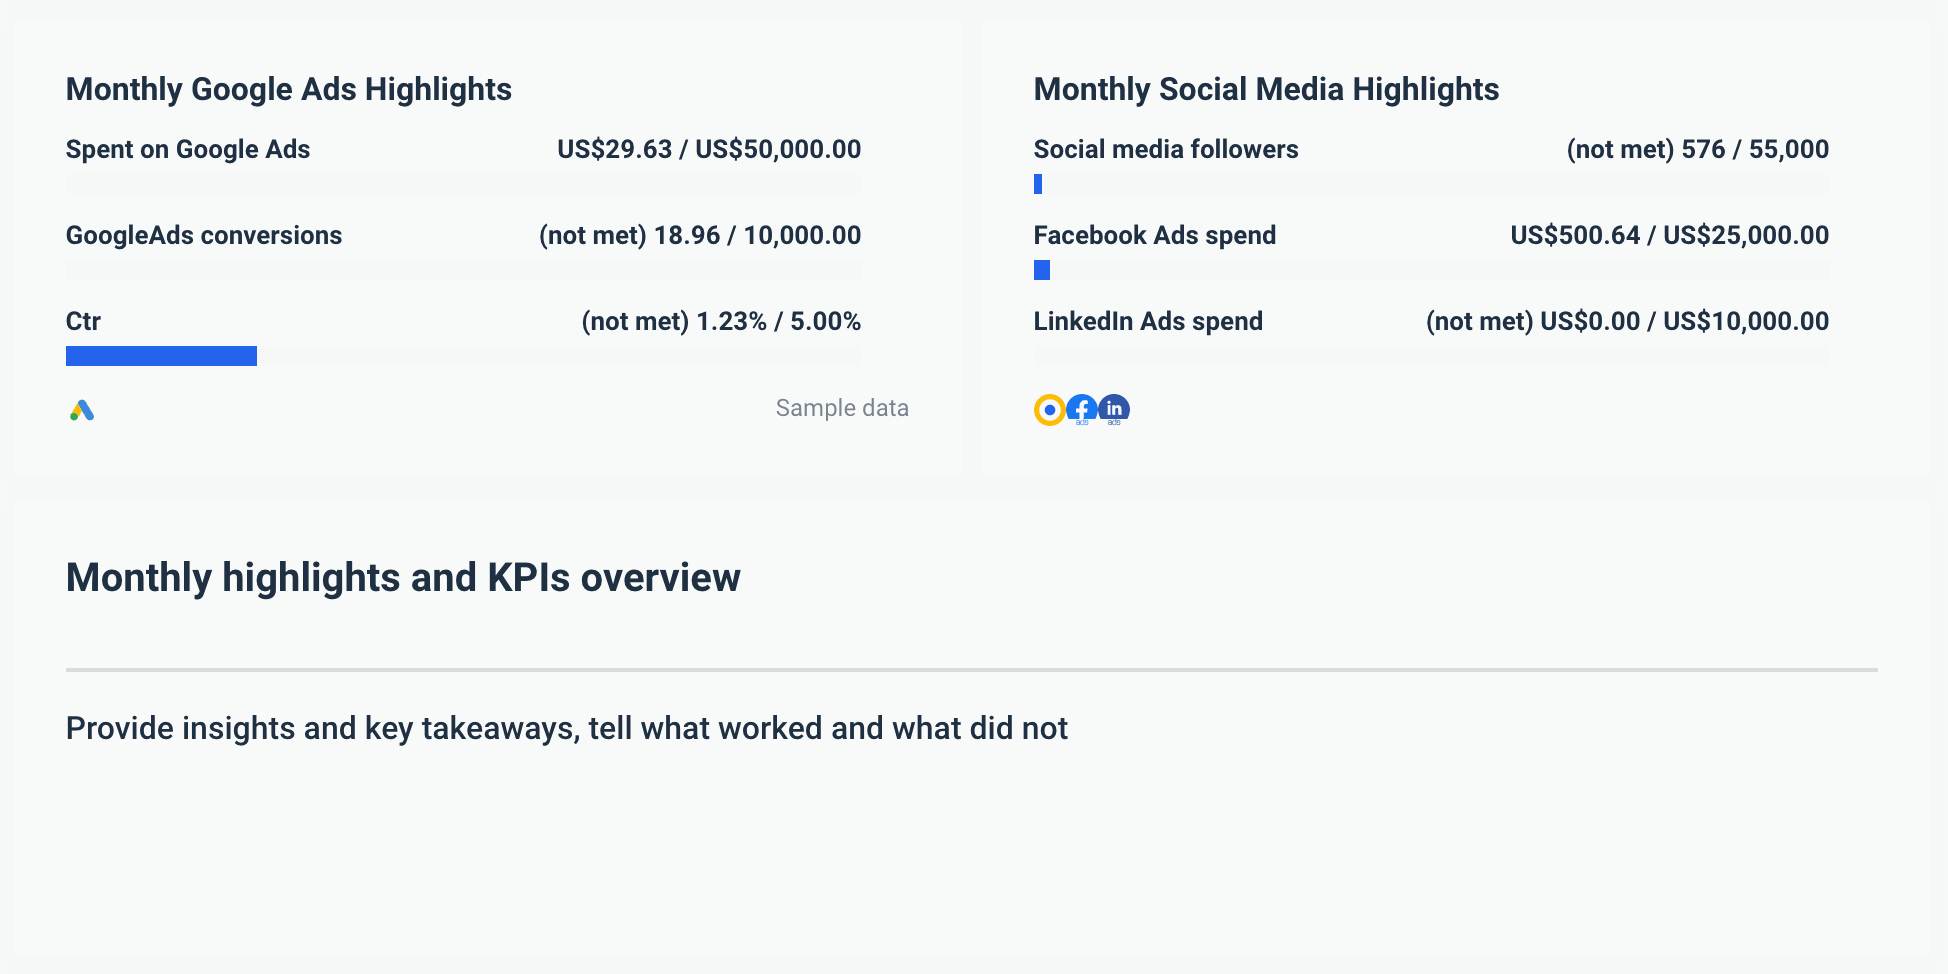
This is the high-level section where you give your clients the big picture of what happened this month with their marketing campaigns. It includes a brief overview of the monthly KPI goal completions and the most important metrics, such as the number of followers on social media, the amount spent on paid ads, and the number of conversions. Thanks to our text widget, you can quickly offer insights, comments, and recommendations for marketing activities in the coming months. This is a good place to upsell new services, such as running a cross-channel ads campaign to boost the client's overall social presence and reach. 
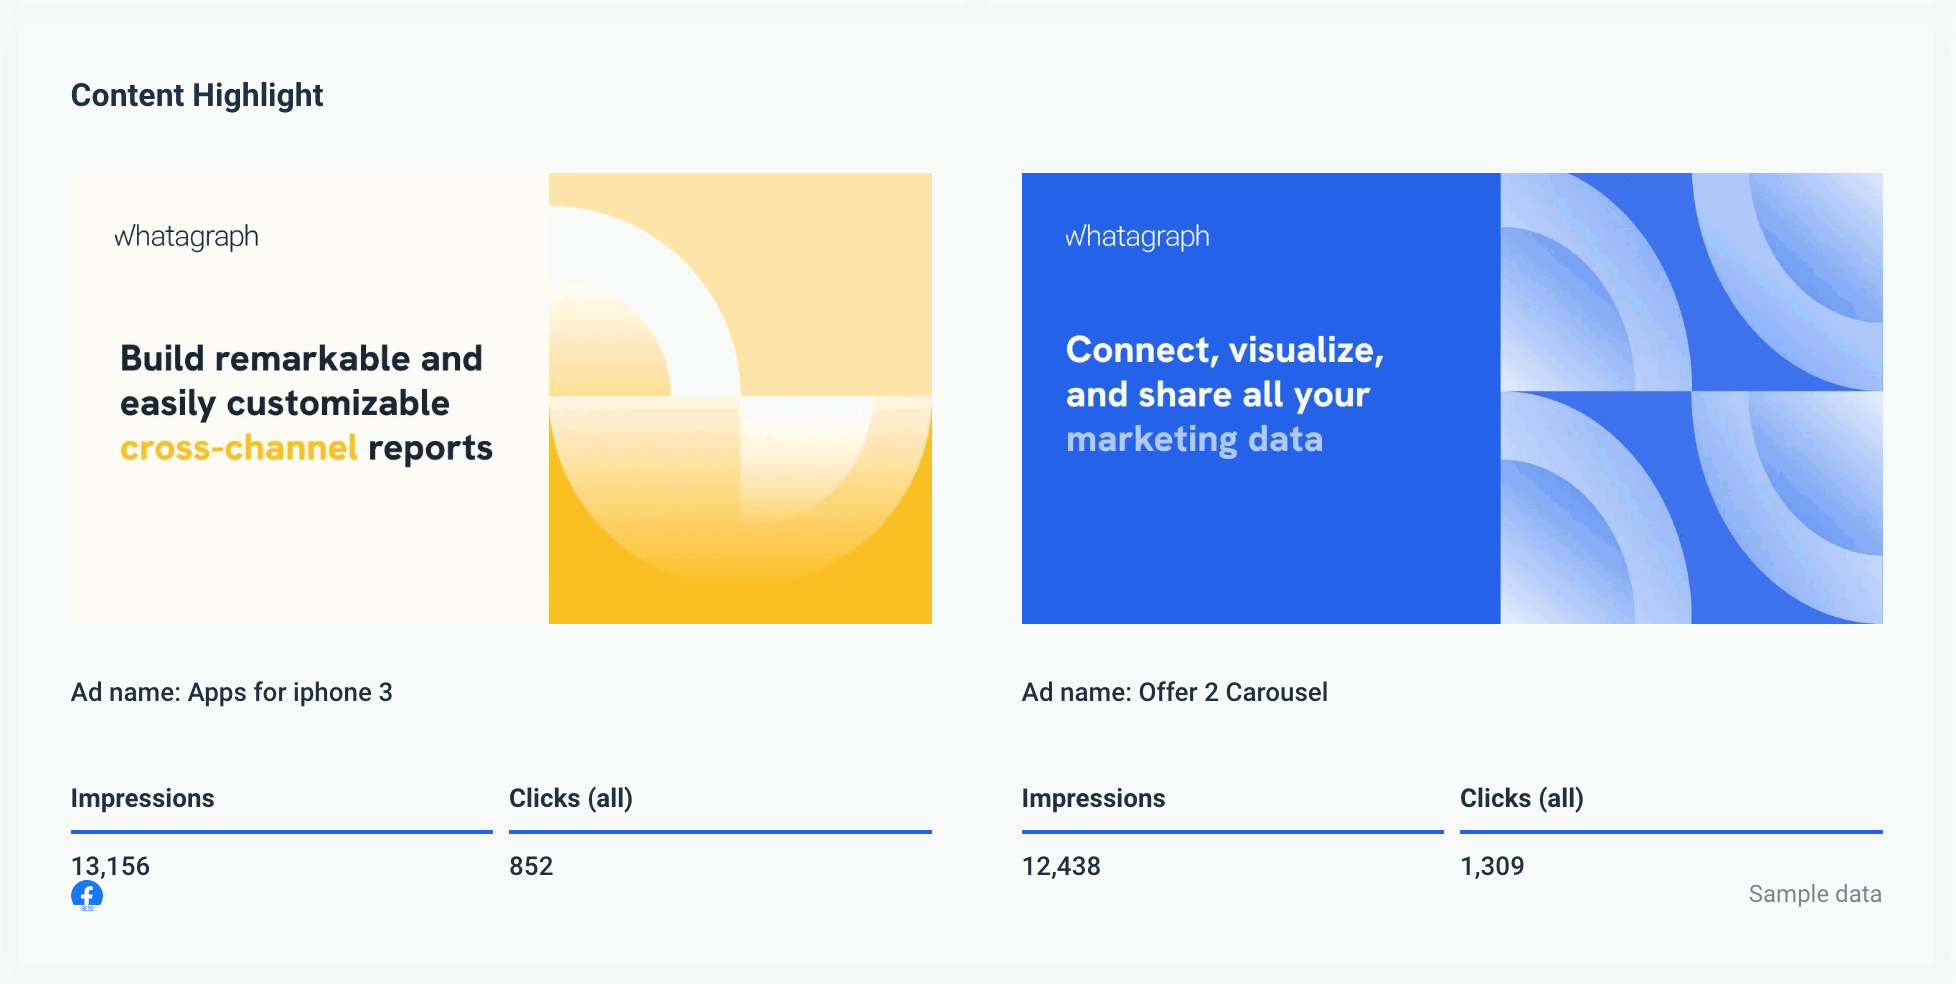
Marketing analytics report template summary

Content performance

The content performance section of a digital marketing analytics report lets your clients quickly see what kind of engagement each social media post received from their followers. The media widgets display the post creative together with engagement metrics of your choice — how many people clicked on each post, how many times the post was shared, the number of reactions to comments, the number of times videos were played, and more. This allows you to show your clients what kinds of posts work and explain why you plan to release more posts aimed at similar target audiences.

Marketing analytics report template content performance

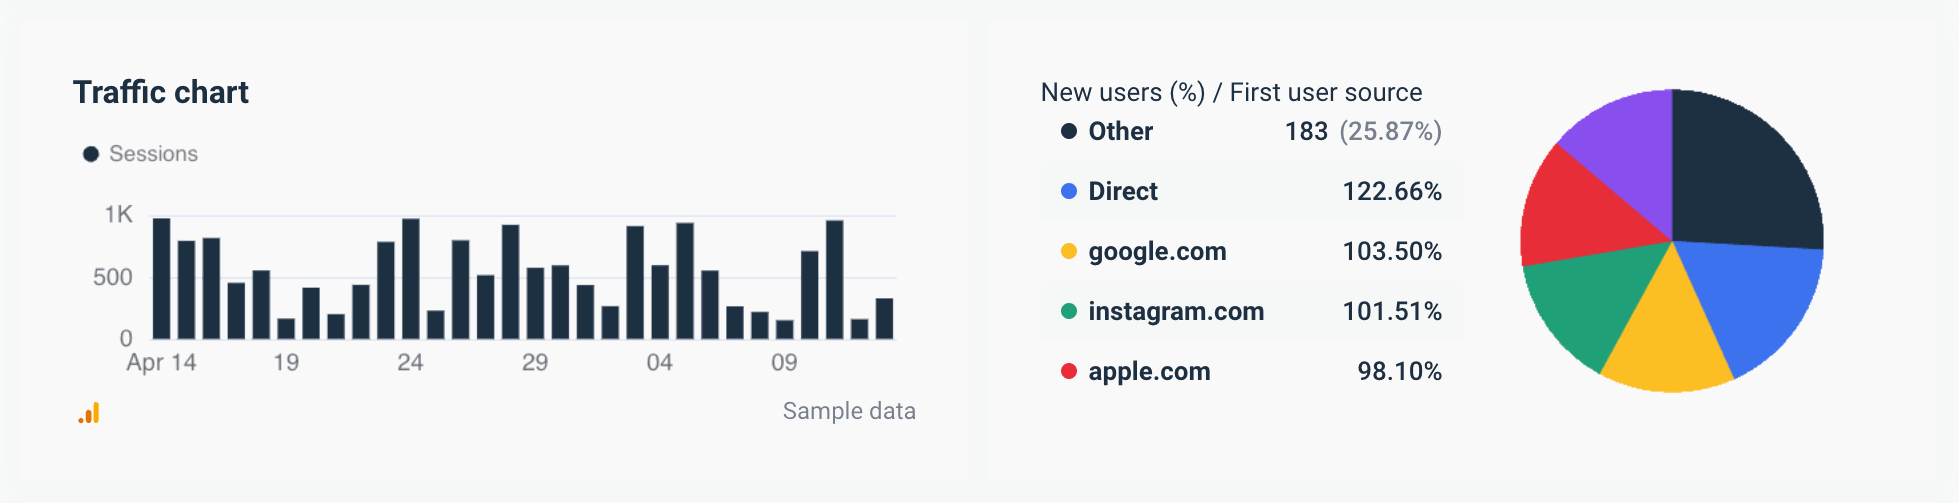
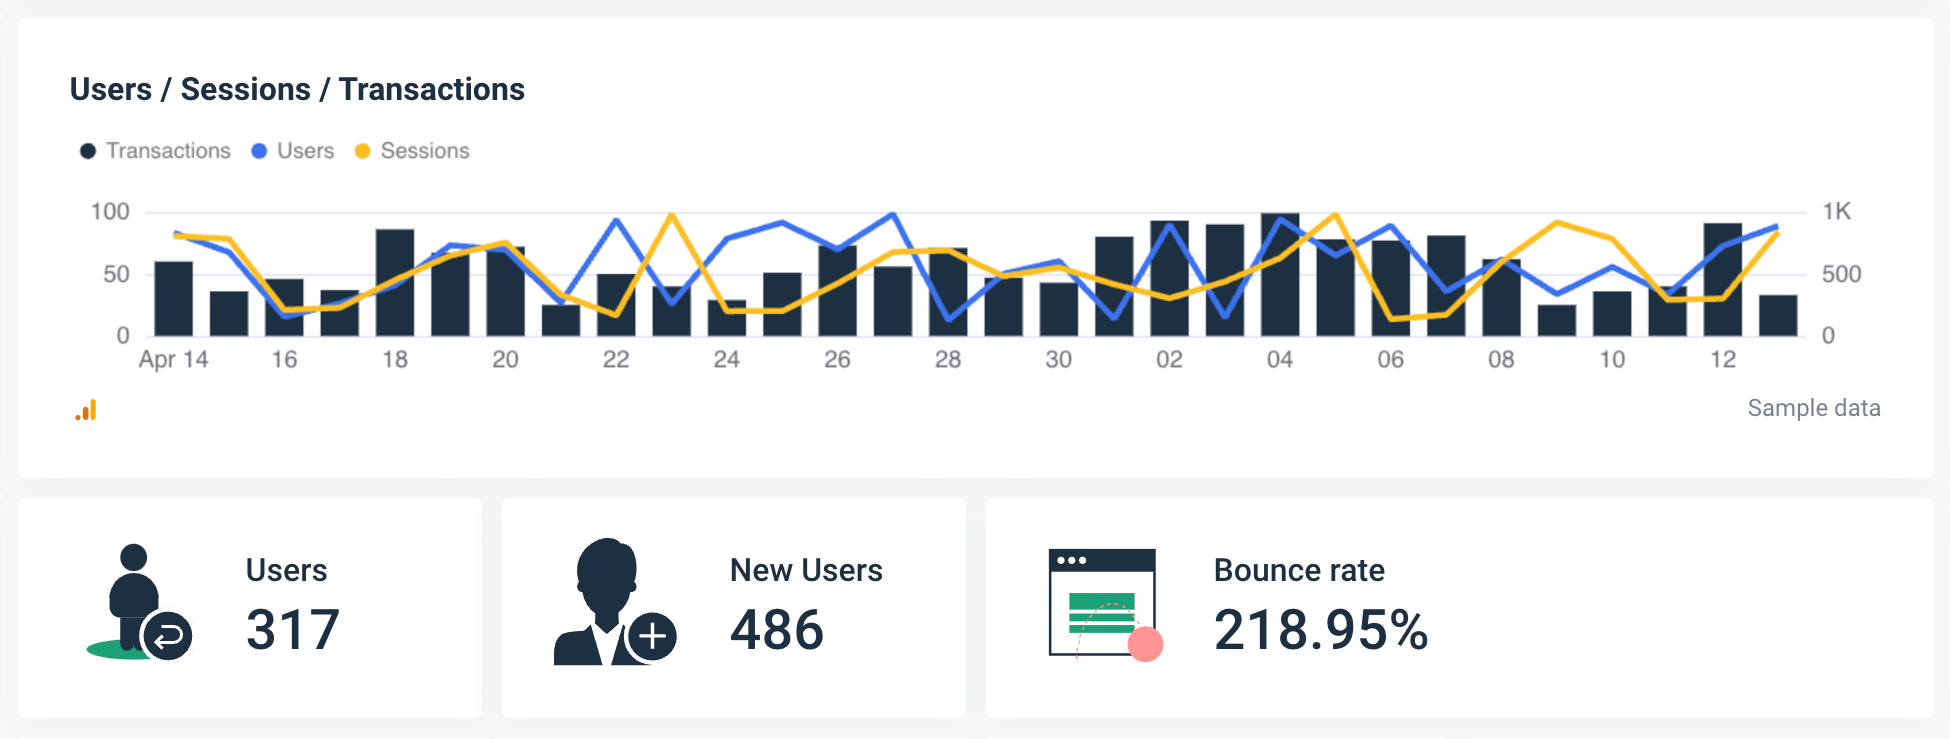
Website traffic overview

The website traffic section provides valuable insights that can help your clients understand how users interact with their site, identify areas for improvement, and make data-driven decisions to optimize campaign performance and achieve their business goals. Using data from your Google Analytics account, these widgets can show you the relation between sessions and users vs. transactions, the number of new and returning users, and your bounce rate.
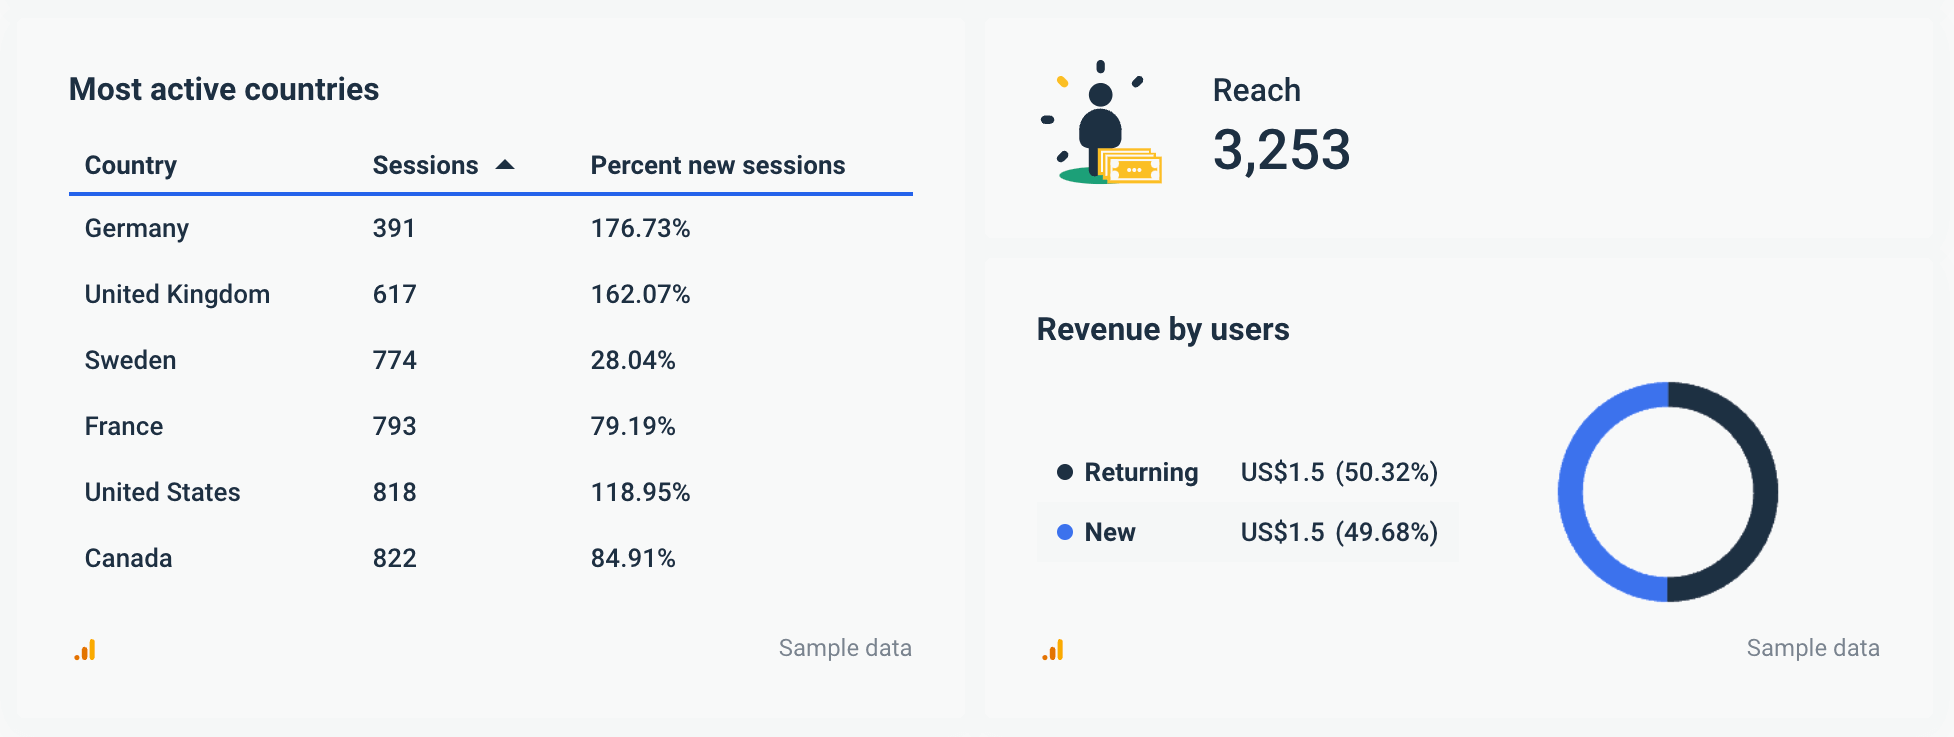
Marketing analytics report template website traffic

Audience insights
The audience insights section of this digital marketing report template provides valuable information about the demographics, behaviors, and preferences of the audience interacting with a brand or marketing campaign. The audience section gives you insight into the geographic location of the audience, including the top countries, cities, or regions where users are located, as well as revenue generated by the users and the total reach.
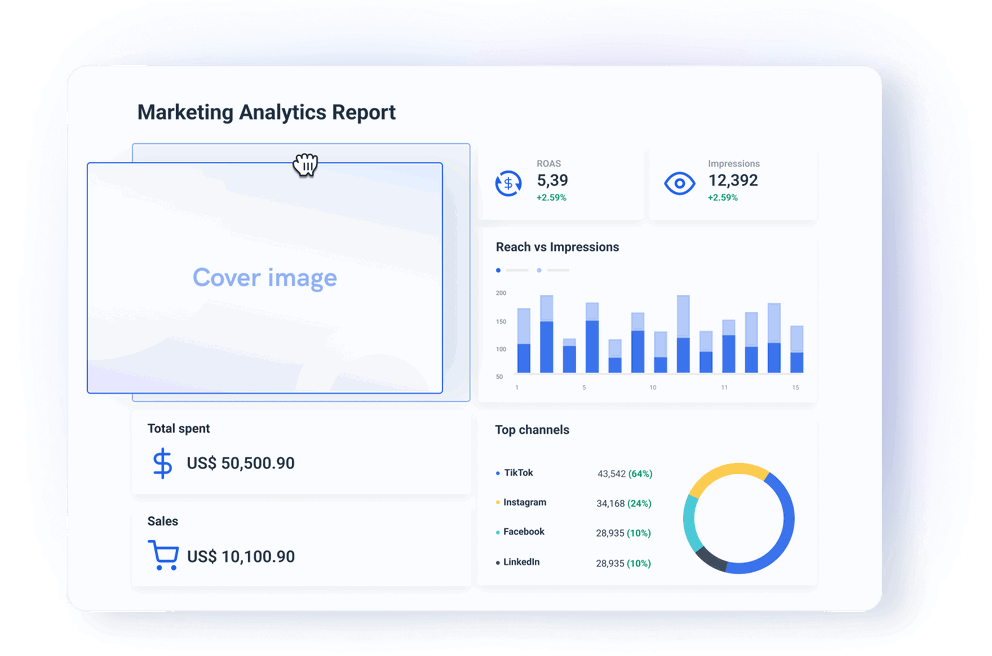
Marketing analytics report audience insights

Channel overview

The channel overview section of a marketing analytics report provides insights into the performance of various marketing channels or sources that drive traffic to a website or generate leads. The proportion of total website traffic attributed to each marketing channel helps you understand the relative importance of each channel in driving overall website traffic and assess the effectiveness of your marketing efforts across different channels. Coupled with our channel revenue table widget, it can reveal any trends or patterns in channel performance over time and help you identify emerging opportunities or challenges in your approach and adjust your strategies accordingly to maximize results.

Marketing analytics report template channel overview

FAQs

All your questions answered. And if you can’t find it here, chat to our friendly team.

How do you write a marketing analytics report?

Writing a marketing analytics report includes several steps that ensure that clients or stakeholders get accurate key insights and recommendations from analyzing marketing data.


Here's a general outline of how to write a marketing analytics report:


Step 1: Define Objectives and Audience


Start planning the report by clearly defining the objectives of the report and identifying the target audience. Understand what insights the stakeholders are seeking and tailor the report accordingly.


Step 2: Collect and analyze data


Gather relevant marketing data from various sources, such as website analytics platforms, advertising platforms, CRM systems, and social media analytics tools. With Whatagraph, your job is made easy; you just need to connect all your marketing platform accounts, and the data directly flows in. Use different visual widgets, filters, and calculations to analyze data and identify trends, patterns, and correlations.


Step 3: Structure the report


Organize the report into sections based on the key areas of analysis and insights. Common sections may include an executive summary, website overview, social media, paid advertising, audience insights, etc. In Whatagraph digital marketing report templates, you can use a different tab for each section. When structuring a digital marketing analytics report, ensure the information is presented logically and easily. Consider the preferences and feedback from your clients when organizing the sections.


Step 4: Write an executive summary and recommendations


Provide an executive summary that gives a concise overview of the main findings and recommendations of the report. Summarize the key insights, implications, and next steps clearly and compellingly. Based on the insights generated from the analysis, provide actionable recommendations for optimizing marketing strategies, campaigns, and tactics. Clearly outline the recommended actions, explaining the rationale behind each recommendation and how it aligns with the overall marketing objectives.


Step 5: Finalize and distribute


Once the report is done, distribute it to the intended audience, providing guidance on interpreting the findings and implementing the recommendations effectively. Before you set up automated reporting, Whatagraph allows you to figure in and extra review step, so you can take a final look at what is being sent out.

What should a marketing analytics report include?

A marketing analytics report is a comprehensive strategic record that you can use to develop a long-term marketing strategy. Depending on the marketing goals you have created, you should focus on two things. 


First, the bottom line. It answers the question, “What revenue have you generated?”.


Usually, revenue is broken down into smaller figures:


-  By landing page; 


-  By source; 


-  By audience segment. 


The second is brand awareness. The key marketing metrics and key performance indicators you monitor depend on the channel you try to reach your audience. Here are some KPIs for each channel:


-  PPC: impressions, reach, CTR (click-through rate), and ROAS (return on ad spend).


-  Social media: reach, engagement rate, CTR.


-  Email marketing: open rate, CTR, unsubscribe rate.


-  SEO: CTR by search query, average position on the page for popular search queries, most popular search queries.


-  Website: organic traffic, bounce rate, new vs. returning visitors, conversion rate, total sessions, unique sessions.


To make the report more compelling, use data visualization elements. Nobody wants to look at raw figures and determine what they mean. Graphs, tables, charts, and images portray marketing results so that a quick look reveals whether or not the marketing plan is effective.

What sources can I connect to a digital marketing report template?

Whatagraph allows you to connect data from over 45 native integrations. These include Google Analytics 4, social media platforms like LinkedIn and Facebook, PPC apps like Google Ads and Facebook Ads, Google Search Console and other search engine optimization tools, e-commerce platforms like Shopify and WooCommerce, email marketing tools like Mailchimp and ActiveCampaign, and CRMs like HubSpot and Salesforce.


In addition, you can connect any unsupported source via a Custom API, BigQuery, or Google Sheets.

It’s good to be loved! Our clients are not shy about expressing it.

I made a switch from GDS and Sheets for reporting to Whatagraph, and I am saving literal hours each week on performance report creation. Our small firm actually managed to onboard 2 new clients as a result of all the time we saved on managing data and reporting. The customer service is also really helpful and easy to reach.

Mindaugas S., Marketing Consultant Capterra logo for Whatagraph review

Capterra verified review by

Mindaugas S., Marketing Consultant

Having active customer support to help fix any issues was a big contributor, but we also really liked the ability to save templates and connect sources to multiple charts/widgets at once without having to edit them individually. And having the grid layout is much easier to stay consistent with than the free form setup that Data Studio has.

Nico T., Media Planner Capterra logo for Whatagraph review

Capterra verified review by

Nico T., Media Planner

The system has standard templates that are easy and fast to use. Also you can build your own report with lightning speed. It is very easy to use, has a lot of integration, and let get started very fast.

Rasmus Bernt K., External Senior Management Consultant Capterra logo for Whatagraph review

Capterra verified review by

Rasmus Bernt K., External Senior Management Consultant

We love Whatagraph - we would definitely recommend and our account manager is great! I love how easy this tool is to use, everyone on the team finds it much more user-friendly than other dashboards. Integration was easy, we sent some example reports to the team who duplicated these for us. We literally had to log in and send it to our clients!

Stephanie S., Digital Director Capterra logo for Whatagraph review

Capterra verified review by

Stephanie S., Digital Director

We are showing our clients the work that we're doing for them and this is incredibly important for our clients ROI. They want to see results and having a tool like Whatagraph that can show data from virtually every source we use is hugely important.

John S., SEO Strategist Capterra logo for Whatagraph review

Capterra verified review by

John S., SEO Strategist

The tool is easy to use; you do not need to have development resources. Even my junior project managers are capable of making campaign reports in minutes. There are a lot of pre-made templates you can use as well as many pre-made widgets.

Erman E., Marketing Specialist Capterra logo for Whatagraph review

Capterra verified review by

Erman E., Marketing Specialist

Really easy to connect data sources within the tool. The library of report templates has been helpful. The customer support team has been responsive to all of our needs. Our team enjoys the simplicity of setting up the reports and how the data is presented.

Brent N., Director of Operations Capterra logo for Whatagraph review

Capterra verified review by

Brent N., Director of Operations

Easy to create really beautiful graphs and reports which can help other team members to understand the most important takeaways. I especially like the automated report function, so I don't have to check on the same thing repeatedly.

Orsolya S., Online Marketing Manager Capterra logo for Whatagraph review

Capterra verified review by

Orsolya S., Online Marketing Manager

Need more help with getting started?

An image of the Whatagraph dashboard, with a custom reporting template

We can set up your report campaign for you!

If you need help with setting up Whatagraph - our team can create your campaign reports!

Ready for insights?

It's time to focus your time on the tasks that really matter, and let us worry about your marketing analytics. Start your free 7-day trial.

  • Free for 7 days
  • No credit card required
  • Live chat support
  • Cancel anytime
Start Reporting For Free

No credit card required

Cross channel reporting template with Whatagraph