Free Social Media ROI Report Template

Track every click, conversion, and dollar earned from your social media campaigns.

This free social media ROI report template turns your ad data into a clear view of what’s driving results.

Social Media ROI Report Template - Dashboard displaying social media performance metrics and integration icons.

Create Custom Social Media ROI Report in Seconds

With Whatagraph IQ, just tell us what you need, and we'll build a stunning social media ROI report for you. No templates or manual setup needed.

What is a Social Media ROI Report Template?

A social media ROI report template shows how your social media campaigns contribute to real business results. It connects your social media metrics—like engagement rate, conversion rate, click-through rate, and ad spend—to the return on investment they generate.

This kind of performance report helps social media managers and marketing teams track how well their content drives revenue, leads, or brand awareness. Instead of juggling spreadsheets or guessing what works, you can visualize your key metrics across social media platforms like LinkedIn, TikTok, and Facebook in a clear dashboard.

In Whatagraph, these social media dashboards are built automatically. Your social media analytics and marketing data flow into a single place, giving your stakeholders a complete view of campaign impact and helping your team optimize your social media strategy with real-time, actionable insights.

What Should a Social Media Report Template Include?

A strong social media report template helps you prove the value of your social media campaigns and show clear results to your stakeholders.

In Whatagraph, every report is designed to visualize key metrics, surface actionable insights, and connect your social media marketing results directly to your business goals.

Here’s what your social media report should include:

1. Performance Overview Tab

This is the first place your marketing team checks to understand social media performance across all channels.
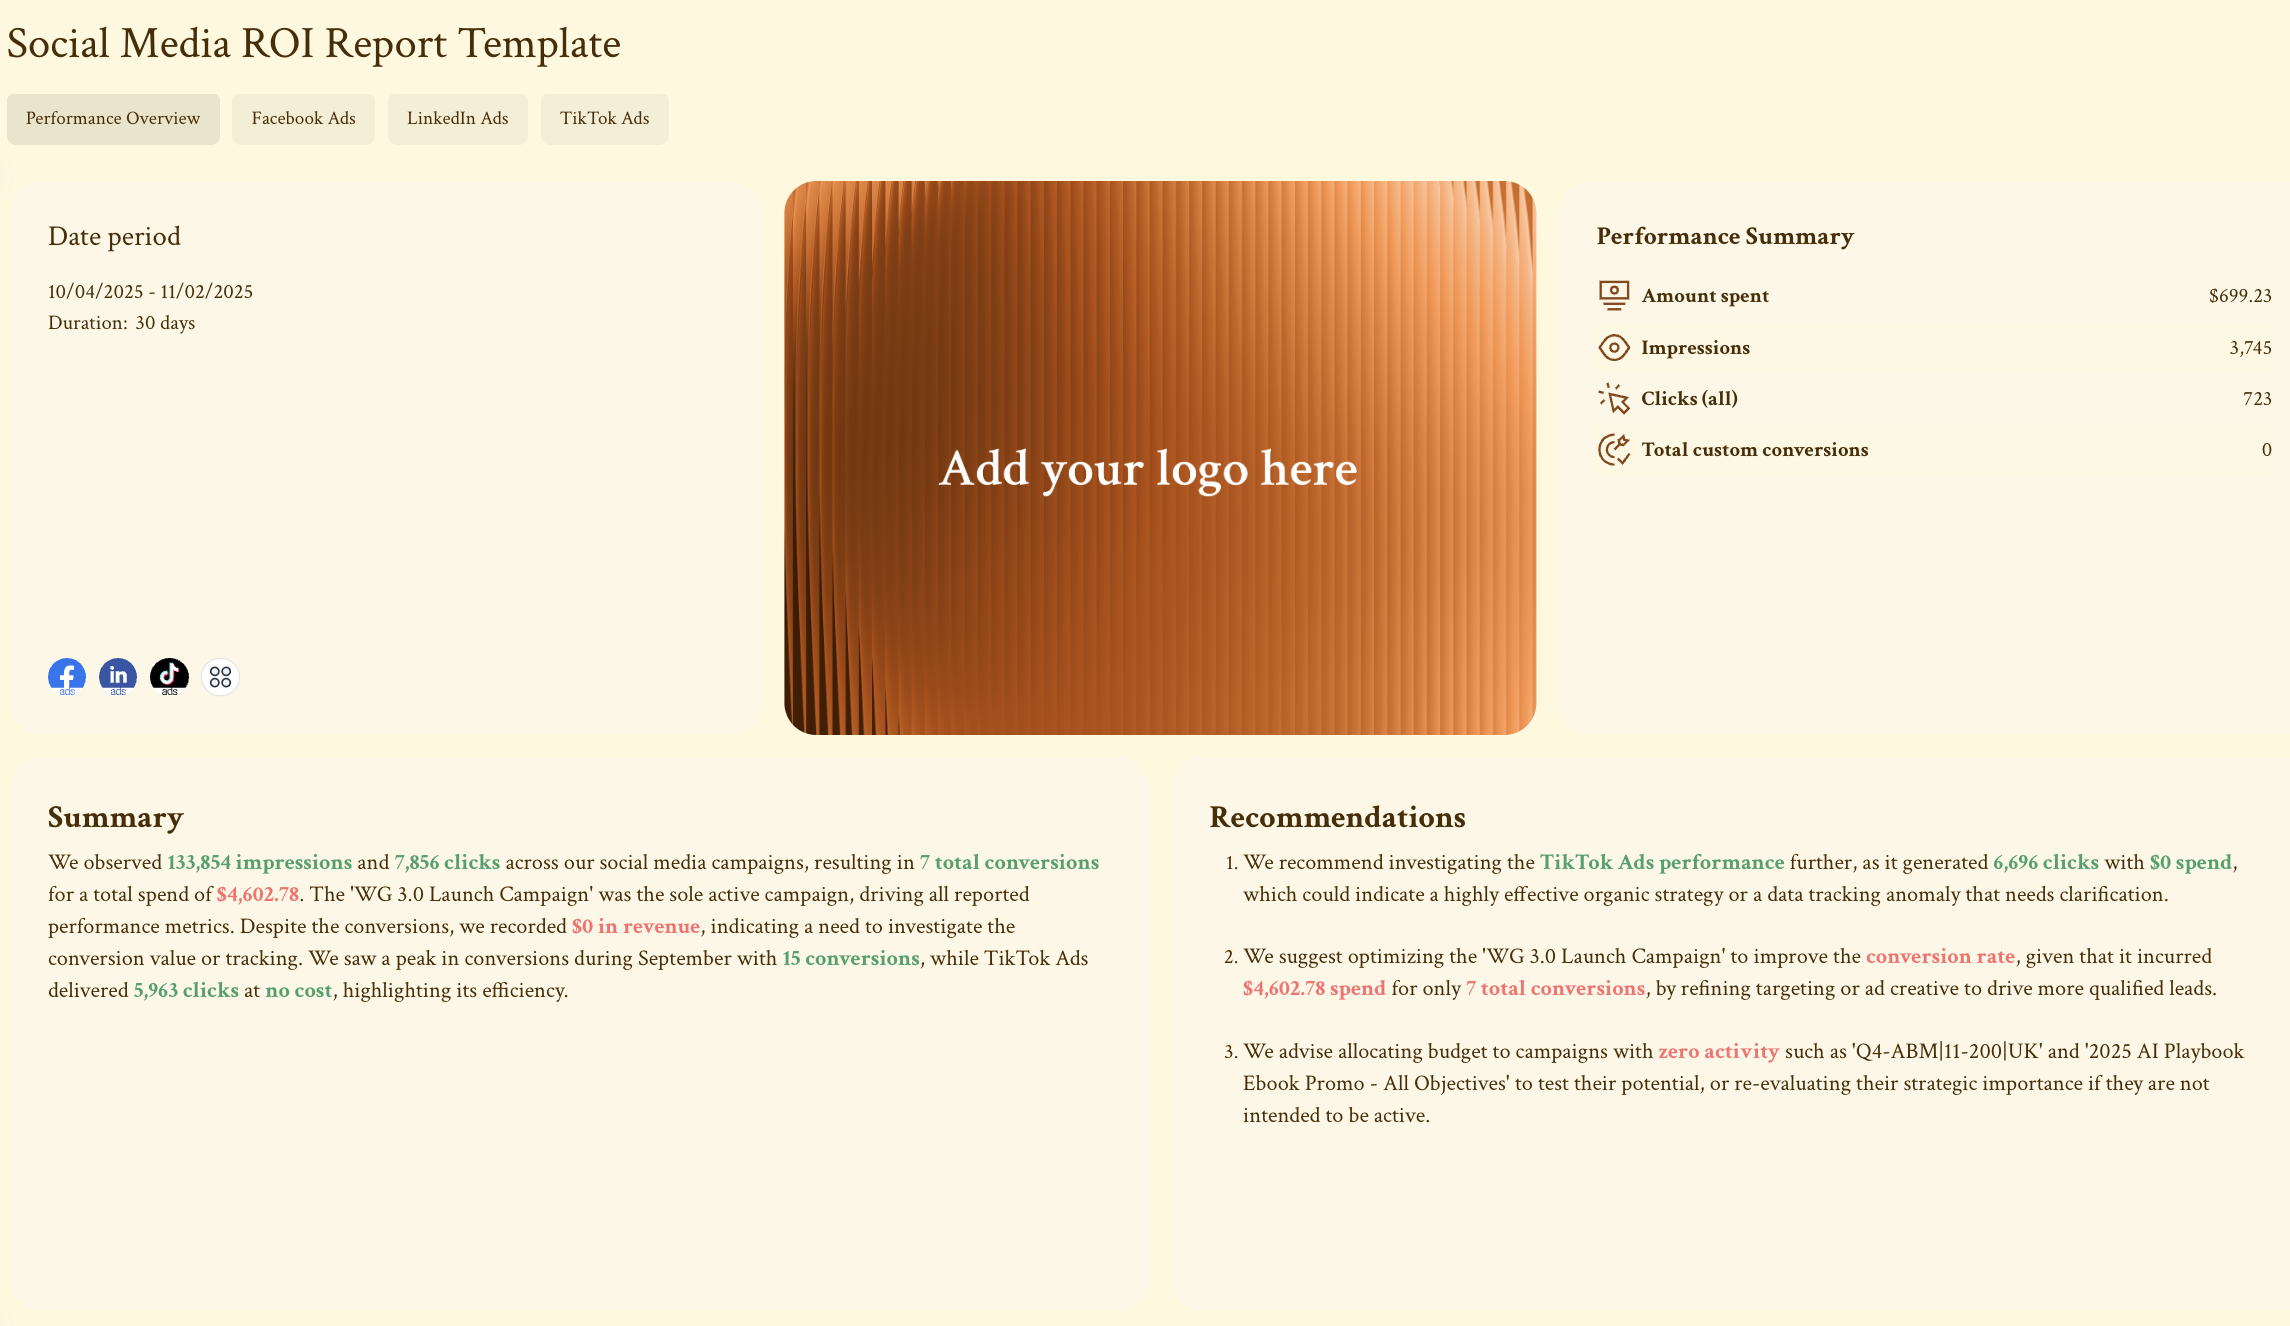
  • Performance summary

Start with a simple list of your most important social media KPIs: amount spent, impressions, clicks, conversions, revenue, and ROAS. Having these metrics front and center helps social media managers quickly spot performance shifts.

  • Summary and recommendations

Add text widgets that summarize overall results and offer next steps. You can use Whatagraph IQ to automatically generate summaries, wins, and recommendations written directly from your social media data: no manual input or guesswork.

Social Media ROI Report Template - ROI report showing performance summary and recommendations.

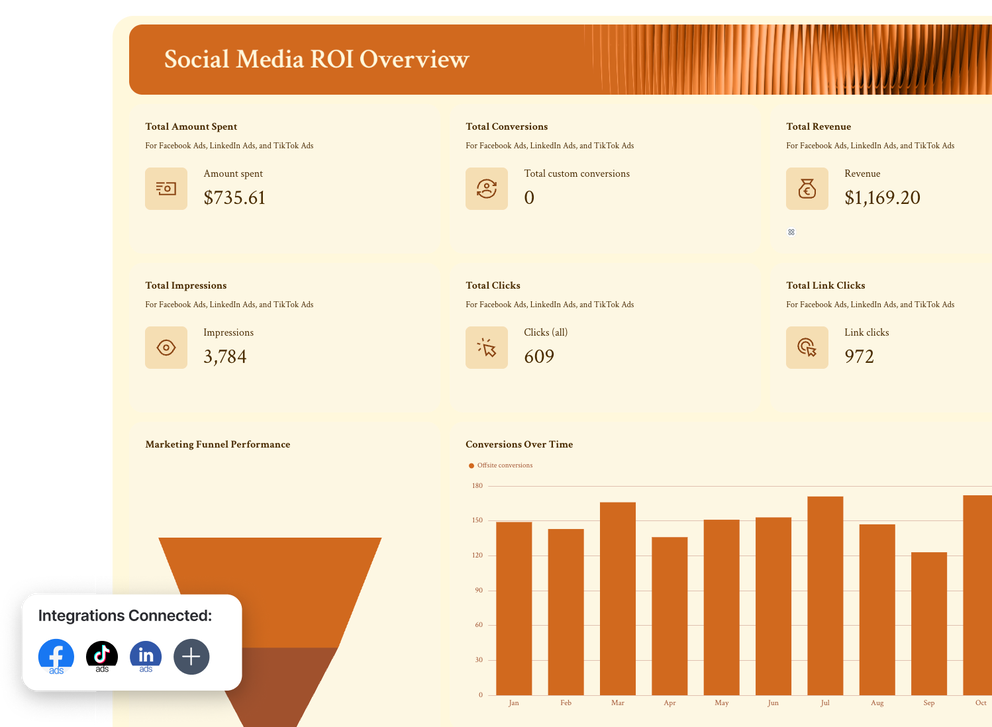
  • Social Media ROI Overview

This section combines social media analytics from multiple social media platforms (like Facebook Ads, LinkedIn Ads, and TikTok Ads) into one view. You can easily create blended metrics, for example, “total amount spent” or “combined revenue”, using Source Groups.

Source Groups let you:

  • Aggregate key performance indicators without complex formulas
  • Analyze cross-channel data side by side
  • Keep your dashboard clean and your reporting streamlined

Social Media Roi Report Template - Social media ROI report with charts and metrics.

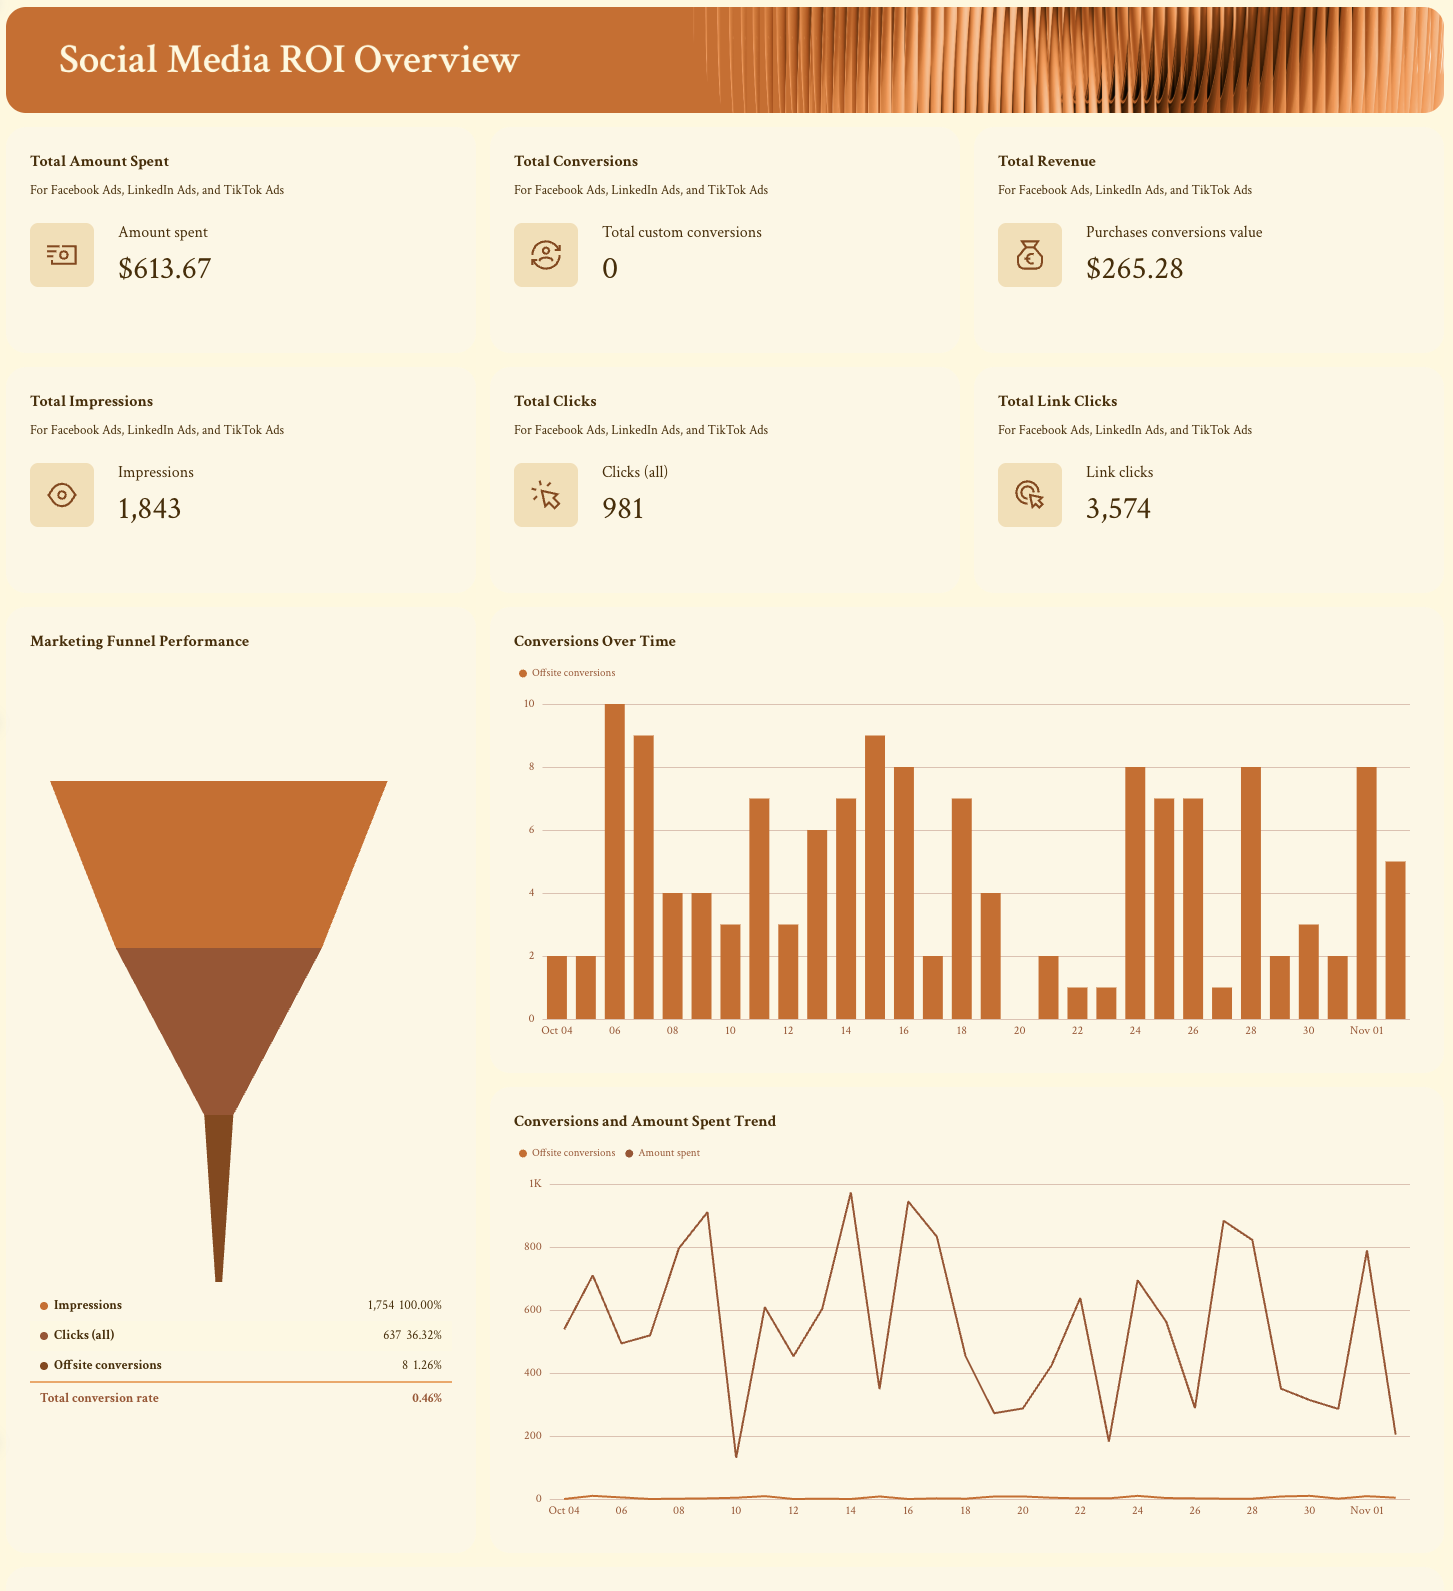
  • Marketing funnel performance

Visualize the full journey — from impressions to clicks to conversions — to see how effectively your campaigns move users through each stage.

  • Conversions over time

Track how your conversion rate and cost per acquisition evolve within your selected timeframe.

  • Conversions and amount spent trend

Compare spend and results visually to understand whether your ad spend is driving meaningful return on investment.

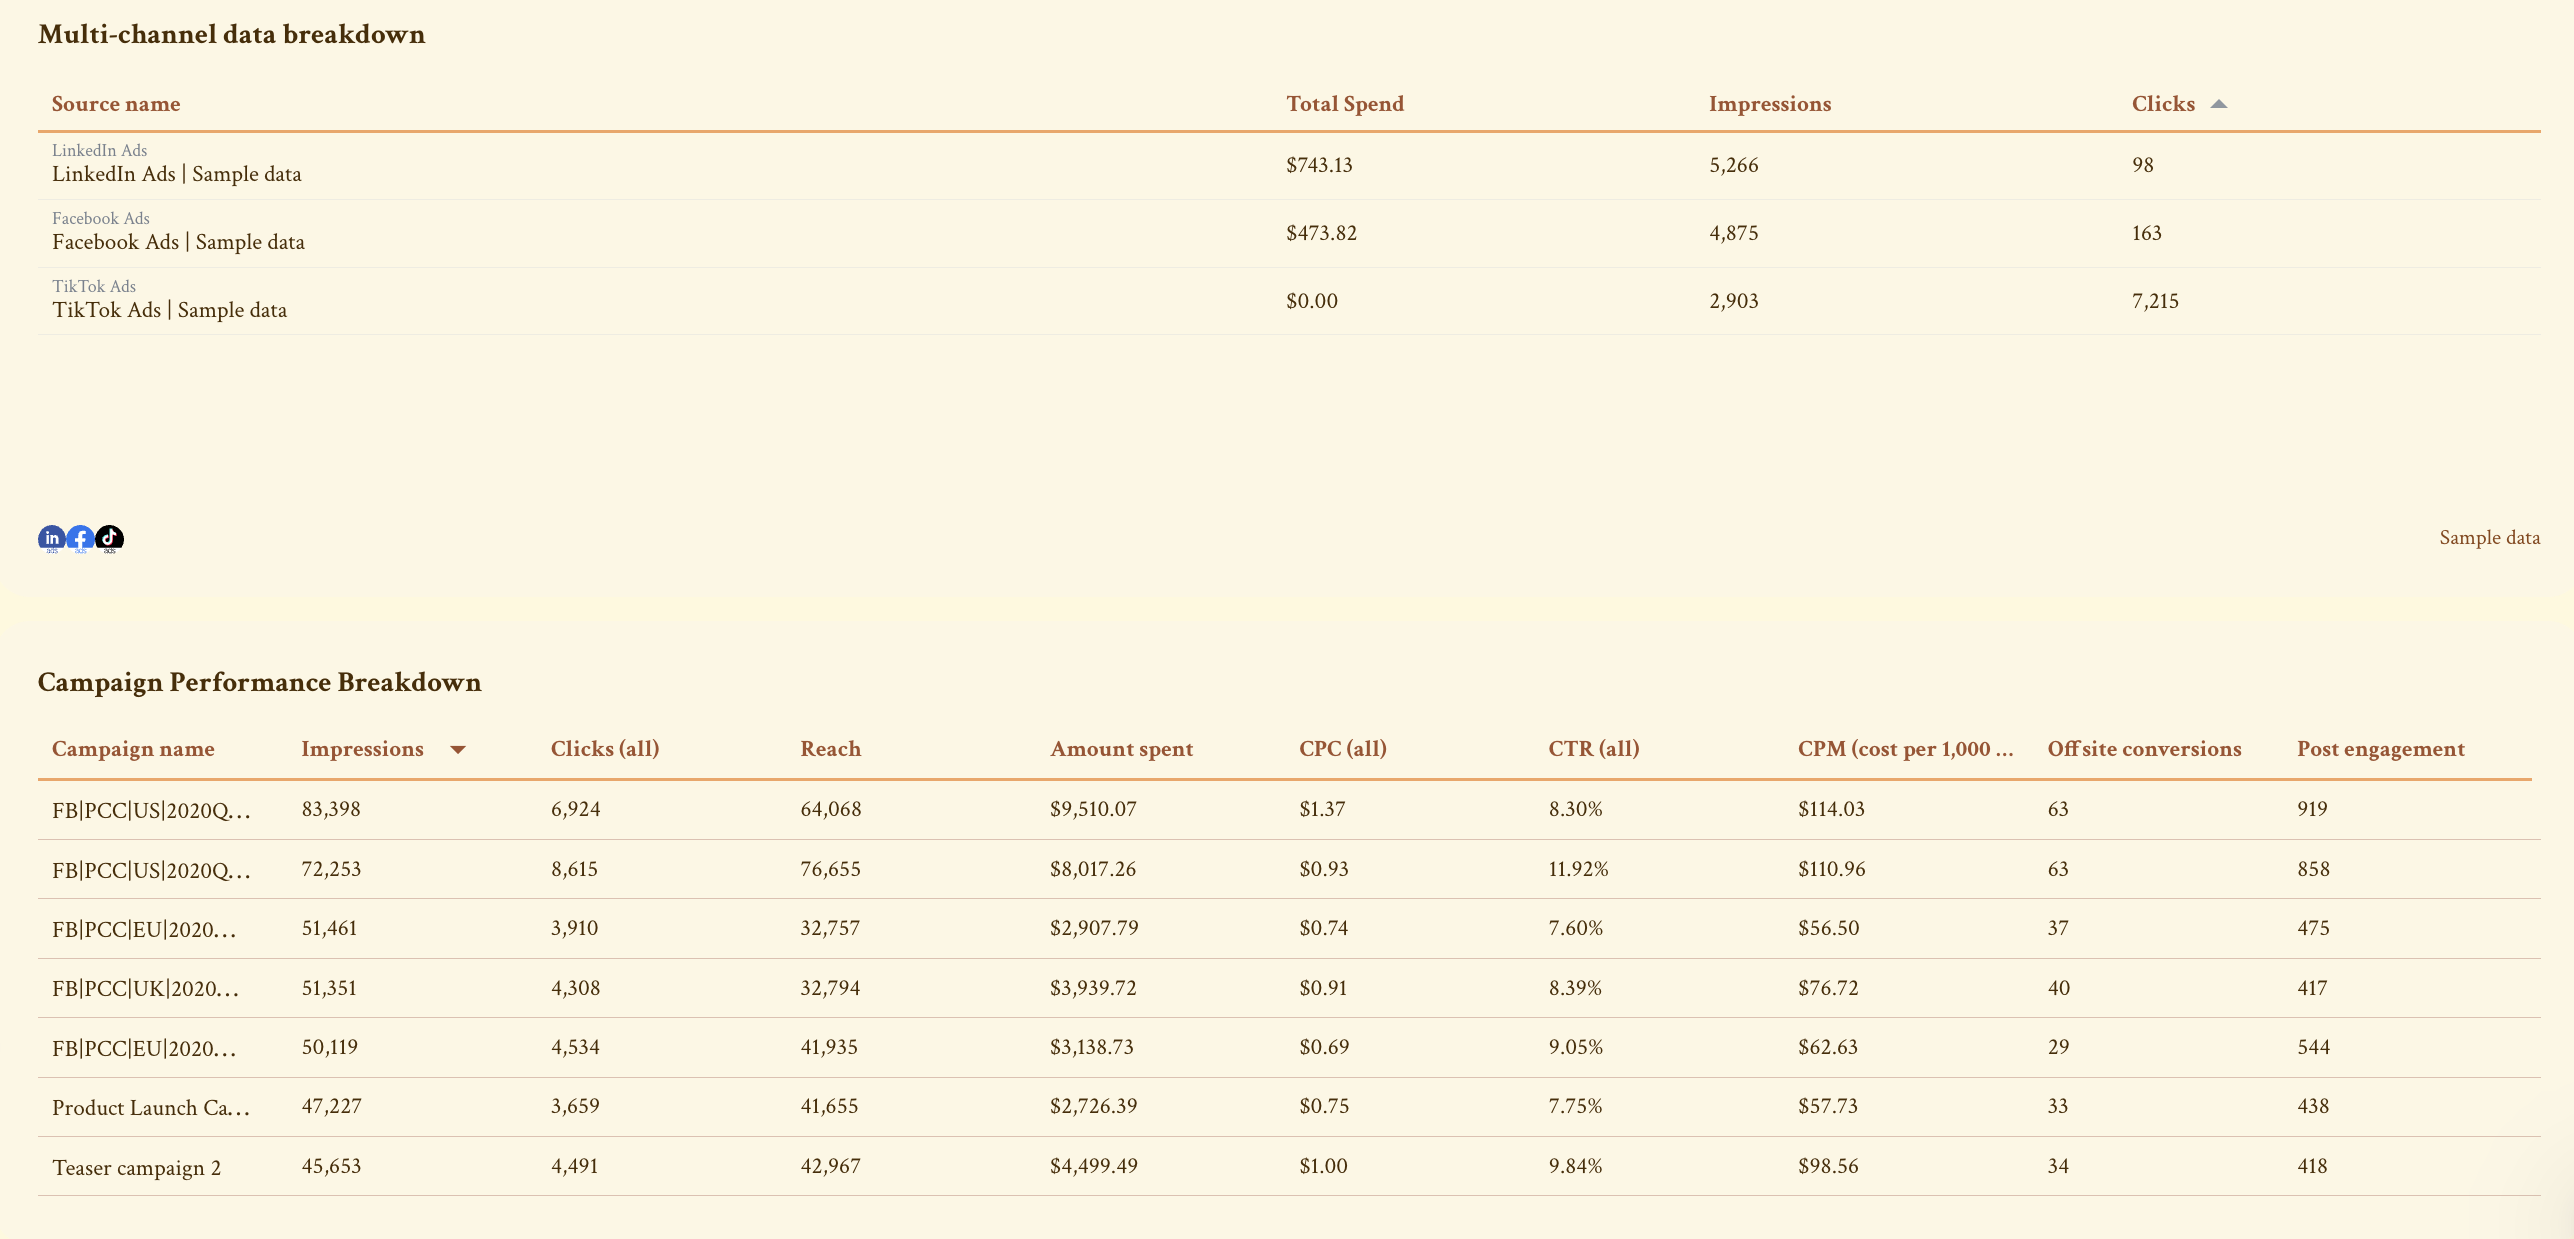
  • Multichannel breakdown

Show how each social media channel performs in a clean table — highlight impressions, clicks, CTR, reach, conversions, and spend across Facebook, LinkedIn, and TikTok.

  • Campaign performance breakdown

List all active campaigns in one view, including CTR, CPC, CPM, engagement rate, and conversion metrics. This makes it easy to benchmark performance across your marketing campaigns.

Social Media ROI Report Template - Multi Channel Breakdown - Table showing performance metrics for LinkedIn, Facebook, and TikTok ads.

2. Channel-Specific Breakdown: Facebook Ads

Each social platform deserves its own deep dive. In this Facebook Ads tab, you should include:

  • Goal widget: Set goals for your Facebook Ads campaigns like leads, purchases, or engagement and show the progress to these goals in this widget.
  • Performance summary list: Display essential performance metrics like spend, reach, clicks, CPC, and conversions.
  • Summary and recommendations: Summarize results and next steps. You can generate this text automatically with Whatagraph IQ to save time.
Social Media ROI Report - Facebook ads report showing performance metrics and recommendations.
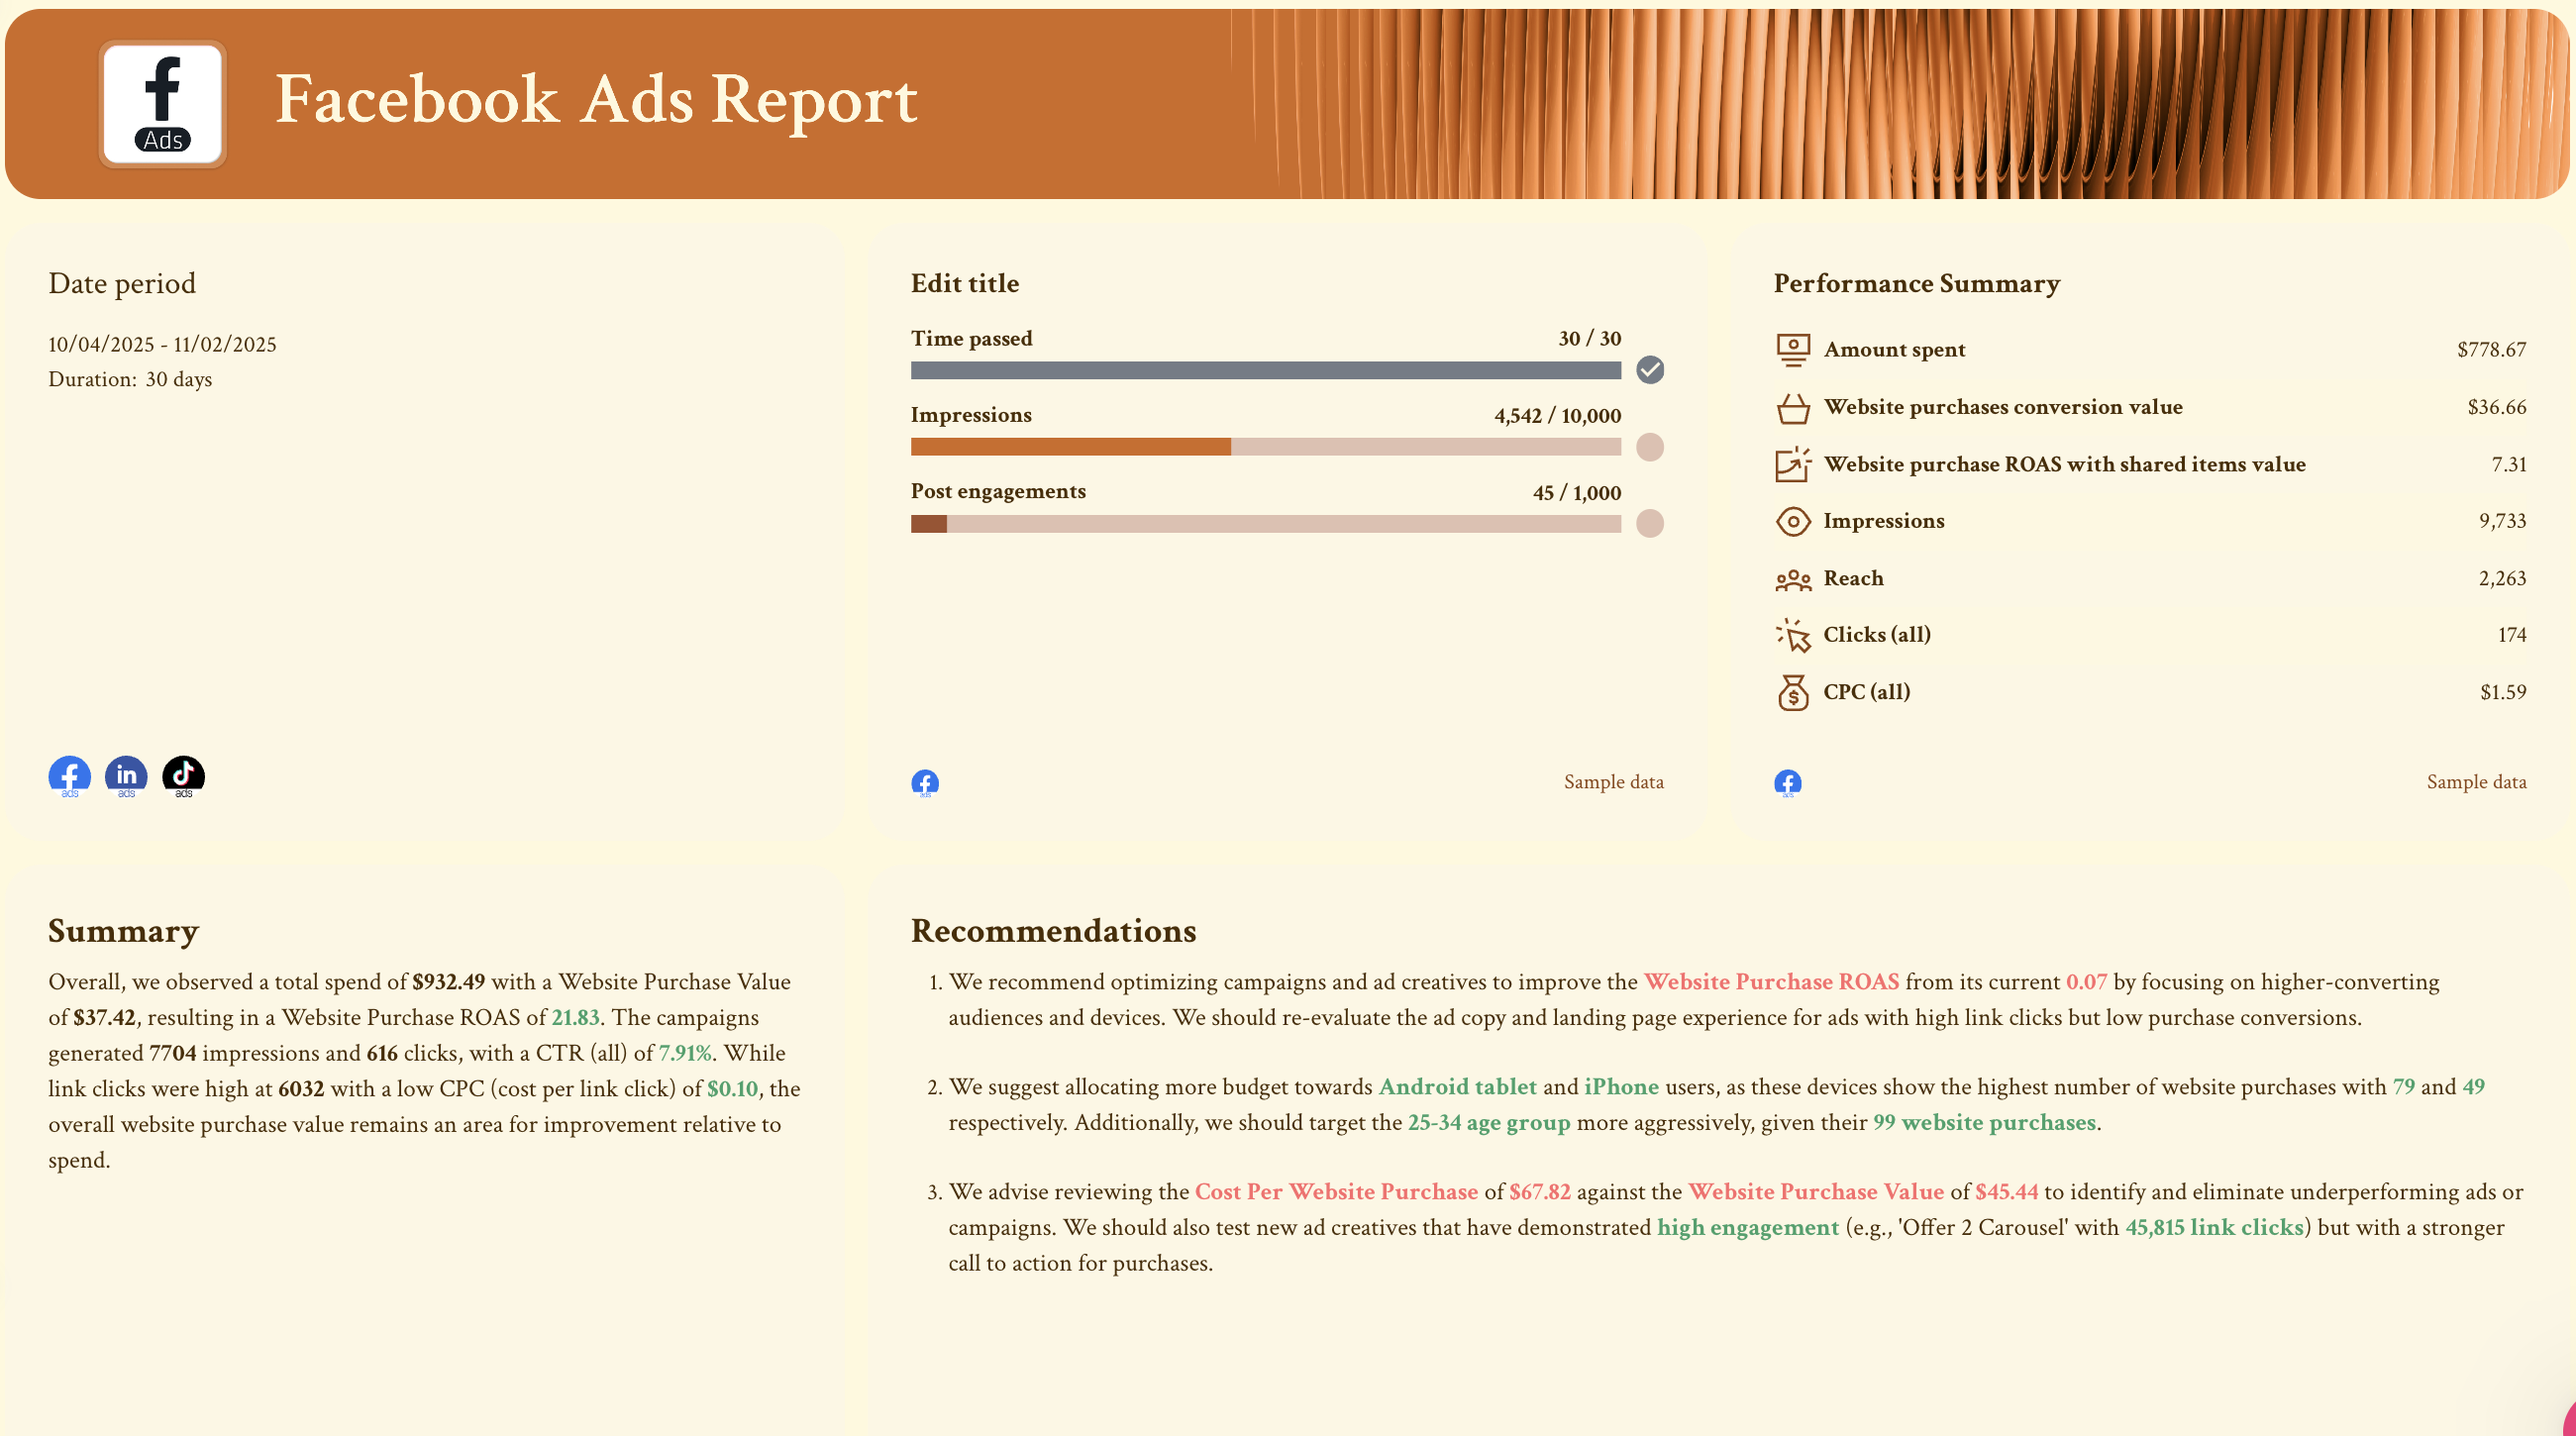
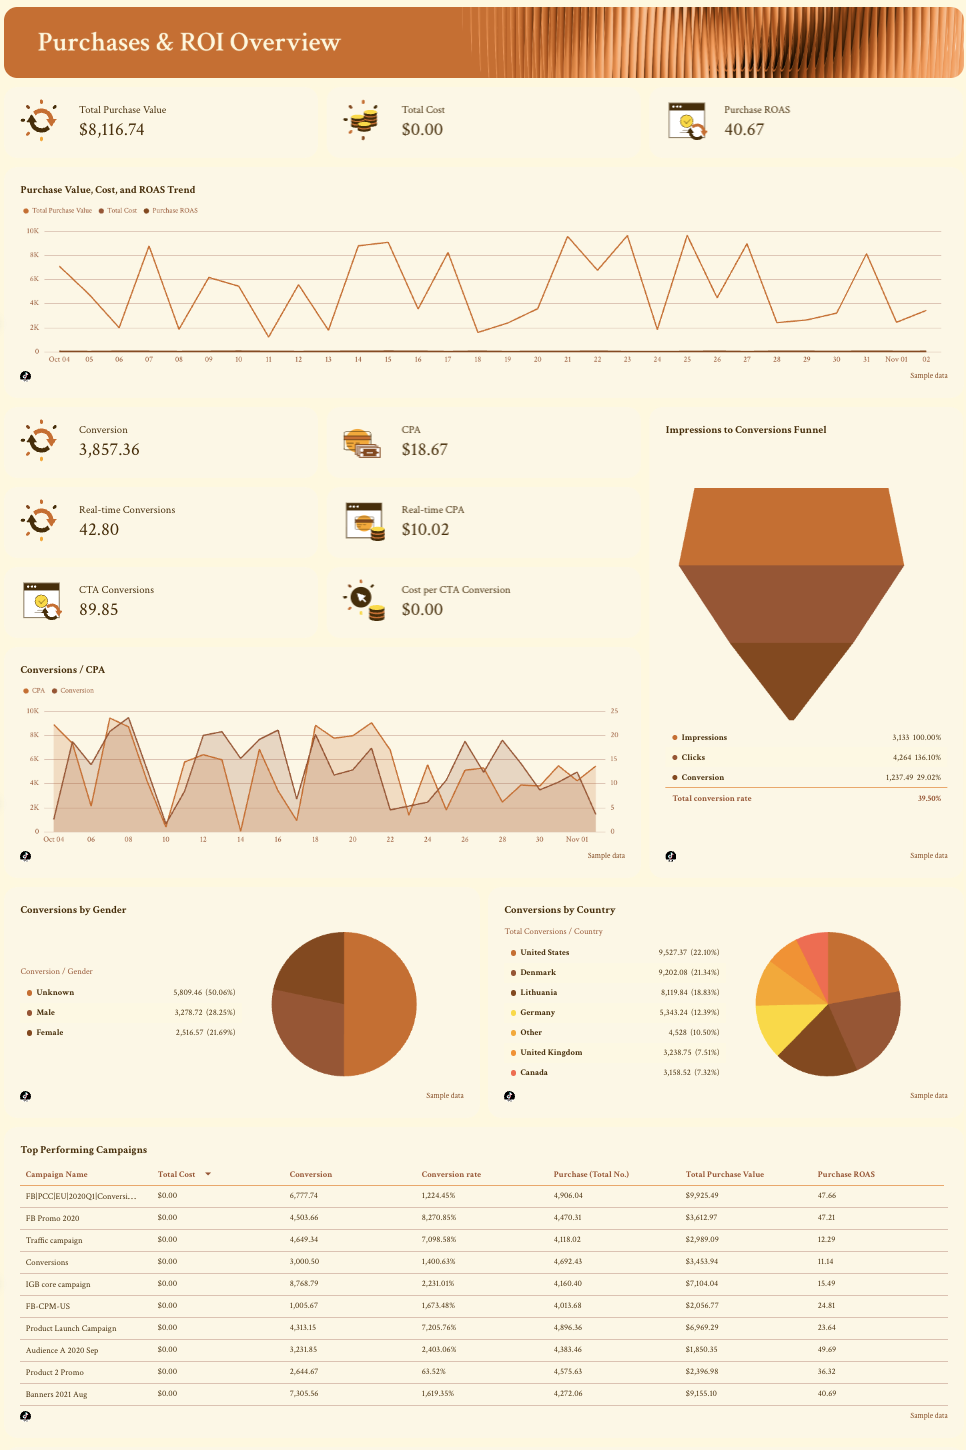
  • Purchases and ROI overview: Visualize total purchase value, cost per purchase, and ROAS to evaluate campaign ROI.
  • Impressions and clicks overview: Track trends for impressions, clicks, click-through rate (CTR), and cost per click (CPC).
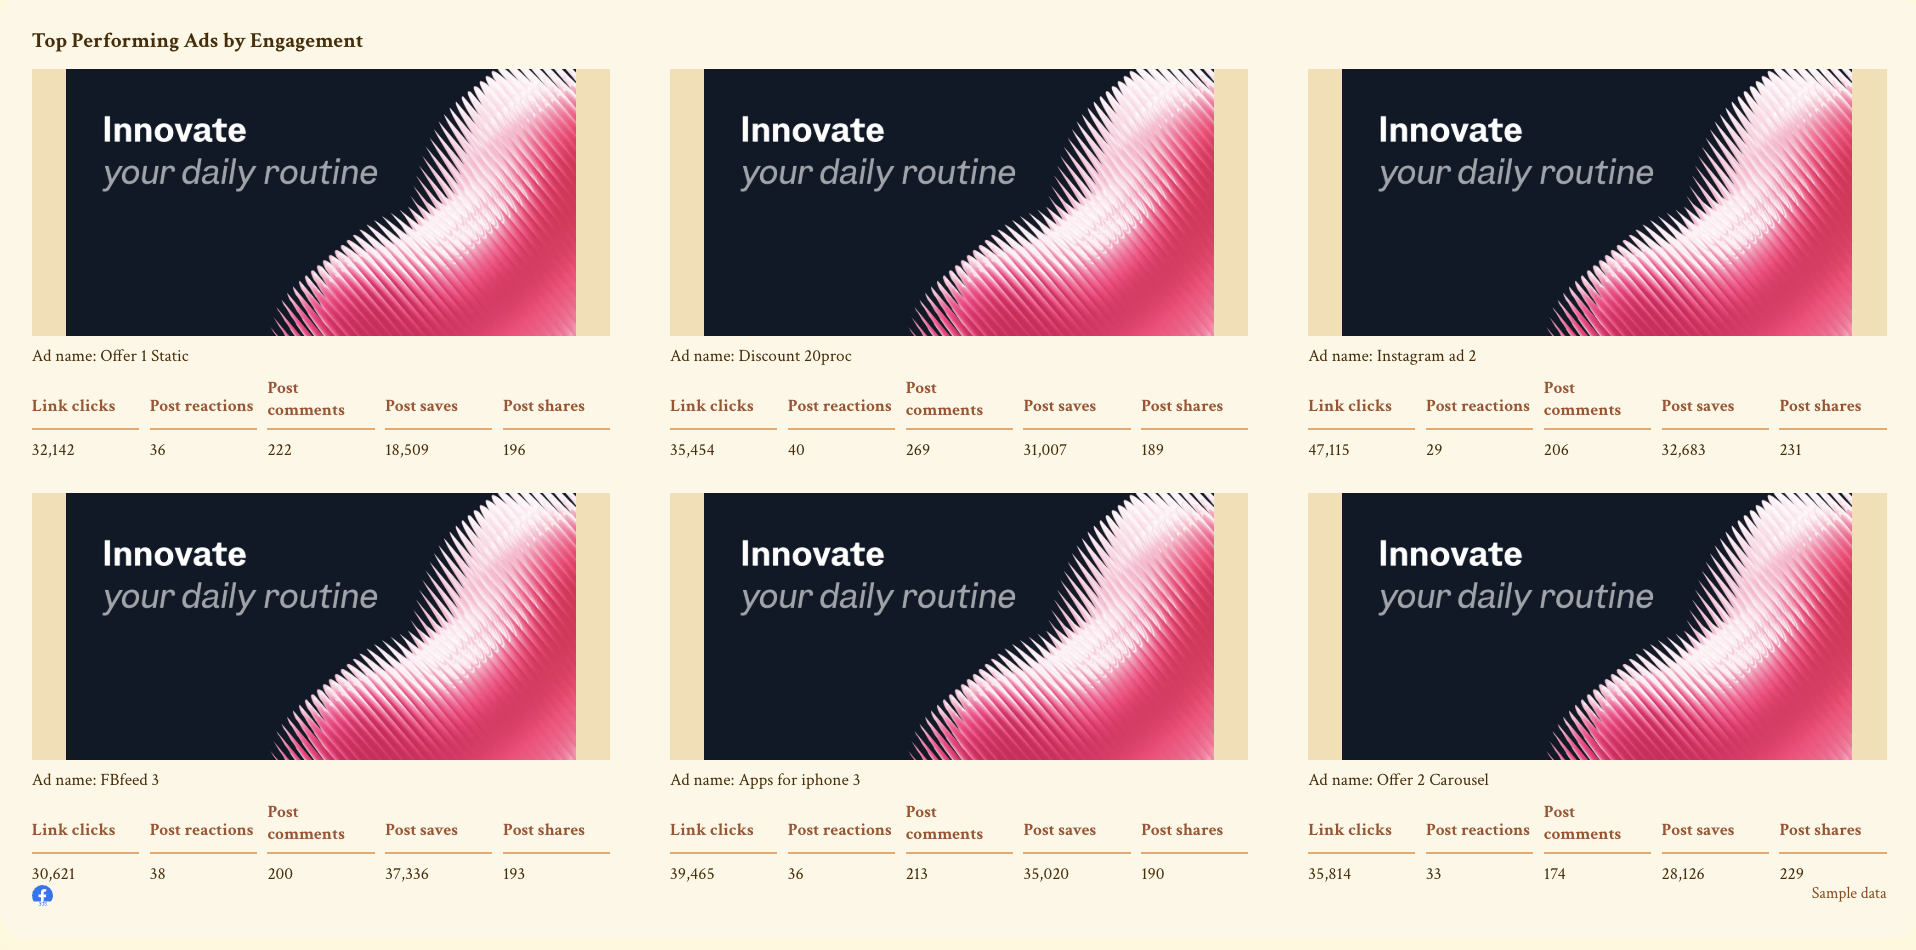
  • Campaigns and ads overview: Compare campaigns side by side to identify high-performing ad creatives and social media content.
Social Media Roi Report Template - Grid of top performing ads with metrics for engagement.
  • Demographics and devices overview: Break down performance by audience demographics, location, and device type.

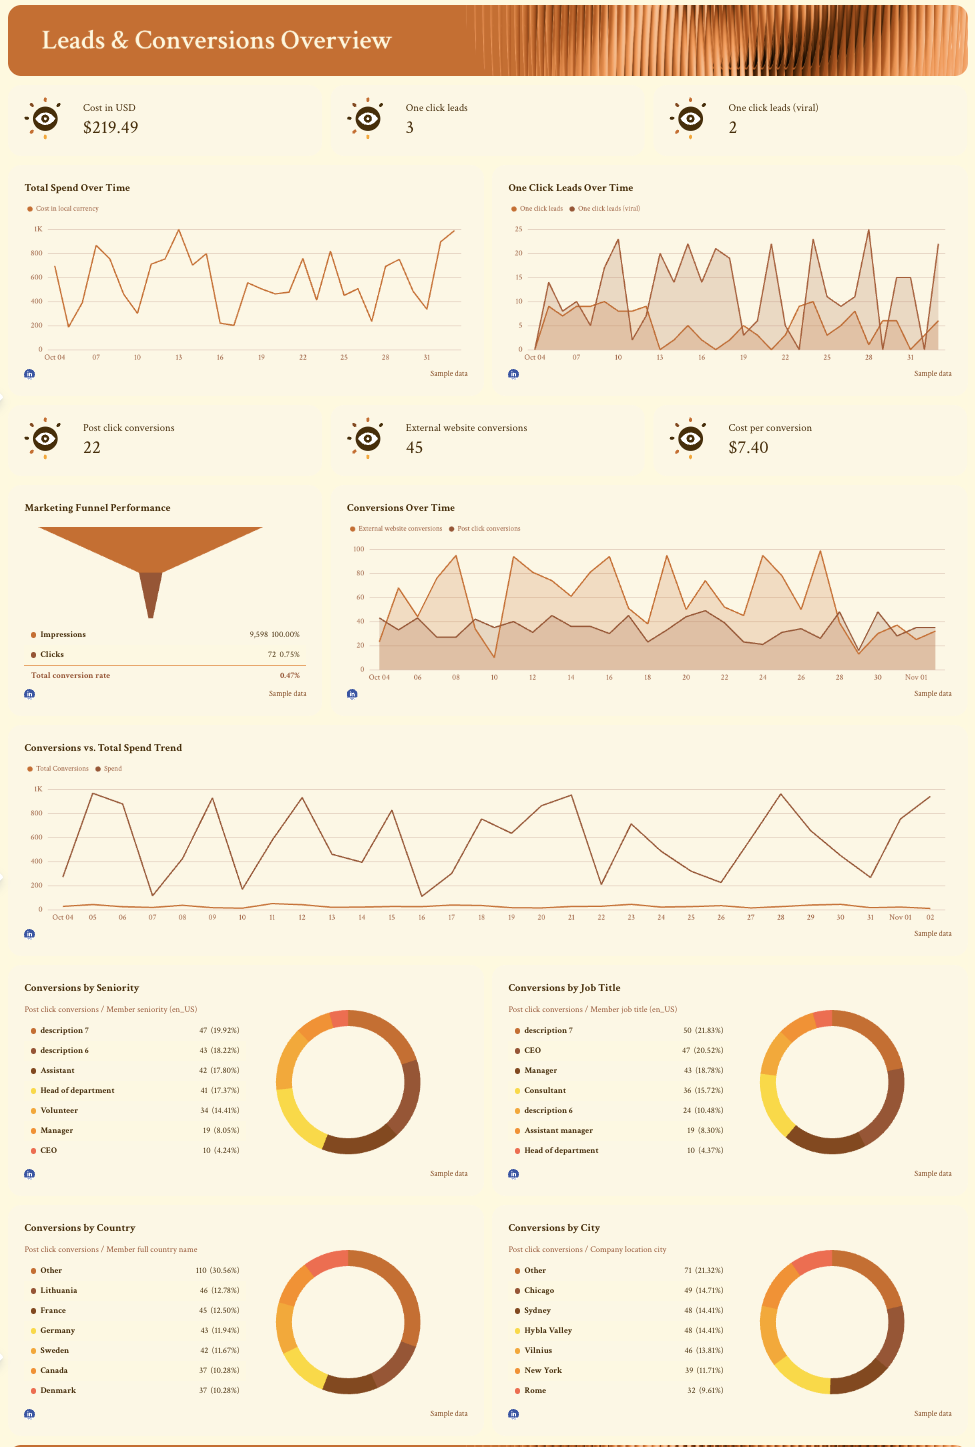
3. Channel-Specific Breakdown: LinkedIn Ads

LinkedIn data gives you deeper insight into lead generation and B2B marketing efforts.

  • Goal widget: Outline specific objectives like form fills or website conversions.
  • Performance summary: Include key metrics such as impressions, clicks, CTR, and spend.
  • Summary and recommendations: Briefly recap results and add improvement suggestions using Whatagraph IQ.
  • Leads and conversions overview: Show the number of one-click leads, post-click conversions, and cost per conversion.
  • Impressions and clicks overview: Display real-time reach, impressions, and clicks to track engagement trends.
  • Campaigns and ads overview: Highlight ad performance by job title, seniority, and audience demographics to understand who’s converting best.
Social Media ROI Report - Dashboard of lead and conversion metrics with charts and graphs

4. Channel-Specific Breakdown: TikTok Ads

TikTok reporting helps visualize content performance and engagement metrics for your video campaigns.

  • Goal widget: Define success based on conversions, reach, or video views.
  • Performance summary: Summarize total spend, impressions, clicks, and conversion rate.
  • Summary and recommendations: Add quick takeaways or AI-generated insights on social media efforts that deliver results.
  • Videos and engagement overview: Measure engagement rate, follower growth, and video-level performance for each campaign.
  • Impressions and clicks overview: Show trends for CTR, CPC, and total reach across your social networks.
  • Purchases and ROI overview: Track conversions, ROAS, and cost efficiency to see which campaigns deliver the best return on investment.
Social Media ROI Report Template - Dashboard displaying charts and tables summarizing purchase data.

Hear What Marketers Are Saying About Whatagraph

Whatagraph's AI is saving so much time and energy for our marketing specialists. We now have more time to focus on strategic things that help both our agency and our clients grow.

Lars Maat

Lars Maat

Co-Founder @ Maatwerk Online

StarStarStarStarStar

Whatagraph took us to the next level with our clients and within our team. Our relationships with clients have been amazing, and we’ve even been able to retain them longer.

Kim Strickland

Kim Strickland

Digital Marketing Specialist @ Peak Seven

StarStarStarStarStar

Whatagraph has become an essential partner for scaling our reporting, and my teams love it because it saves so much time. We’d recommend it to any team looking to automate data reporting and use AI for insights.

Danielle Roberts

Danielle Roberts

Director of Implementation & Support @ Rentable

StarStarStarStarStar

Whatagraph is easy to use, visually attractive, and much smoother compared to tools like Looker Studio.

Stef Oosterik

Stef Oosterik

Quality Manager @ Dtch. Digitals

StarStarStarStarStar

Frequently Asked Questions

Have more questions? We answered them below.

What is social media ROI?

Social media ROI measures how much value your social media marketing generates compared to the amount you spend. It shows whether your social media campaigns are helping you reach your business goals, such as sales, leads, or website traffic.


In Whatagraph, you can track key metrics like revenue, conversion rate, and cost per acquisition (CPA) across all your social media channels. These insights help your marketing team see which efforts deliver the best return on investment — and where there’s room to optimize performance.

What is the average ROI for social media marketing?

The average ROI for social media marketing varies by platform, industry, and campaign goal. 


Typical ROI Benchmarks by Platform


  • Average across all platforms: $5.28 per $1 spent (528% ROI).​ [Source]
  • Facebook Ads (e-commerce): 4.6x median ROI (460%).​ [Source]
  • TikTok: 2.4x average ROAS (240%) for paid campaigns.​ [Source]
  • Influencer Marketing: Up to 18x ROI for top campaigns. [Source]


You can calculate your social media ads ROI using this ROI calculator.

How do you measure ROI on social media?

The easiest way to measure social media ROI is with a social media reporting tool that automatically connects your marketing data and calculates performance for you.


Instead of manually tracking metrics like conversion rate, ad spend, and click-through rate (CTR) in a spreadsheet, tools like Whatagraph pull real-time data from all your social media platforms — Facebook, LinkedIn, TikTok, and more — into one dashboard.


From there, you can see exactly how your social media campaigns contribute to your business goals. You’ll know how much revenue your content generates, which ads deliver the best return on investment, and where to optimize your marketing strategy next.


Check out this guide on the best social media analytics tools to measure ROI.