PPC Calculator for ROI
- •Increase budget for top-performing campaigns
- •Bid on high-performing related keywords
- •Fix underperforming ads and landing pages
- •Test new platforms and retargeting
How to use this PPC calculator
Step 1. Choose your PPC channel.
Select from the most popular channels like Google Ads, Meta Ads, and LinkedIn Ads. Or, choose “All Channels” if you want the total ROI value.
Step 2. Input your campaign data.
Drag and pull the sliders to add your numbers for “Ad spend”, “Number of conversions”, and “Average conversion value”.
Step 3. Get your PPC ROI value.
See your return on ad spend and compare it with industry benchmarks. Get recommendations for the next best actions to take.
How to track PPC metrics on Whatagraph
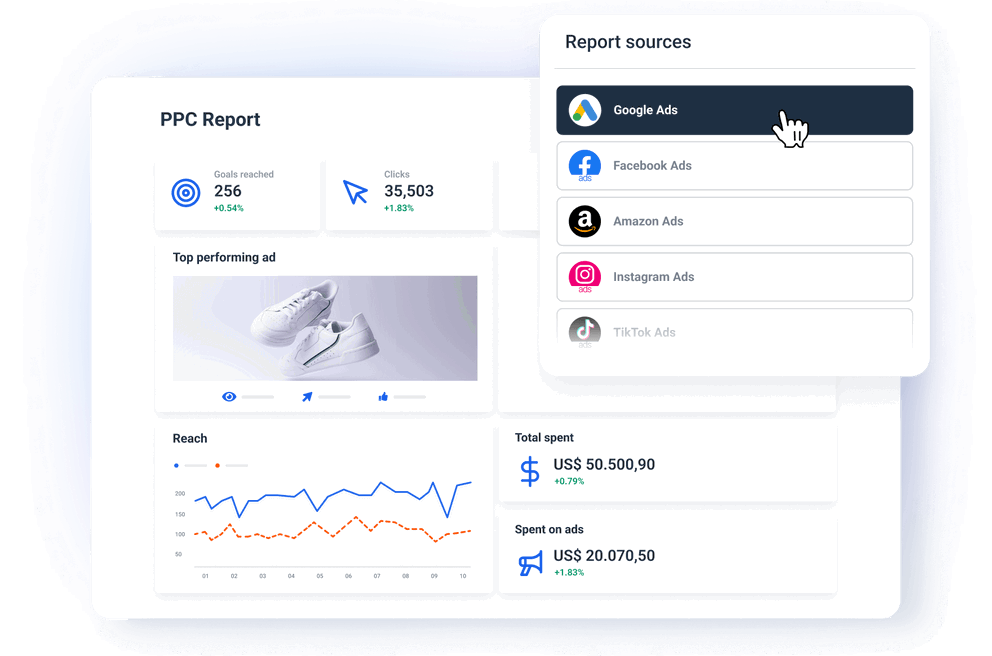
Connect your PPC channels
Bring data from all your PPC channels—Google Ads, Meta Ads, LinkedIn Ads and more—into one platform.
Track performance under one roof instead of jumping from one tool to another.
No need for external connectors. And you’ll always see accurate and up-to-date data on your reports.
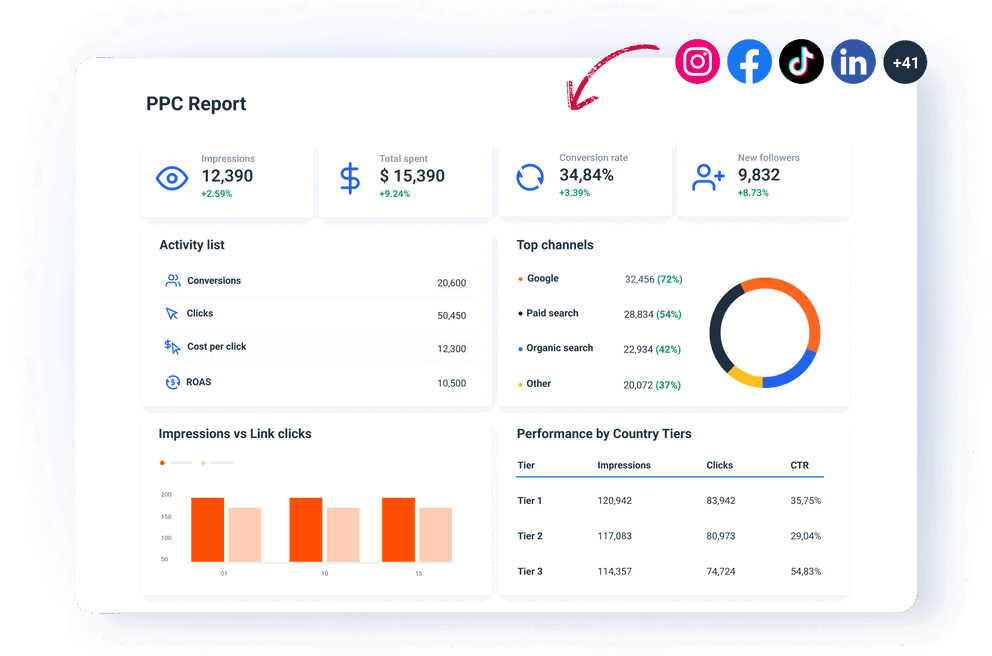
Organize your PPC advertising data
Have confusing ad campaign names, metric names, and dimensions? Standardize them into clear formats and keep reports neat and tidy.
Blend cross-channel data (e.g. Google Ads + Meta Ads) to see the total results of your PPC campaigns.
No coding needed. And no limits to how many data blends you can make.
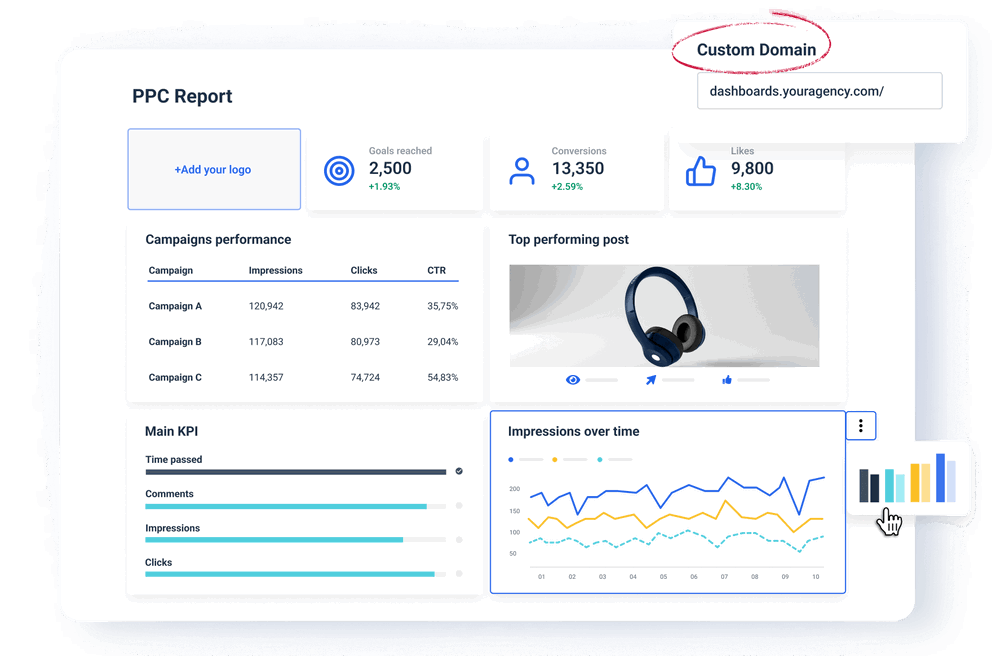
Visualize your data
Create client-facing reports in minutes using PPC report templates or drag-and-drop widgets.
Customize them with your company or client’s logo, color themes, and domains.
Create internal performance monitoring dashboards and see which KPIs are trending up or down at all times—and take action, fast.
Ask AI for insights and summaries
Want to get a quick snapshot of how your PPC campaigns are performing?
Just ask our AI chatbot any questions you want, choose the data source and date range, and it will give you succinct summaries.
Ask AI to write out performance summaries and add them to your reports. Edit what it wrote to for that human touch.

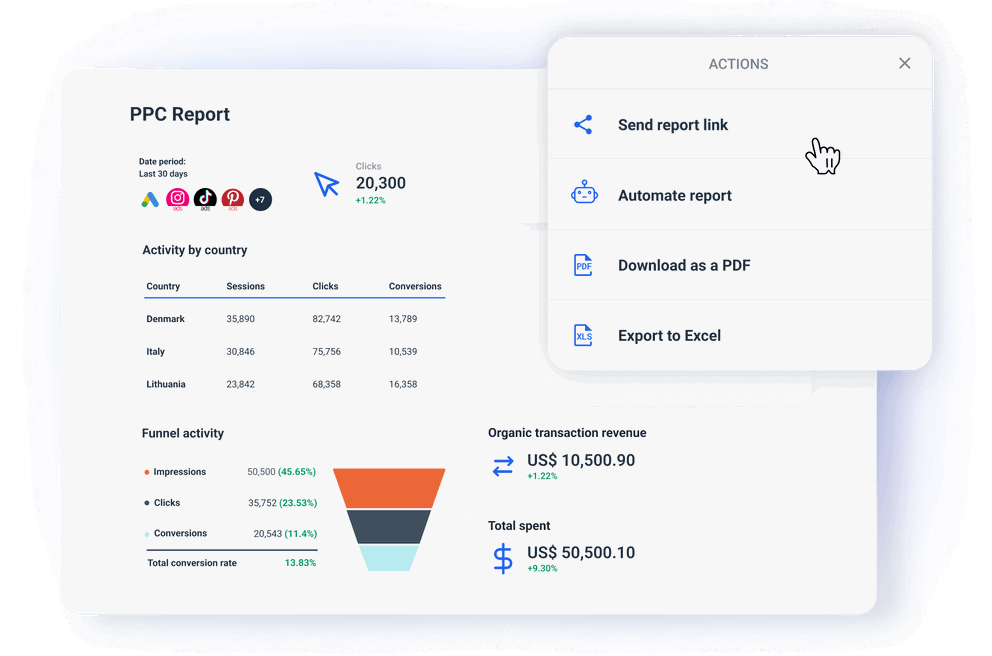
Share data and reports your way
Put reporting on auto-pilot with Whatagraph.
Schedule fully-branded, automated emails that go out every week or month. Share live links to reports or export to PDF and Excel.
Ship your data to BigQuery or Looker Studio automatically through Whatagraph.
Explore PPC report templates


Frequently Asked Questions
What is a PPC ROI calculator?
A PPC ROI calculator is a simple tool that helps you quickly measure the return on investment (ROI) of your pay-per-click campaigns.
It takes your ad spend, number of conversions, and average conversion value to calculate how effectively your campaigns are generating revenue.
How does a PPC ROI calculator work?
Our PPC ROI calculator is designed to make calculating your campaign performance quick and easy:
1. Select your advertising channel: Choose from Google Ads, Meta Ads, LinkedIn Ads, or all channels combined to set the right industry benchmark.
2. Input your campaign data: Use sliders to enter your ad spend, number of conversions, and average conversion value.
3. Instant ROI calculation: The calculator uses a formula to return the ROI value from your PPC campaigns.
4. Compare against benchmarks: See if your ROI is below, within, or above industry standards based on your selected channel.
5. Get actionable insights: Depending on your performance, receive tailored recommendations to improve or scale your PPC strategy.
How do you calculate PPC ROI?
PPC ROI (Return on Investment) tells you how much profit you make from your ad spend. Here's how to calculate it:
1. Gather your campaign data:
- Ad Spend: The total amount you've spent on your PPC ads.
- Number of Conversions: The total number of actions (e.g., sales, sign-ups) generated by your ads.
- Average Conversion Value: The average revenue generated per conversion.
2. Use the ROI formula:
ROI (%) = ( Revenue from Ads - Ad Spend / Ad Spend ) x 100
For example, if you spent $1,000 on ads, generated 193 conversions, and your average conversion value is $50:
ROI = ((193 x 50) - 1000) / 1000 ) x 100 = 865%
3. Interpret your results:
- Positive ROI: You’re making more than you’re spending—great!
- Negative ROI: Your campaign costs exceed the revenue generated—time to optimize.
4. Benchmark against industry standards:
Compare your ROI to industry benchmarks (e.g., Google Ads: 200%–250%, Meta Ads: 400%–800%) to gauge performance.
What is a good conversion rate for PPC campaigns?
A "good" conversion rate for PPC campaigns varies by industry and by channel, reflecting different customer behaviors and purchase processes.
As of 2024, here are the average conversion rates for each channel:
- Google Ads: 6.96% (Source)
- Facebook Ads: 9.21% (Source)
- LinkedIn Ads: between 5% and 15% (Source)
- Amazon Ads: 9.72% (Source)
It's important to note that these figures are “averages”; what makes a "good" conversion rate depend on various factors, including your specific business model, target audience, and digital marketing objectives.
How can a PPC calculator help optimize my ad spend?
A PPC calculator helps you optimize your ad spend by providing quick, data-driven insights:
Identify high-performing campaigns: See which channels (e.g., Google Ads, Meta Ads, LinkedIn Ads) deliver the best ROI, so you know where to allocate more budget.
Ad budget allocation: Test different ad spend scenarios to find the sweet spot between cost and conversions.
Predict ROI: Quickly calculate potential returns before committing to a campaign, reducing financial risk.
Set realistic goals: Use industry benchmarks to understand what “good” performance looks like and adjust your strategy accordingly.
Save time: Eliminate manual calculations and get instant insights to make faster, more informed decisions.
With our calculator, you’ll not only see your ROAS but also get actionable tips to fine-tune your marketing campaigns—whether you're over- or underperforming.
How to set a budget for a pay-per-click campaign?
Setting an effective PPC budget involves strategic planning and analysis. Here are several approaches marketers use:
1. Percentage-of-Sales Method:
Allocate a Fixed Percentage: Dedicate a set portion of your projected sales revenue to your PPC budget. This ensures spending aligns with business performance.
2. Objective and Task Method:
Define Clear Objectives: Determine specific goals for your PPC campaign.
Estimate Costs: Calculate the expenses required to achieve these objectives.
Set Budget Accordingly: Base your budget on the total estimated costs to meet your goals.
3. Competitive Parity Method:
Analyze Competitor Spending: Research how much competitors are investing in PPC.
Match or Adjust: Set your budget to match or strategically differ based on your positioning and objectives.
4. Historical Data Analysis:
Review Past Campaigns: Examine previous PPC performance to identify what worked.
Allocate Based on Success: Invest more in high-performing keywords and adjust spending on underperforming ones.
5. Channel-Specific Allocation:
Diversify Across Platforms: Distribute your budget across various channels (e.g., Google Ads, Meta Ads) based on where your audience is most active.
Monitor and Adjust: Continuously track performance metrics and reallocate funds to maximize ROI.
6. Seasonality and Trend Consideration:
Identify Peak Periods: Recognize times of the year when demand for your product or service increases.
Adjust Budget Accordingly: Increase spending during high-demand periods and scale back during slower times.
What are the key metrics to track for PPC campaigns?
Here are some crucial ones:
Total Cost: Tracks the total amount spent on your PPC campaigns.
Total Revenue: Measures the total income generated from your PPC efforts.
Click-Through Rate (CTR): Shows how effective your ad is at getting clicks.
Conversion Rate: Measures how well clicks turn into desired actions (e.g., sales, sign-ups).
Cost Per Click (CPC): Helps manage your budget by tracking what you pay per click.
Cost Per Conversion (CPA): Shows how much it costs to acquire a lead or customer.
Quality Score: Affects ad rankings and costs by measuring ad and keyword relevance.
Impressions: Indicates how often your ad is displayed, reflecting its reach.
Return on Ad Spend (ROAS): Measures revenue generated for every ad dollar spent.
Bounce Rate: Highlights if users leave quickly, pointing to landing page issues.
Average Position: Shows where your ad appears in search results, affecting visibility.