


What does a social media dashboard look like?
Honestly, there’s no single version of a “perfect” social media dashboard. What it looks like depends entirely on who it’s for and what they need from it.
A social media manager working in-house might need a detailed social media engagement dashboard that helps them dive deep into post performance, track engagement trends over time, and compare results across campaigns.
Their dashboard might include:
- Platform-by-platform breakdowns
- Post-level stats
- Goal tracking
- Audience insights
- Multiple filters for experimenting with different views
On the other hand, an agency presenting results to clients will often take a very different approach.
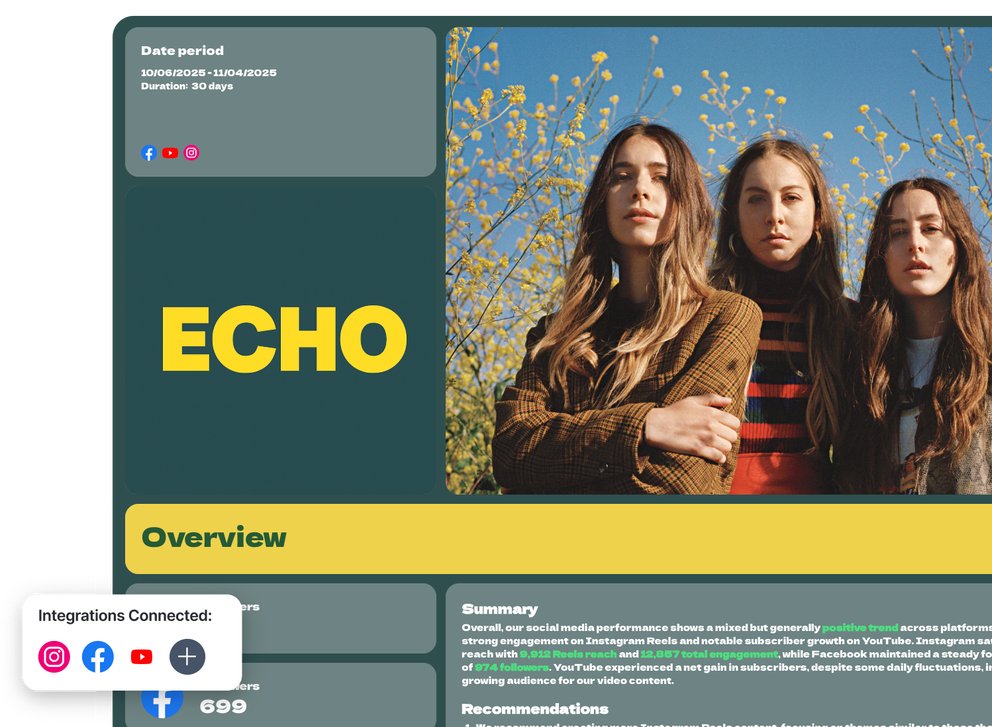
Their dashboard might be simplified—focused on high-level KPIs like engagement rate, reach, and follower growth. Instead of overwhelming clients with raw data, they’ll highlight outcomes, include branded visuals, and add commentary that explains what the numbers mean.
Even within the same team, the format and layout can shift depending on the stakeholder.
Executives typically want a snapshot: “Are we growing?” “What’s driving results?” “Are we seeing ROI?” Analysts might want every variable broken down by channel, content type, or geography.
The good news is that with Whatagraph, your social media performance dashboard doesn’t have to be one-size-fits-all.
You can:
- Create client-facing reports with ready-made templates or drag-and-drop widgets
- Build internal social media monitoring dashboards for your Account Managers
- Brand everything with your (or your client’s) logos, colors, and even custom domains
 Still, while every dashboard is unique, the best ones usually include a few core building blocks that turn raw metrics into meaningful, easy-to-understand insights.
Here’s what those components look like—and why they matter:
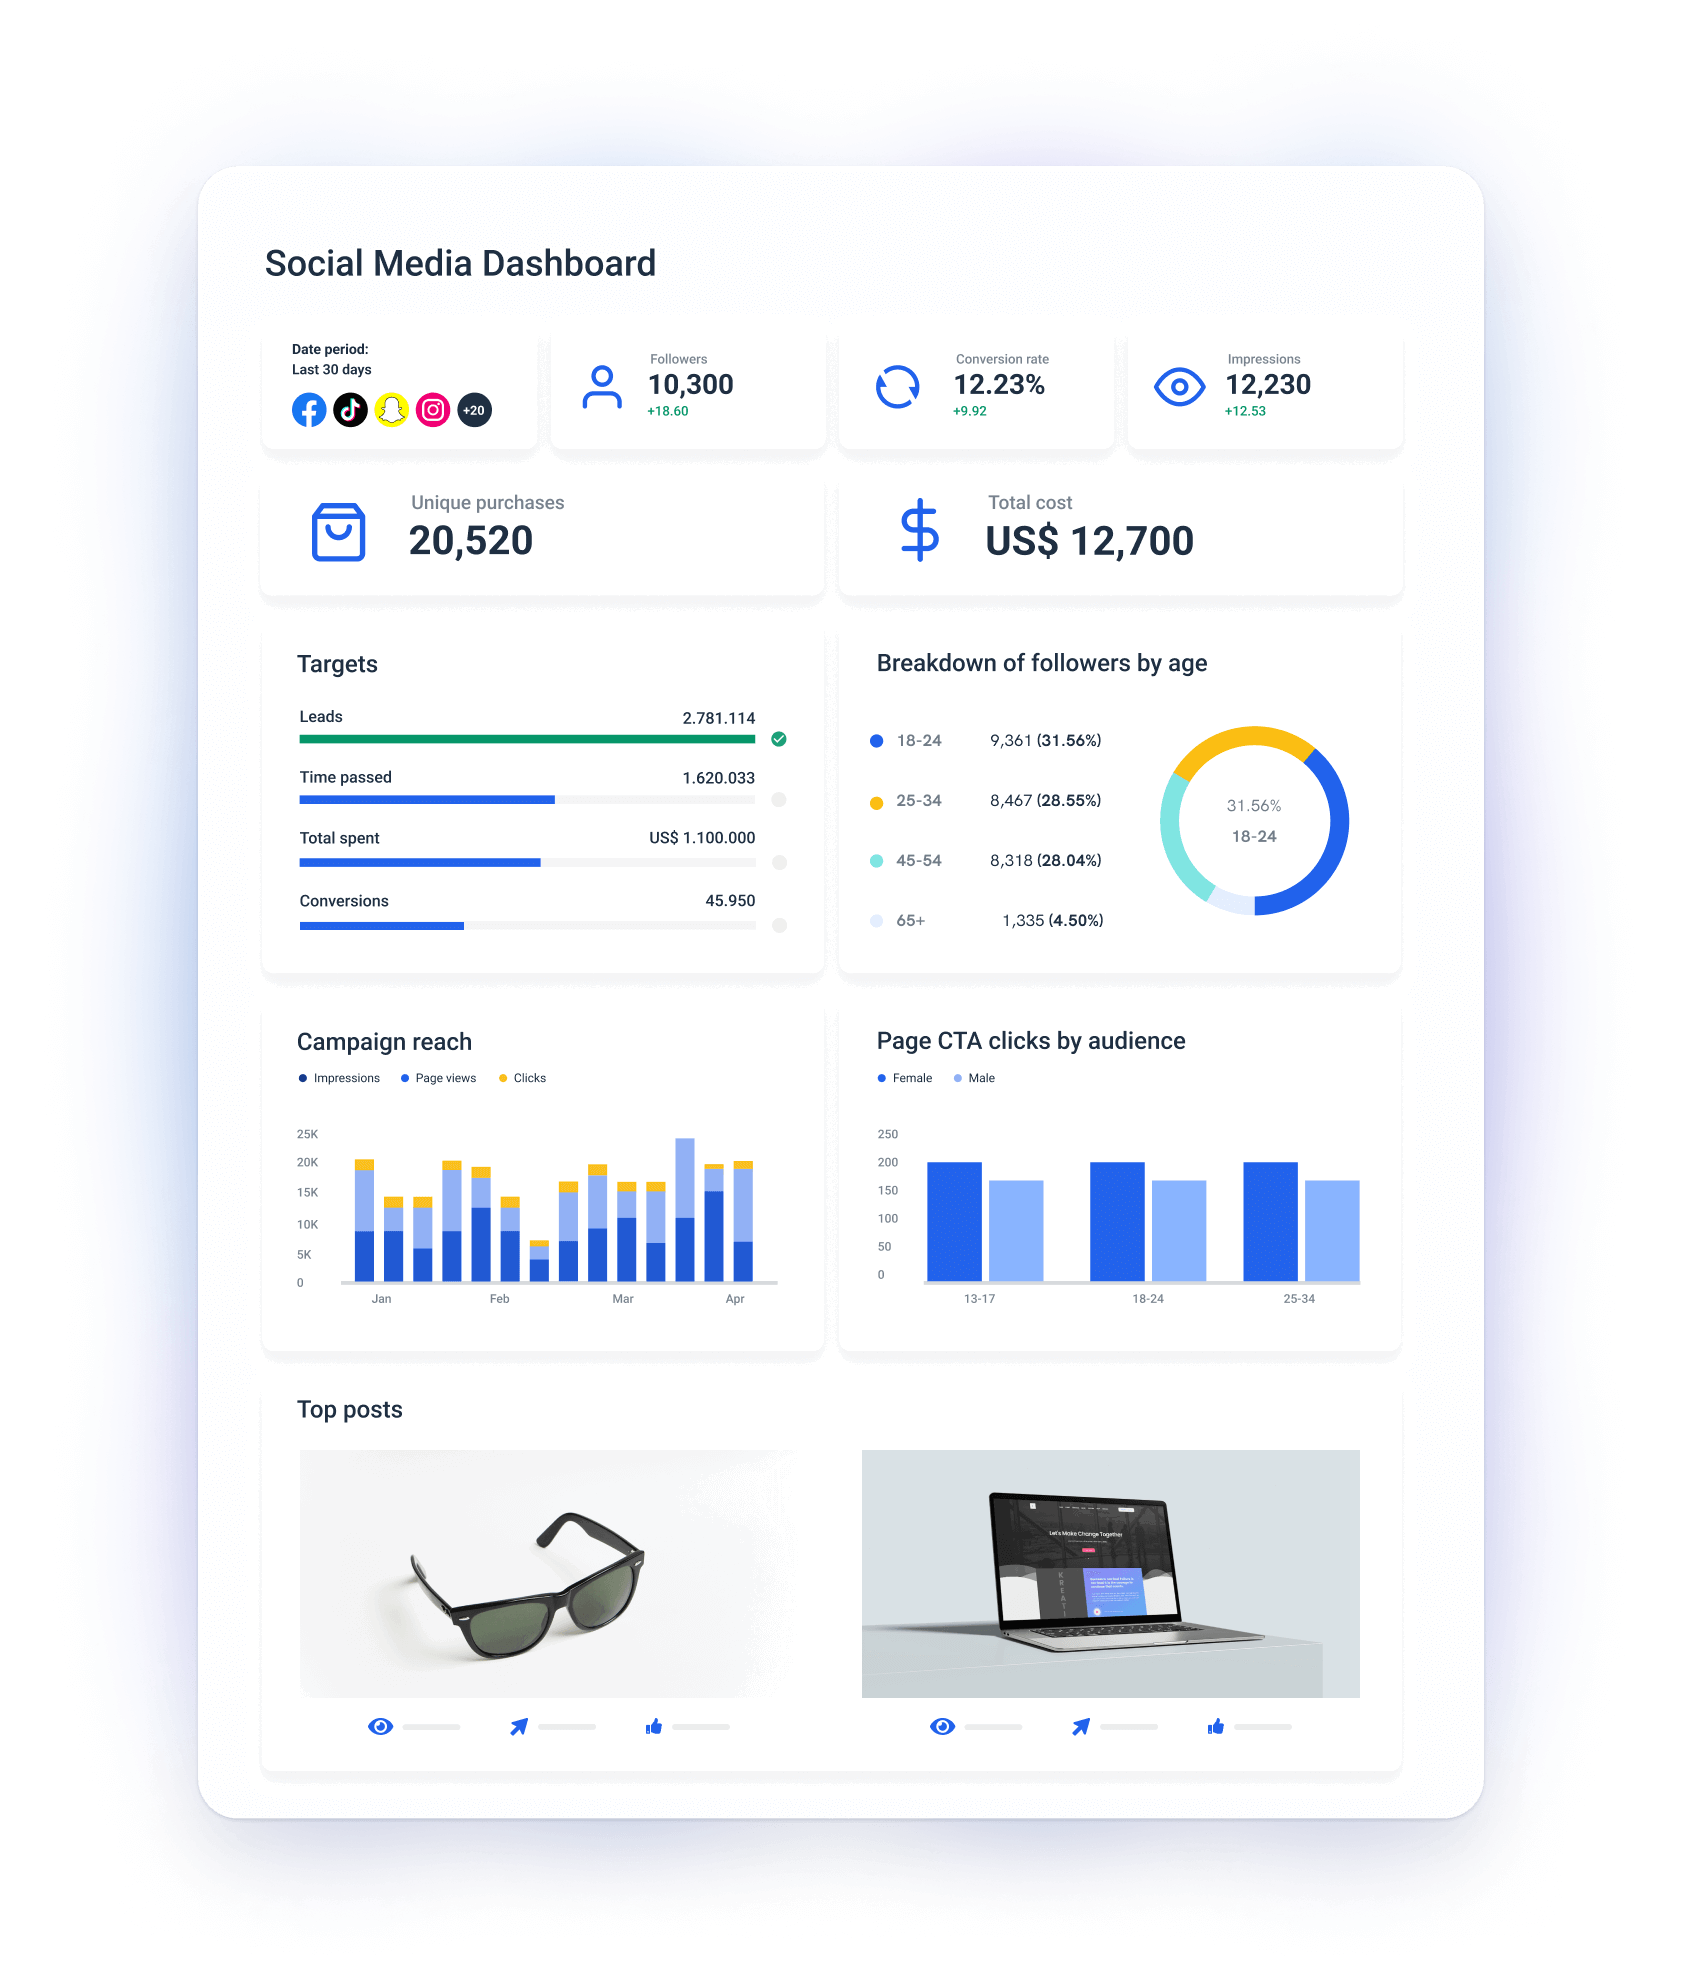
1. Top-level KPIs at a glance
This is your snapshot of overall performance. Think: follower count growth, engagement rate, reach, impressions, and post frequency.
Why it matters:
Busy teams and clients want answers fast. These headline numbers give instant clarity on how your social presence is trending—without having to dig.
2. Platform-by-platform breakdown
Side-by-side comparisons of each channel: Instagram vs. Facebook vs. LinkedIn vs. TikTok.
Why it matters:
Not all platforms perform the same. This view helps identify which channels are driving results—and where to pivot or double down.
3. Post-level performance
A detailed view of how individual posts performed: likes, shares, comments, reach, saves, CTR.
Why it matters:
Helps social media managers and content teams understand what resonates with the audience and which formats/content types are working.
4. Trend graphs and charts
Line charts, bar graphs, or heatmaps that show how engagement, reach, or follower growth has changed over time.
Why it matters:
Visualizing performance over days, weeks, or months makes it easier to spot trends, seasonality, or sudden spikes—and link them back to specific campaigns or content types.
5. Goals and target tracking
Widgets that show whether you’re on track to hit defined goals—like monthly reach targets or engagement benchmarks.
Why it matters:
Whether you're reporting to clients or execs, it’s not just about performance—it’s about progress toward specific business objectives.
6. Audience insights
Breakdowns by demographics (age, gender), geography, device type, or language.
Why it matters:
Understanding who you're reaching helps shape your content and targeting strategies. It also helps clients or stakeholders see if you're reaching the right audience.
7. Commentary or insights sections
Optional text boxes to add context: explain performance shifts, highlight wins, or flag issues.
Why it matters:
Numbers alone don’t tell the full story. Commentary turns metrics into meaning, making your dashboard more valuable and actionable for non-technical viewers.
8. Visual customization
Your dashboard’s look and feel—logos, colors, font styles, and layout options.
Why it matters:
For agencies and brands alike, polished, on-brand dashboards improve readability and look far more professional than a standard spreadsheet or export.
How do I create a social media dashboard?
Creating a social media analytics dashboard from scratch can feel overwhelming—especially when you're managing multiple platforms, tracking engagement metrics, and trying to prove ROI to stakeholders.
But with Whatagraph’s social media analytics dashboard template, the process is fast, flexible, and zero-stress.
Here’s how to do it.
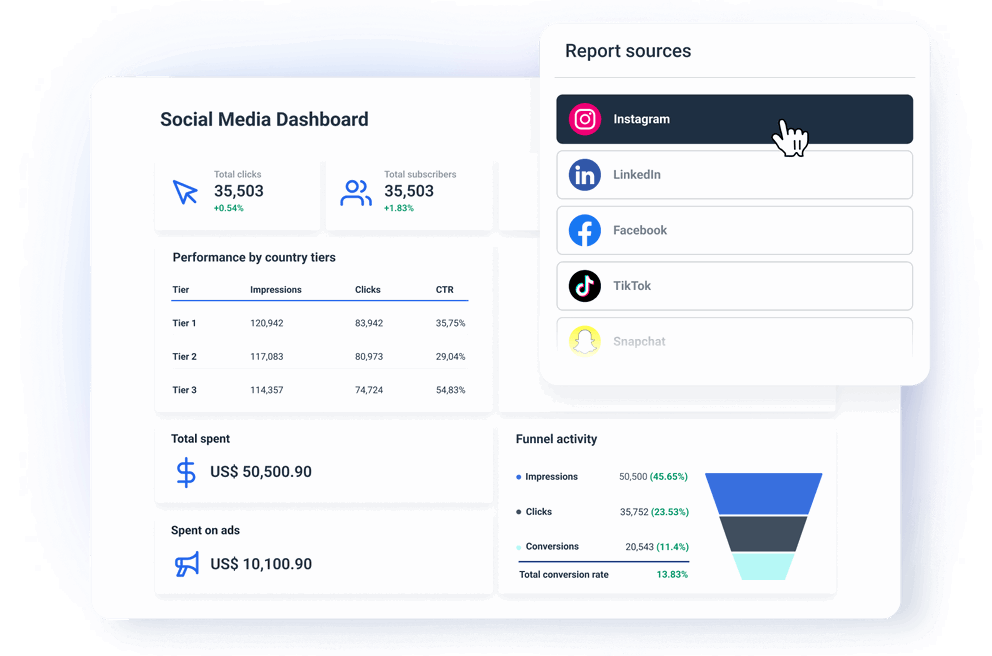
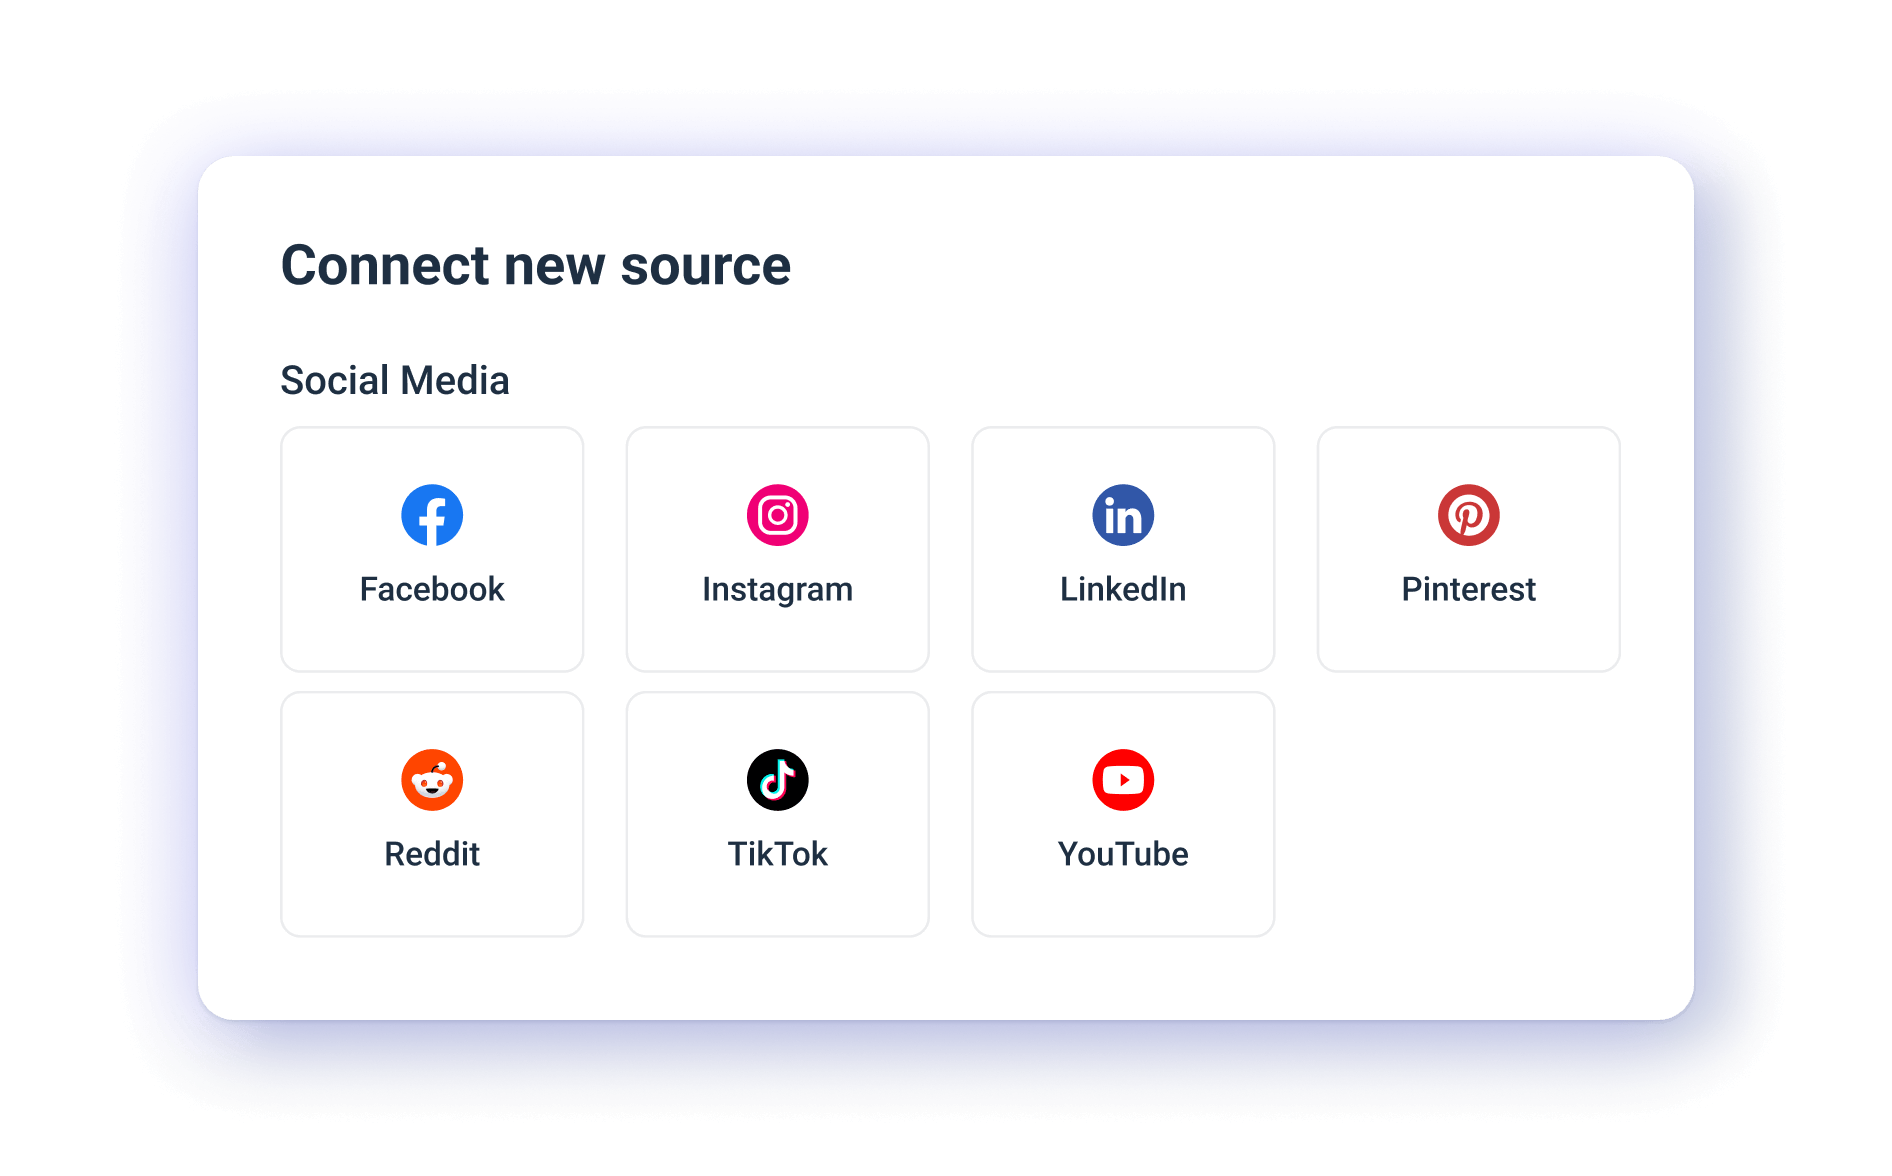
1. Connect your social media accounts
Start by connecting the social media platforms you want to report on—Instagram, Facebook, LinkedIn, TikTok, Twitter, and more.
Just choose your data source in Whatagraph’s dashboard, authenticate with your login, and you’re done.
Once connected, Whatagraph automatically pulls in your performance data and keeps it updated—no coding, no third-party tools, no manual exports.
You can also bring in data from 55+ marketing channels like:
- PPC: LinkedIn Ads, Google Ads, Facebook Ads
- Social media: Facebook, Instagram, TikTok
- e-Commerce: Shopify, BigCommerce, Magento
- SEO: Ahrefs, SE Ranking, Semrush
- Analytics: Google Analytics 4, Matomo, Piwik Pro
- Email marketing: ActiveCampaign, Mailchimp, Constant Contact
This makes it easy to build a holistic view of your marketing and social media campaign performance.
Our native integrations are highly stable and reliable, and our platform has a 99.95% uptime during the past 6 months.
And if there’s ever an issue, our team is on it within minutes (even if it’s 3am).
2. Organize and clean up your data
Once your data is flowing in, it’s time to make sense of it.
Social media data tends to be fragmented—different naming conventions, metric definitions, or currencies across platforms.
Whatagraph helps you standardize and structure your data so that it’s actually readable and usable:
- Unify naming conventions for KPIs like “Reach” or “Engagement Rate”
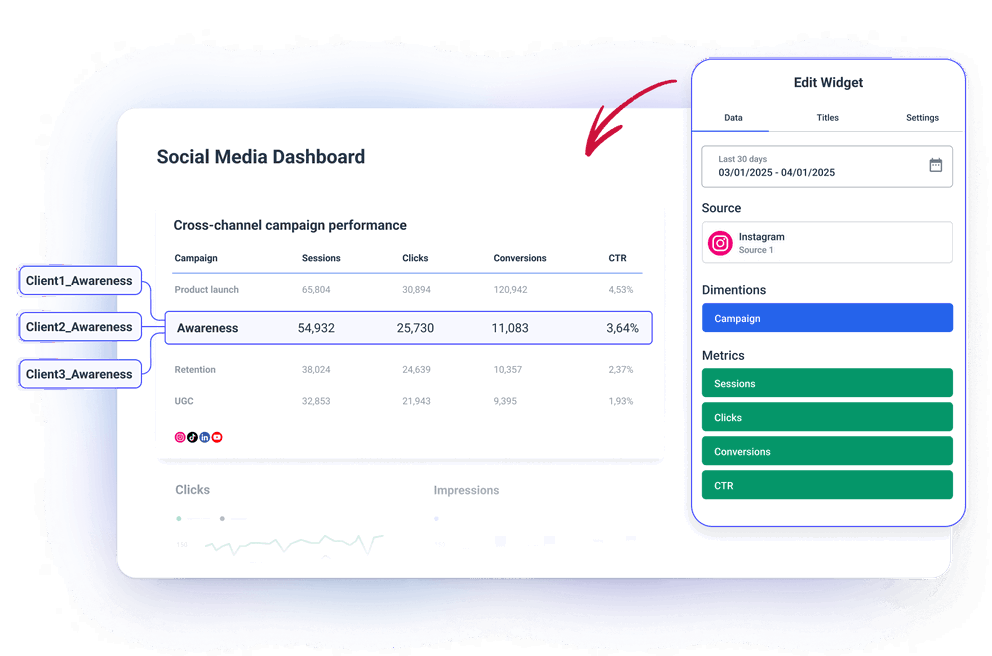
- Standardize campaign names like “Retargeting”
- Blend data from multiple platforms to show total audience growth or cross-platform ROI
- Create custom calculations that reflect how your team or clients define success
- Break down data by custom tags like “Client A”, “Account Manager A”, or “Location A”
This step saves you from misleading or inconsistent metrics, and reduces the hours you’d normally spend cleaning up spreadsheets.
3. Choose a report template or build your own
Now comes the fun part: designing your dashboard.
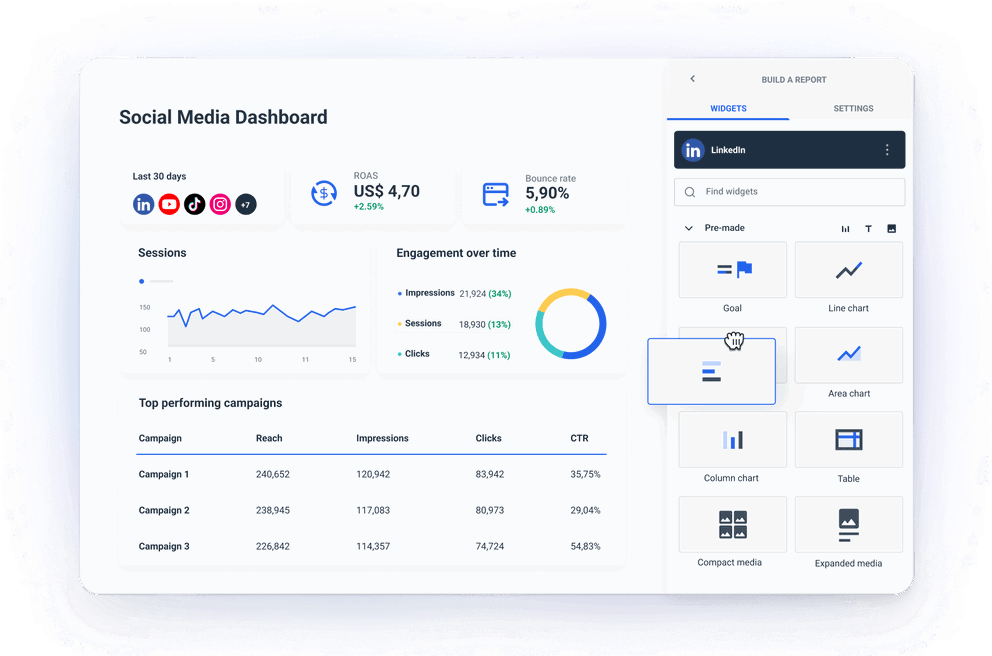
You can either start from one of Whatagraph’s pre-built social media dashboard templates, or build your own layout from scratch using our drag-and-drop editor.
Templates come with common KPIs baked in—like followers, engagement rate, impressions, CTR, and content performance—laid out in a clean, visual format.
Want to make a custom report or dashboard? It’s super easy on Whatagraph. You can:
- Add your logo or your client’s
- Set your own color palette and fonts
- Include branded headers and section dividers
- Pick icons from the icon library or upload your own
- Rearrange layouts or widgets with zero coding
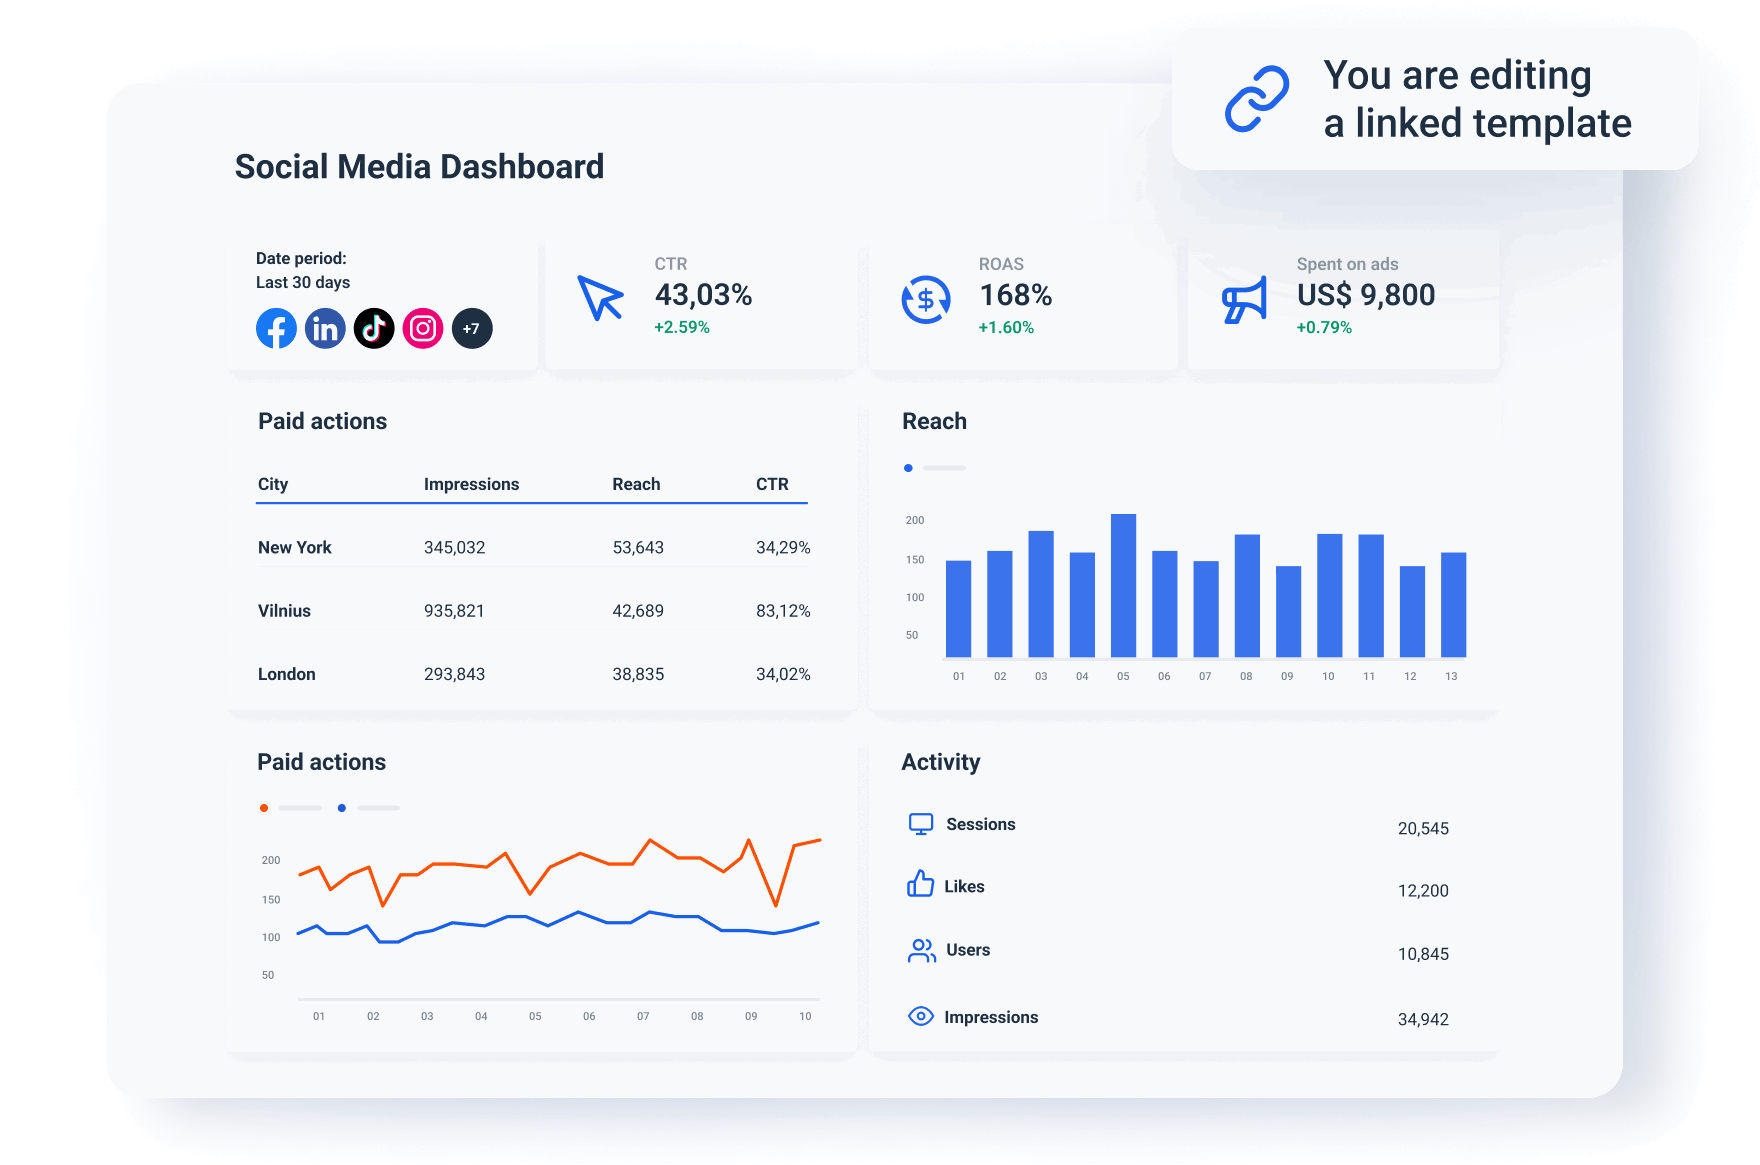
And if you manage multiple brands or clients, you can create a “master” template and link all client reports to it.
Then, if you want to make changes, you can just edit the master template, and all reports linked to it will be changed automatically. This can save you hours of work and headache to edit reports.
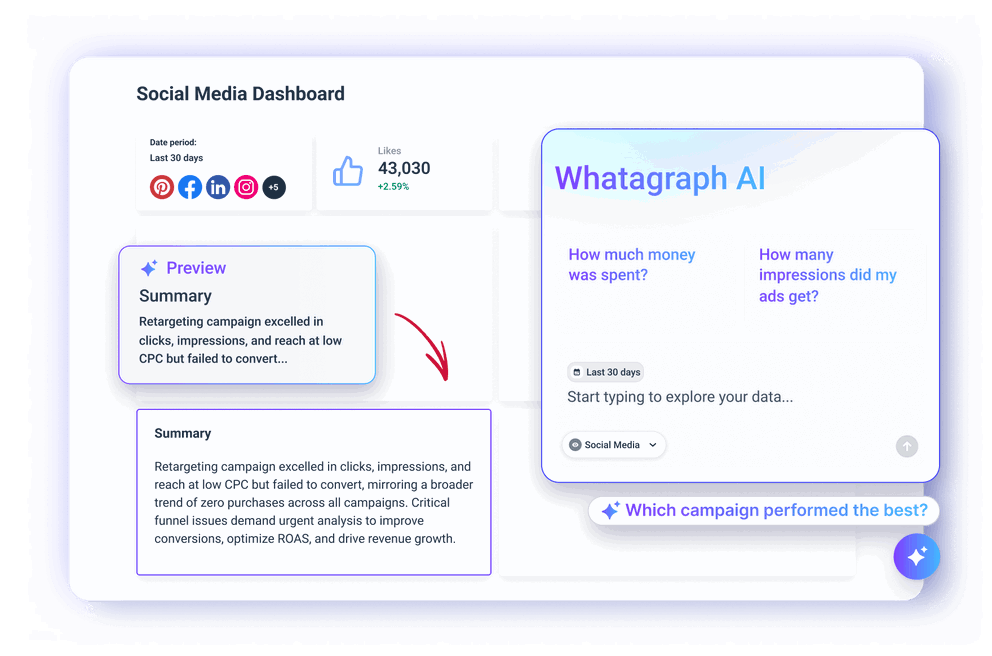
4. Ask AI to summarize performance
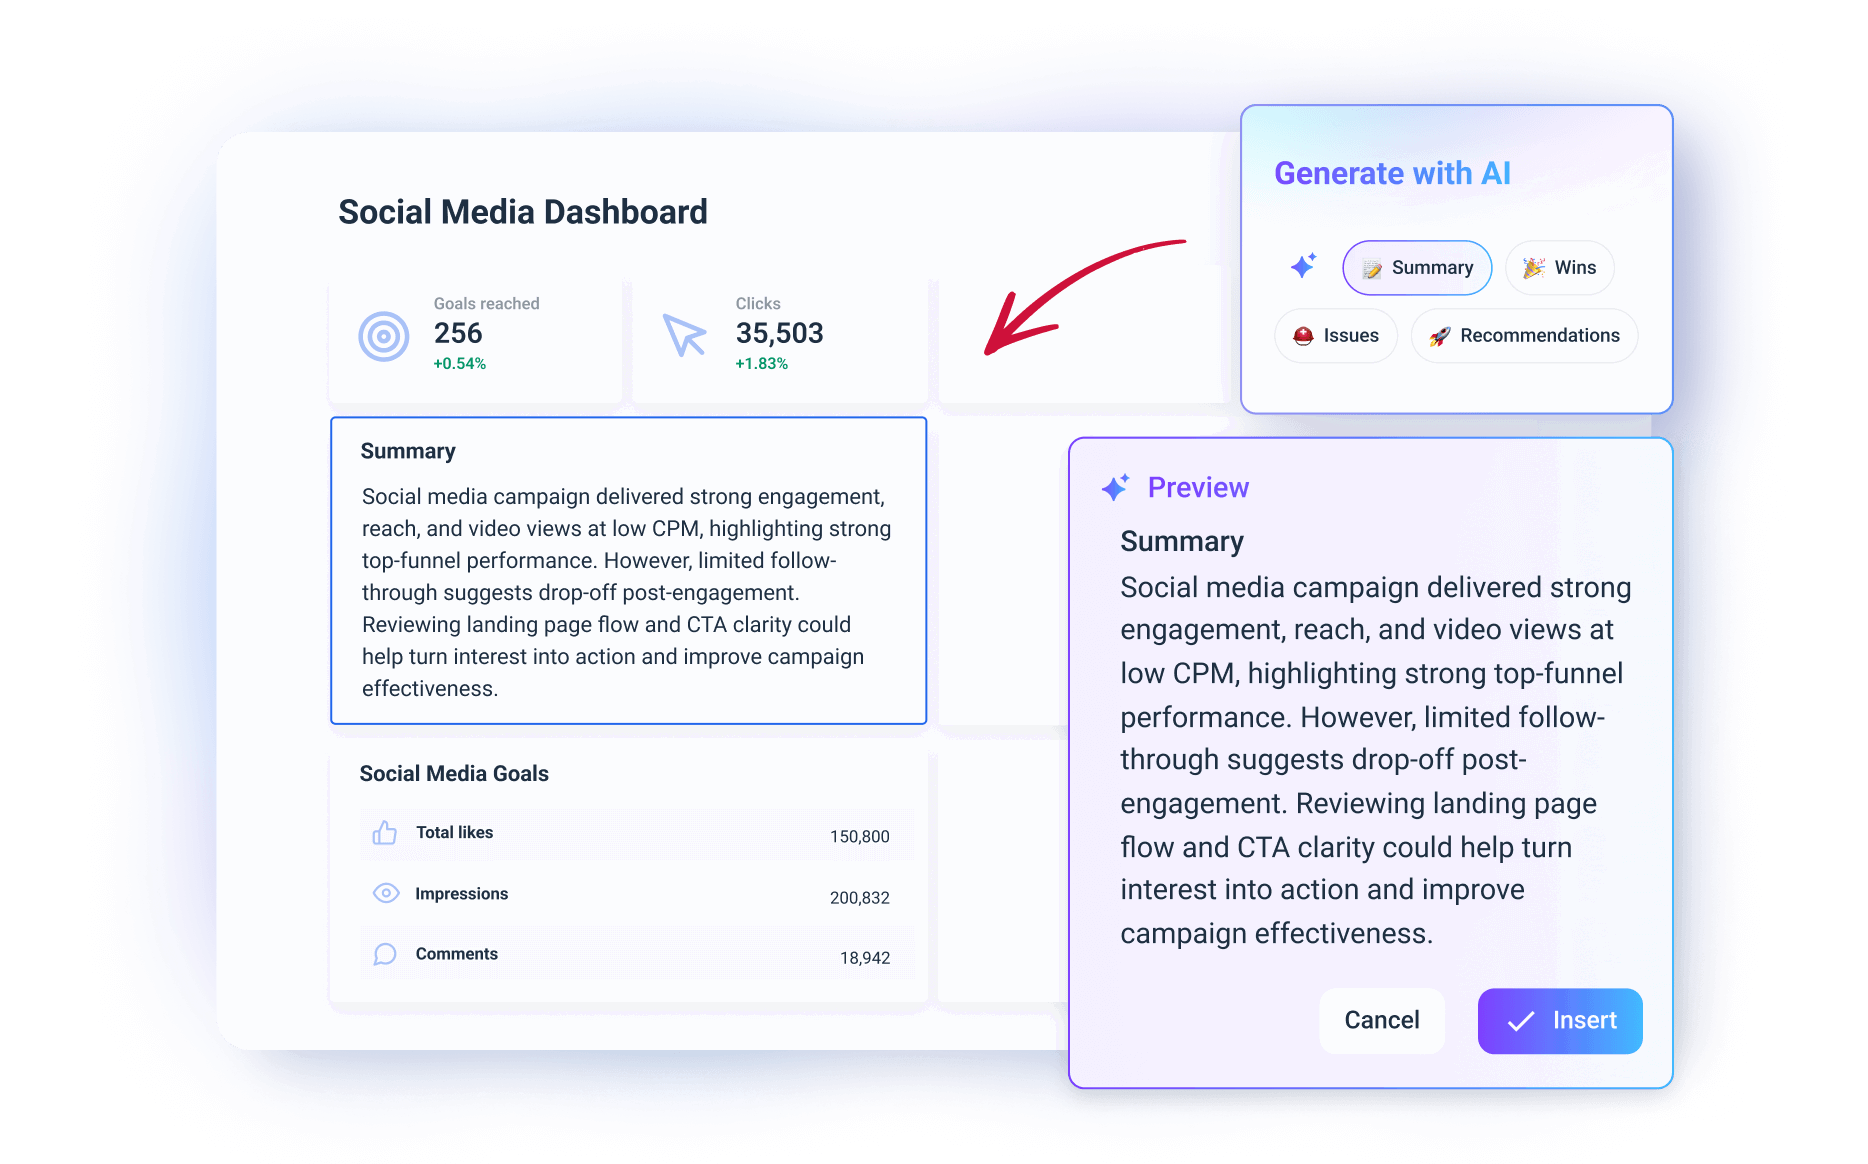
Your clients don’t want to interpret 30 charts—they want to know what happened, why it matters, and what to do next. Whatagraph makes that easy with built-in AI writing tools.
You can:
- Add a text widget and let AI summarize the performance automatically
- Choose short or long summaries
- Select a reporting period and platform (e.g. LinkedIn for the past 7 days)
- Instantly get a clean, editable write-up of performance trends, wins, and insights
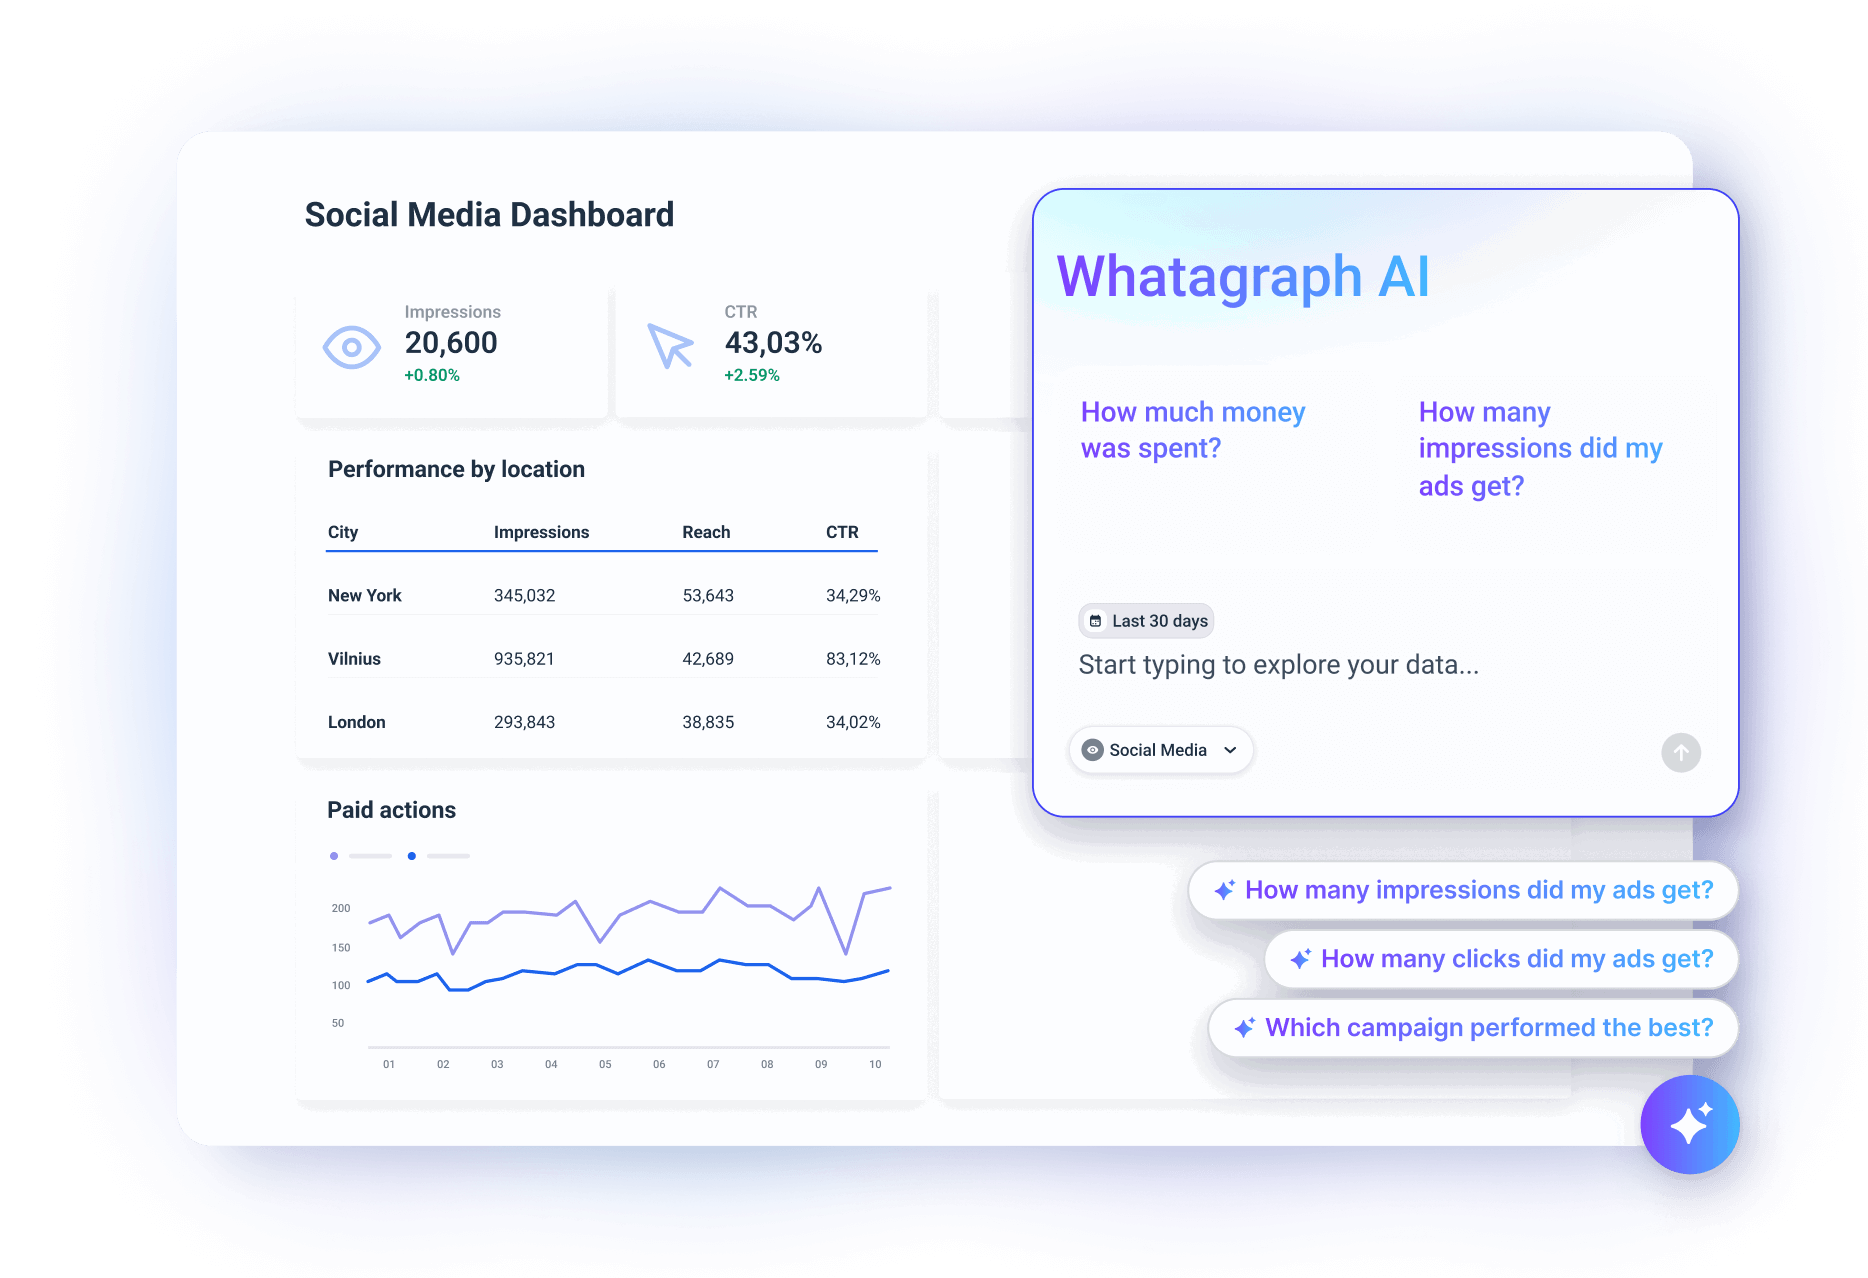
 Need to answer an ad-hoc question from your client or exec? You can simply ask our AI chatbot the question and it’ll analyze your real data and respond in seconds.
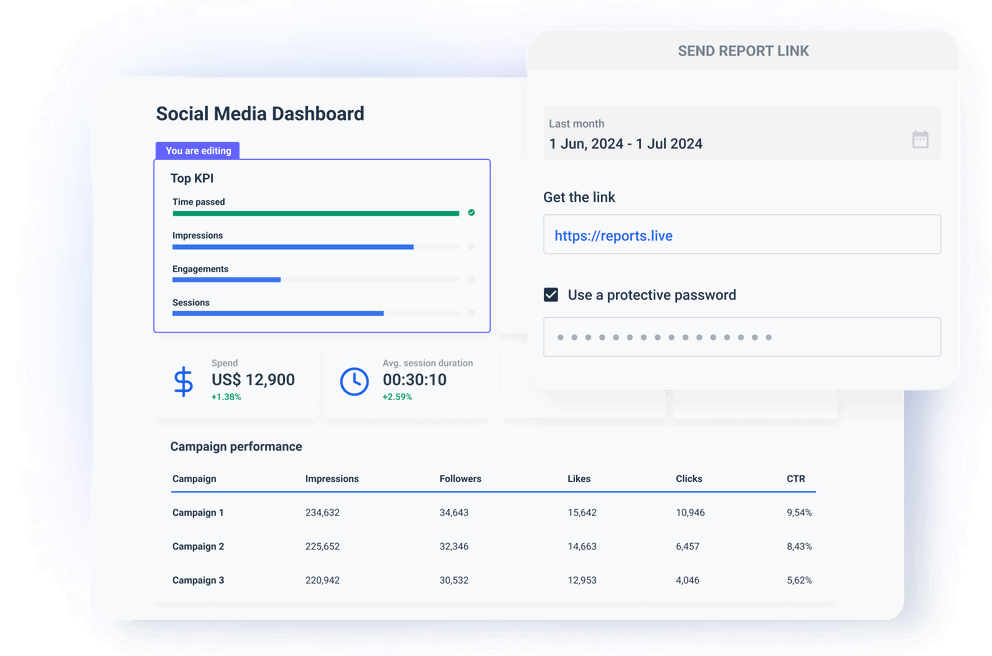
5. Share your dashboard
Once your dashboard is ready, it’s time to deliver it.
Whatagraph offers flexible sharing options to match how your team or clients like to receive reports:
- Schedule automated emails — Set up recurring weekly or monthly reports with full white-labeling
- Send live dashboard links — Clients can view up-to-date performance any time, in-browser
- Export to PDF or CSV — Perfect for internal sharing or presentations
- Push to BigQuery or Looker Studio — If you want to build more complex BI reporting layers
6. Monitor KPIs on an internal dashboard
Reporting to clients is essential, but what about managing your own campaigns in real time?
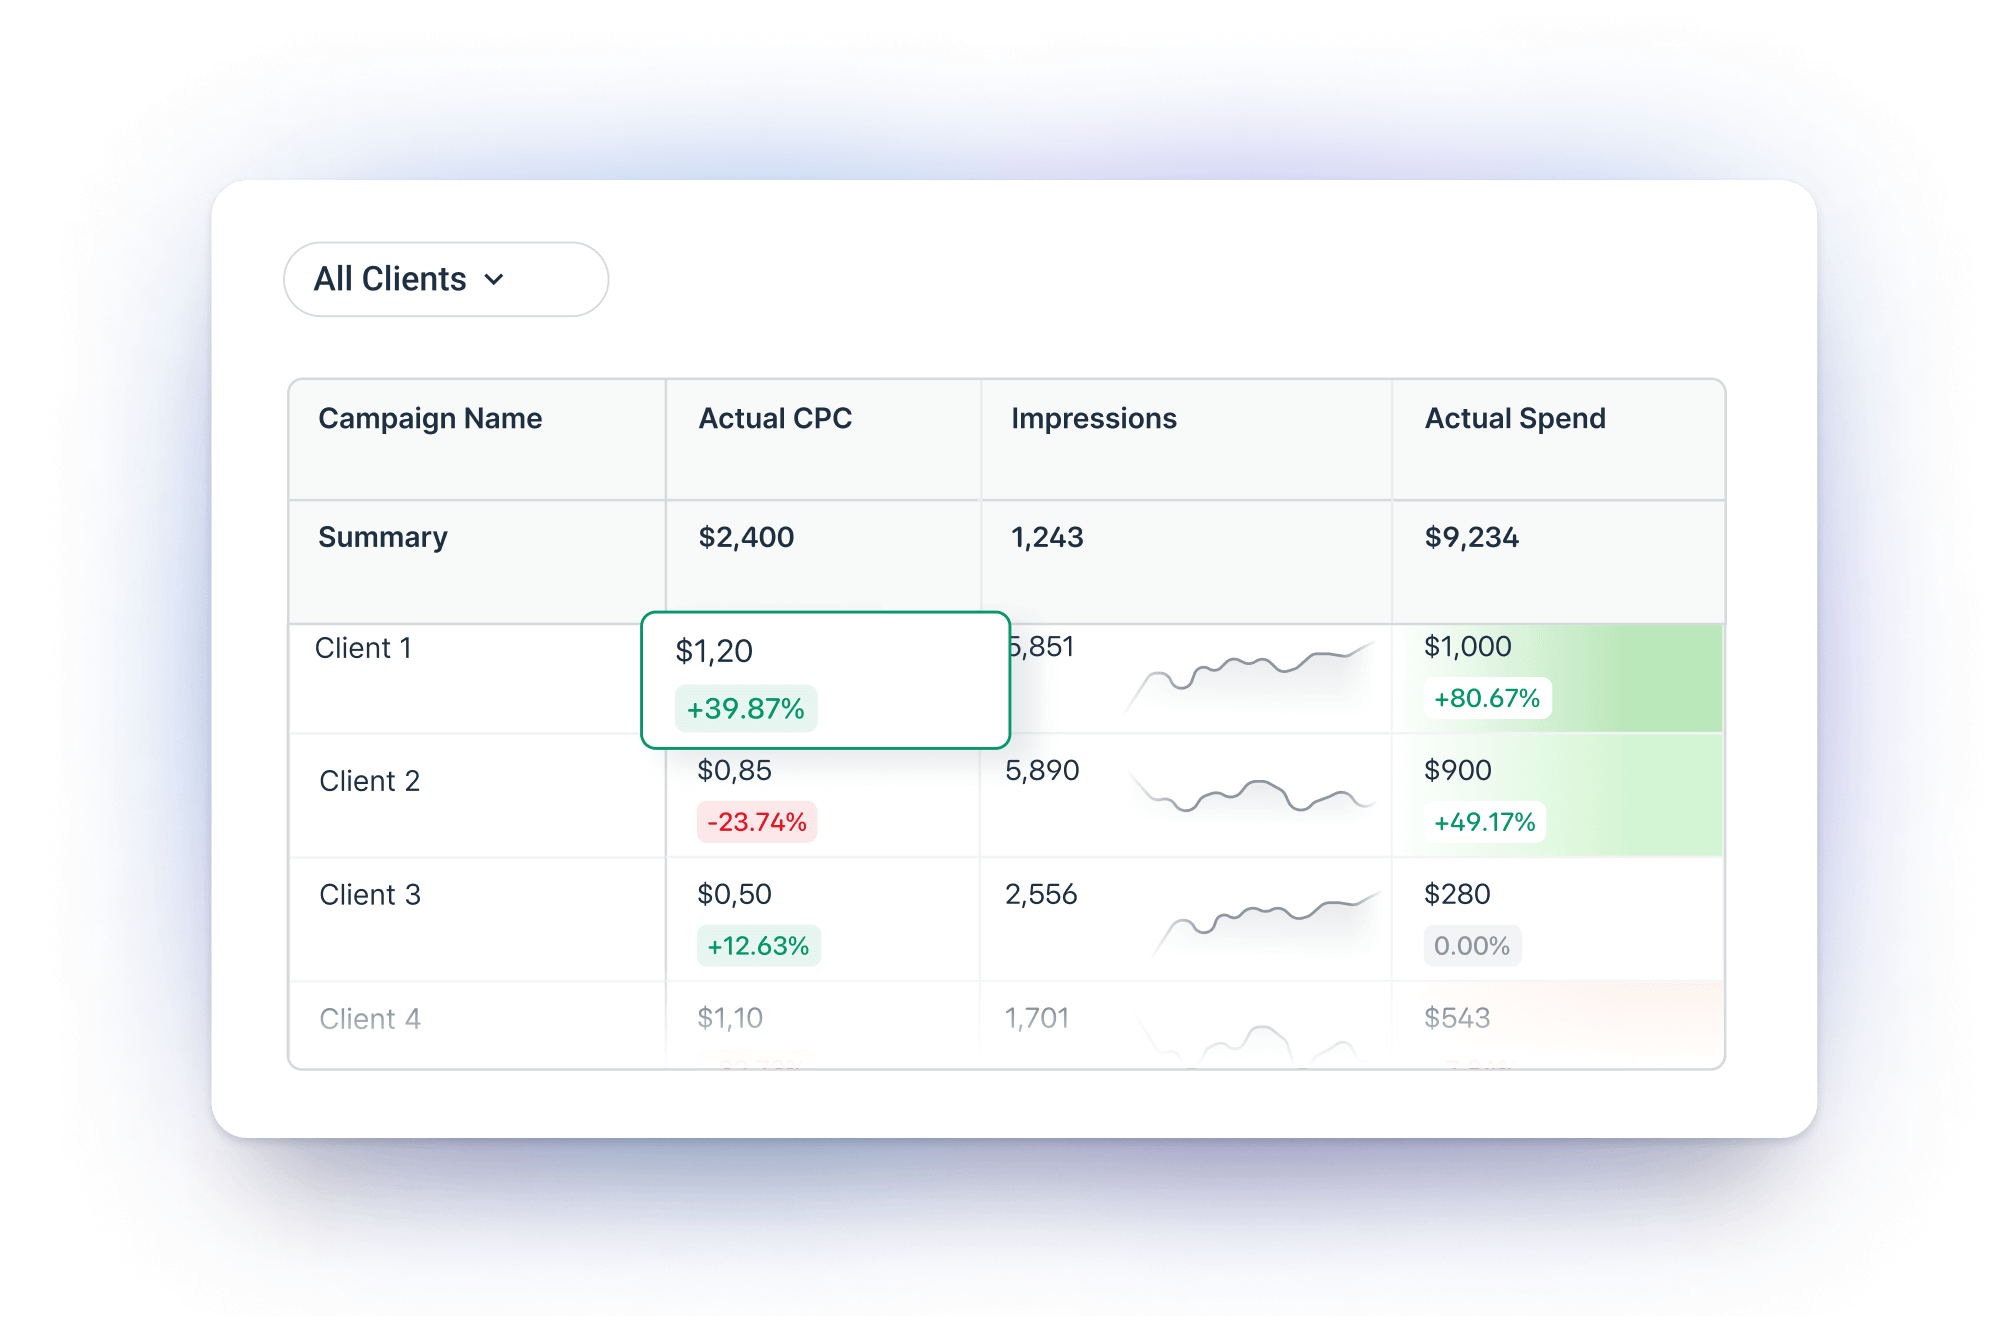
With Whatagraph, you can build a dedicated dashboard to track your social media KPIs across all channels, campaigns, and accounts. It’s not just for end-of-month reporting. It’s your daily control center.
Instead of logging into five different platforms or manually updating spreadsheets, you get a live overview of your performance data—all in one place. Monitor reach, engagement, ad spend, conversions, and campaign trends as they happen, so you can react faster and optimize proactively.
For example, you can:
✅ Track real-time KPI trends like a drop in CTR or sudden spike in post saves
✅ Compare channels side-by-side to see which platform is driving the most return on investment (ROI)
✅ Slice and dice data by custom tags (like “Instagram Reels,” “Black Friday campaign,” or “Client A”)
✅ Spot underperforming campaigns early so you can optimize your social media strategy, creative, budget, or timing
✅ Highlight which social posts or ads need improvement based on their relative performance
For social media managers, this dashboard helps you stay on top of KPIs and take the right action—fast.
 What are the best social media KPIs?
The best KPIs depend on your goals—but whether you're growing brand awareness, boosting engagement, or proving ROI, there are core metrics that every social media KPI dashboard should track.
Below are the most important KPIs you’d typically see in social media metrics dashboard templates.
Engagement Metrics
These help you understand how your audience is interacting with your social media posts.
- Engagement Rate: Measures how many people interacted with your post relative to how many saw it—key for judging content relevance and quality.
- Likes/Reactions: Shows how much your content resonates emotionally with your audience.
- Comments: Indicates the level of active interest and conversation sparked by your content.
- Shares/Retweets/Reposts: Reflects content virality—how often followers are amplifying your message.
- Saves (Instagram/Pinterest): Shows long-term value—people want to come back to this content later.
- Clicks: Tracks how many users clicked on links in your posts, often tied to traffic or conversion goals.
Audience Growth Metrics
These track how your following is expanding over time.
- Follower Growth: Measures how your target audience is increasing (or decreasing) during a set period—an essential signal of brand momentum.
- New Followers: Tracks how many new people started following your account—great for evaluating campaign impact or content reach.
- Unfollows: Shows how many people stopped following—useful for spotting content misalignment or timing issues.
Reach & Impressions Metrics
These help you measure content visibility.
- Reach: The total number of unique users who saw your post—useful for gauging brand awareness.
- Impressions: The total number of times your content was displayed (including repeats)—helps assess how frequently your audience is exposed to your brand.
- Frequency: Average number of times a single user sees your post—too high can lead to fatigue; too low might mean you're missing your audience.
Content Performance Metrics
These show how individual posts or campaigns are performing.
- Top-Performing Posts: Identifies which posts had the highest engagement or reach—great for doubling down on what works.
- Video Views/Completion Rate: Measures how much of your video content people actually watch—helps optimize format and length.
- Story Engagement (Taps Forward/Back, Exits): Tells you how users interact with story content—good for improving flow and relevance.
Paid Social Metrics
These connect your paid campaigns to performance and return on ad spend.
- Ad Spend: The total budget spent on paid social ads—essential for tracking cost and pacing across campaigns.
- CPM (Cost per 1,000 Impressions): Measures how much you're paying to reach 1,000 people—helps assess reach efficiency.
- CPC (Cost per Click): Tracks how much each ad click costs—vital for optimizing bidding strategies and budget allocation.
- CTR (Click-Through Rate): The percentage of people who clicked on your ad—shows how compelling your creative and messaging are.
- ROAS (Return on Ad Spend): Compares revenue earned to ad spend—used to measure the actual financial impact of your paid social efforts.
Conversion Metrics
These connect social media activity to business outcomes.
- Click-Through Rate (CTR): The percentage of viewers who clicked your link—useful for testing headlines, CTAs, and content offers.
- Conversions: Tracks actions taken after a click—like purchases, signups, or downloads—vital for proving ROI.
- Conversion Rate: The percentage of clicks that led to a conversion—shows how effective your content and ads are at driving real action.
- Cost per Conversion (CPC/CPA): How much you're spending for each result—critical for understanding social campaign efficiency.
- Social Referral Traffic: The number of visitors sent to your site from social media—ties social activity to web performance.
Customer & Community Metrics
These reflect your brand's relationship with your audience.
- Mentions/Tags: Tracks how often users talk about your brand—good for monitoring sentiment and reputation.
- Sentiment Analysis: Measures whether mentions are positive, negative, or neutral—helps you understand how people feel about your brand.
- Response Time: How quickly your team responds to comments or messages—important for customer service and community management.
- Response Rate: The percentage of messages or comments your team replies to—shows how engaged and attentive your brand is.
Tracking these KPIs consistently helps you move beyond vanity metrics and understand what’s really driving performance, engagement, and growth across your social media marketing efforts.