


What is a TikTok reporting tool?
A TikTok reporting tool collects, organizes, and presents your TikTok Ads and organic data in one platform, one report.
Instead of switching between TikTok Ads Manager, native TikTok analytics, and separate spreadsheets for each client, you get one connected view that tells the full story of how your TikTok campaigns are performing.
61% of TikTok users discover new brands and products on the platform - 1.5x more than other platform users. If your clients are running TikTok ads, that reach is real. And a TikTok reporting tool makes sure you can prove it.
A good TikTok reporting tool does the heavy lifting for you:
- Connects directly to TikTok Ads and organic data via a native API integration
- Pulls data from TikTok and other marketing channels for a cross-channel view
- Standardizes metrics across platforms so you're comparing like for like
- Presents performance in a way clients can understand without a walkthrough
- Let's you brand every report to match your agency or your client's identity
And with Whatagraph IQ, you can take this process even further. Rather than spending hours manually drafting reports, it helps to:
- Create reports in seconds: Simply type in the type of report you need, and IQ builds the full report for you - widgets, tabs, metrics, all included.
- Brand reports: Upload an image or explain how you want to style your report. IQ generates a matching report with fonts, HEX codes, and colors.
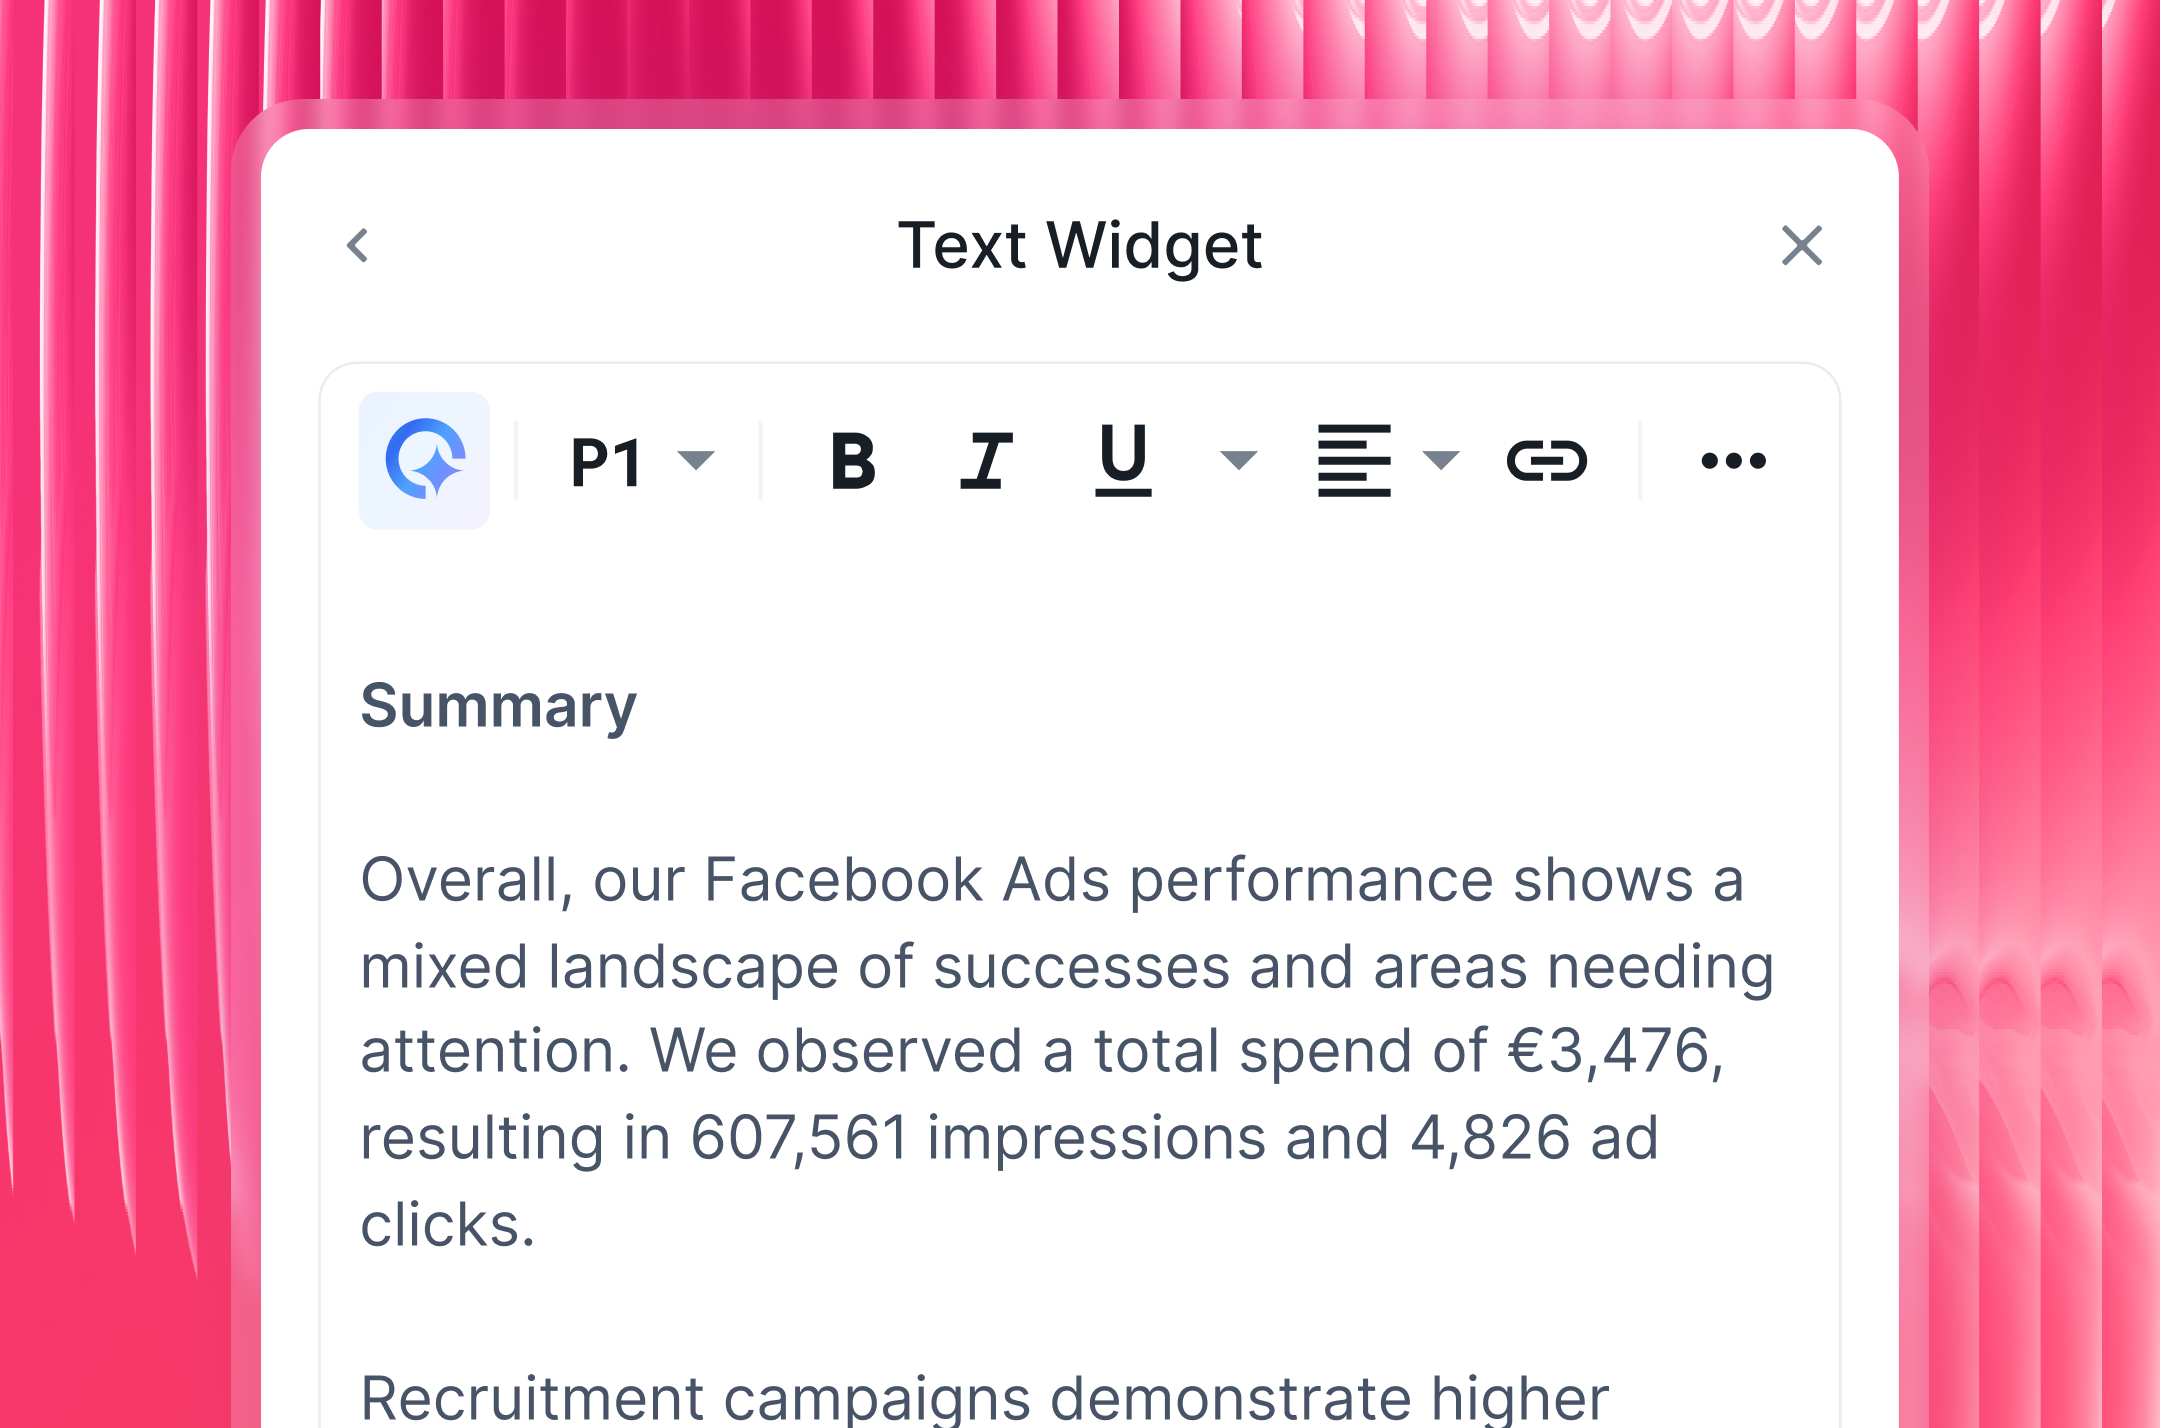
- Explain performance: Ask IQ to write a performance summary based on your actual data. Drag and drop it easily into your reports.
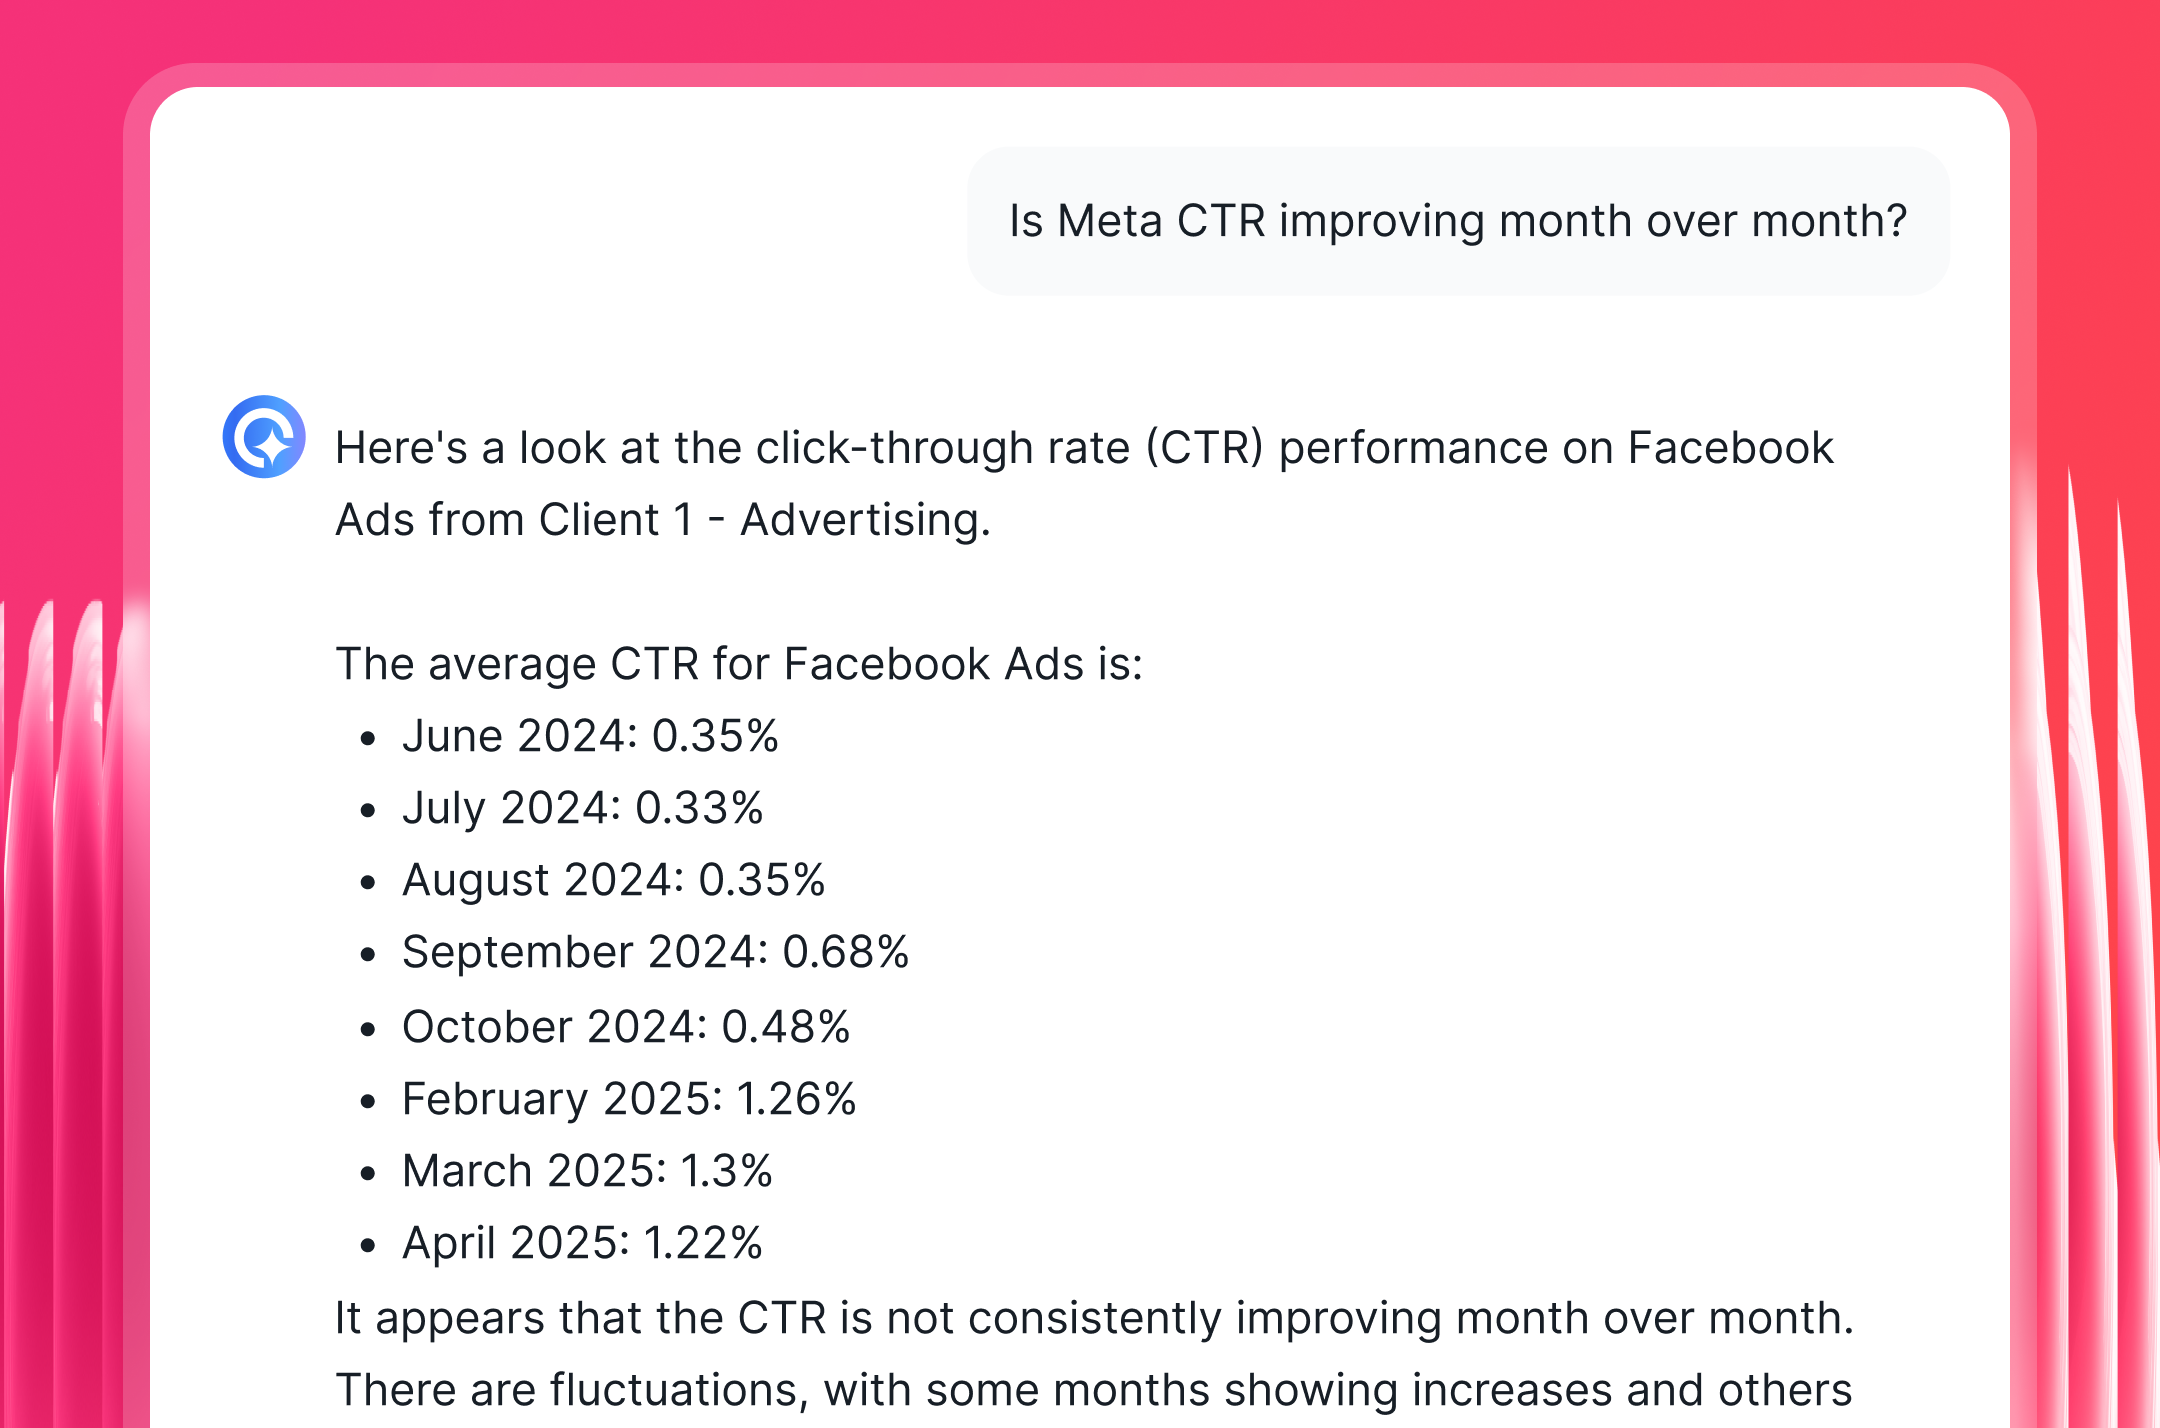
- Get quick insights: Ask IQ questions about your data, such as “Is TikTok CTR improving month over month?”
Whatagraph has also launched an MCP that lets you connect your data to Claude or ChatGPT and analyze your data there.
The time saving achieved by automated reporting is real. Swash Labs, an agency serving 36 clients, was previously spending 40 hours/month on reporting. After switching to Whatagraph, the reporting time dropped to 4 hours, freeing 36 hours a month.
As Stephanie Delk, Director of Media and Planning at Swash Labs, put it:
Whatagraph helps us highlight our clients' work as well as the progress our team makes on their accounts. We're now able to spend more time analyzing rather than cleaning data thanks to the connected sources.
What to include in a TikTok report for clients?
A strong TikTok performance report gives clients a clear view of what their budget is doing - from ad spend and reach to video performance and audience demographics.
Here's how to structure it using our TikTok Ads report template, broken down section by section.
1. Performance Summary
Open the report with a plain-language overview of how TikTok campaigns performed during the reporting period.
Include:
- A goal widget tracking KPI progress against targets - impressions, clicks, conversions, and engagement
- A top-line metrics list showing results for the period, such as "last 30 days"
- Text widgets for written insights, recommendations, and next steps
When it comes to what goes in this section, less is more. As Elizabeth Greene, Co-Founder of Junglr, puts it:
A dashboard with 27 million different metrics is often unhelpful or confusing. What I've focused on instead is identifying the few core KPIs that help us quickly spot when something is going wrong in an account - because I want to catch negative trends as early as possible.
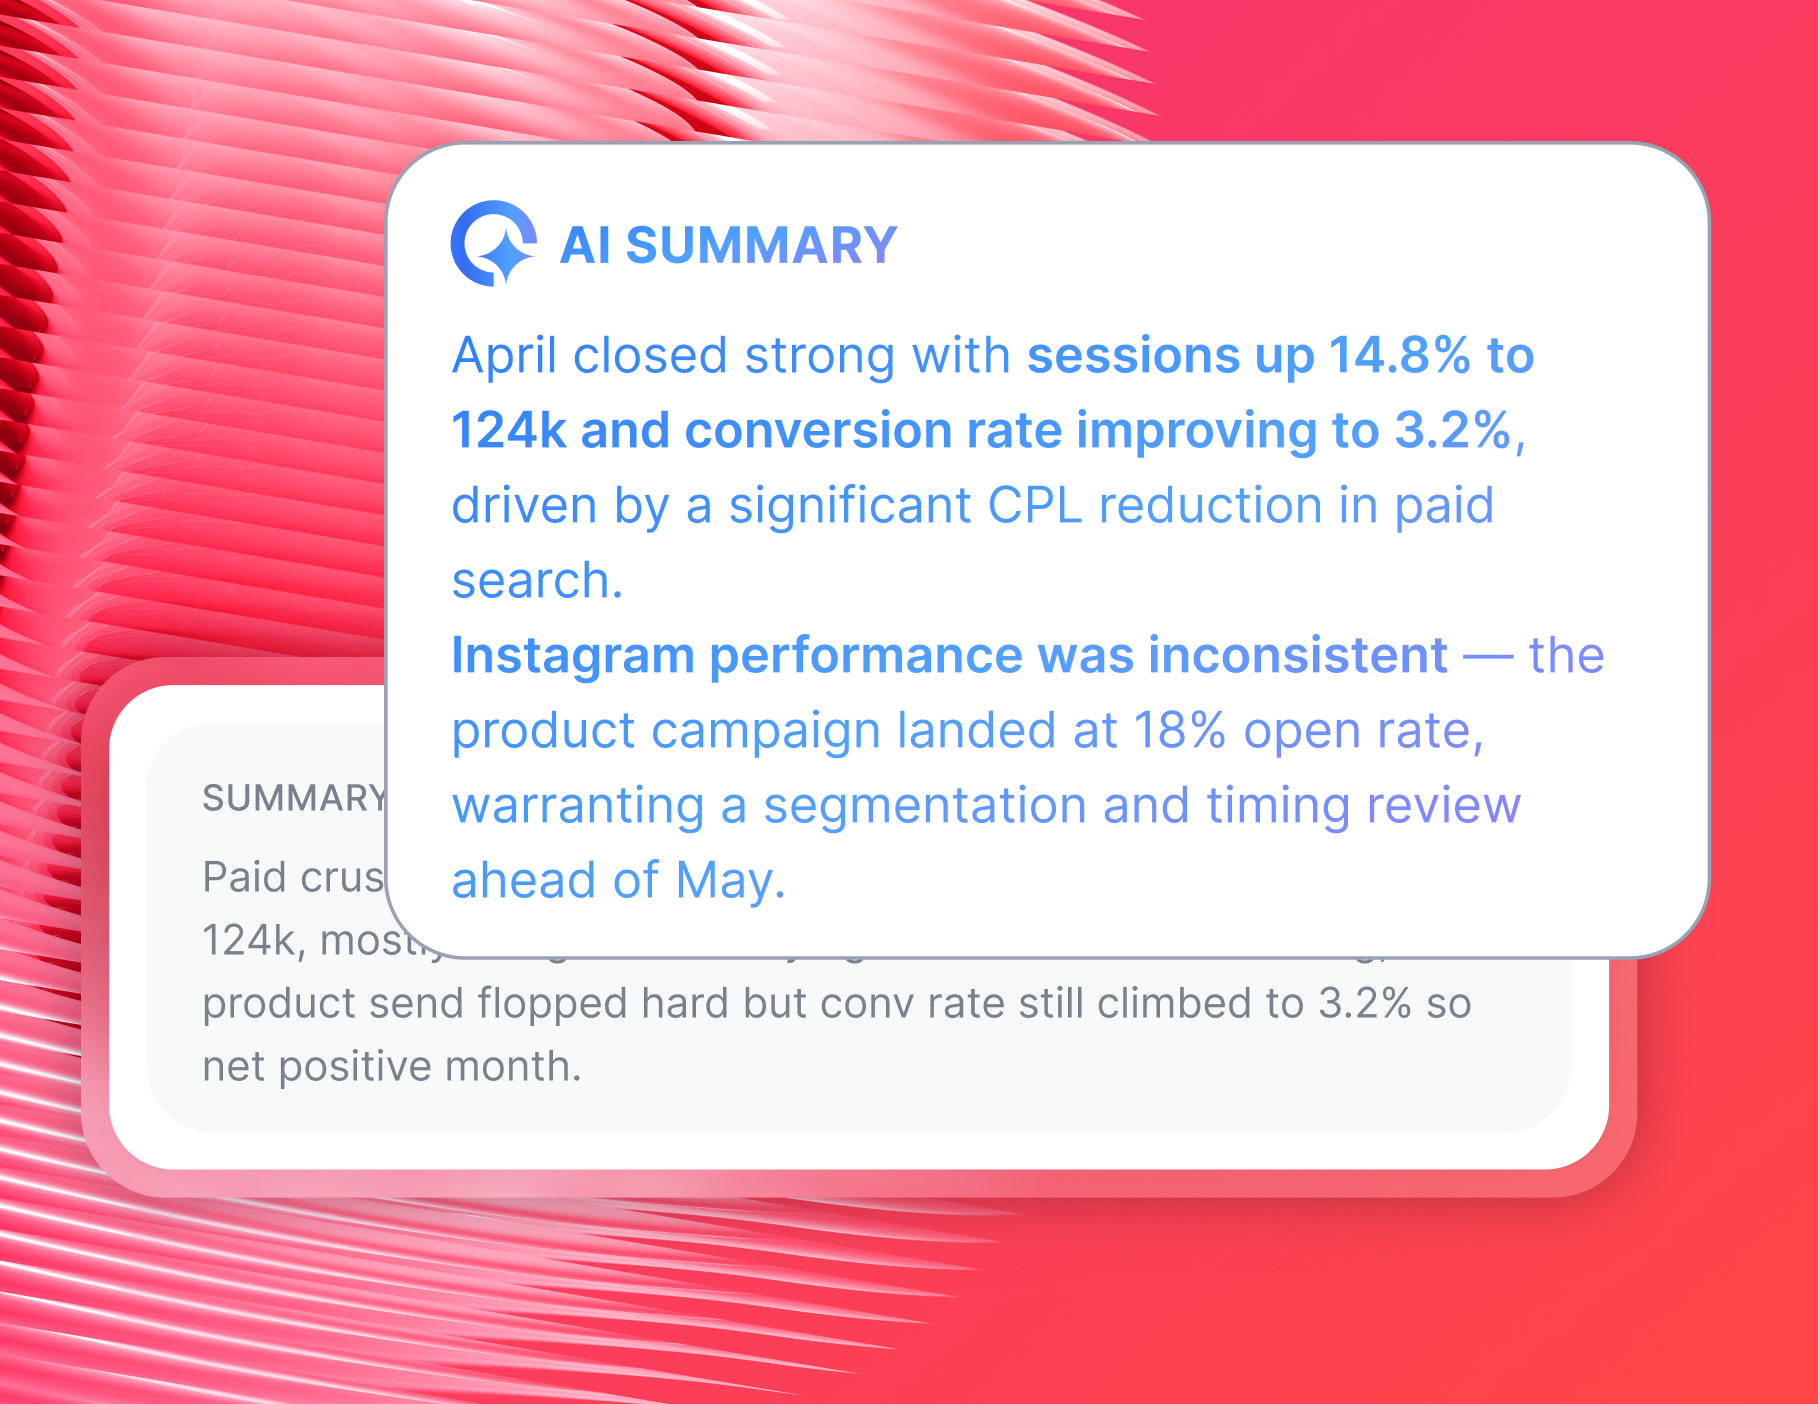
This is also where Whatagraph IQ earns its place. Rather than writing performance summaries from scratch after every reporting cycle, you can ask IQ to generate them based on the actual data already in your report.
Write a custom prompt, such as:
- "Summarize TikTok campaign performance for a client meeting."
- "Compare TikTok and Instagram performance for all my clients."
- "Write a client-facing summary of our TikTok campaign results.”
IQ produces a client-ready recap in seconds - in any of 18 languages.
Because IQ reads directly from your report data, there are no inaccuracies. Edit the output as much as you need to match your agency's tone, then send it straight to your client.
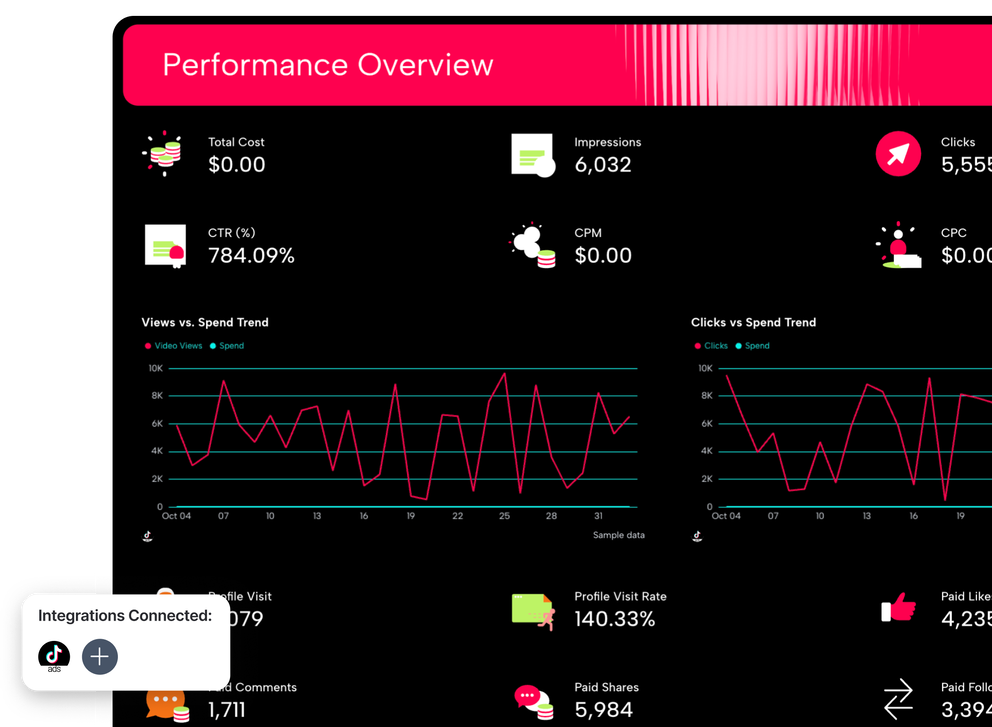
2. Performance Overview
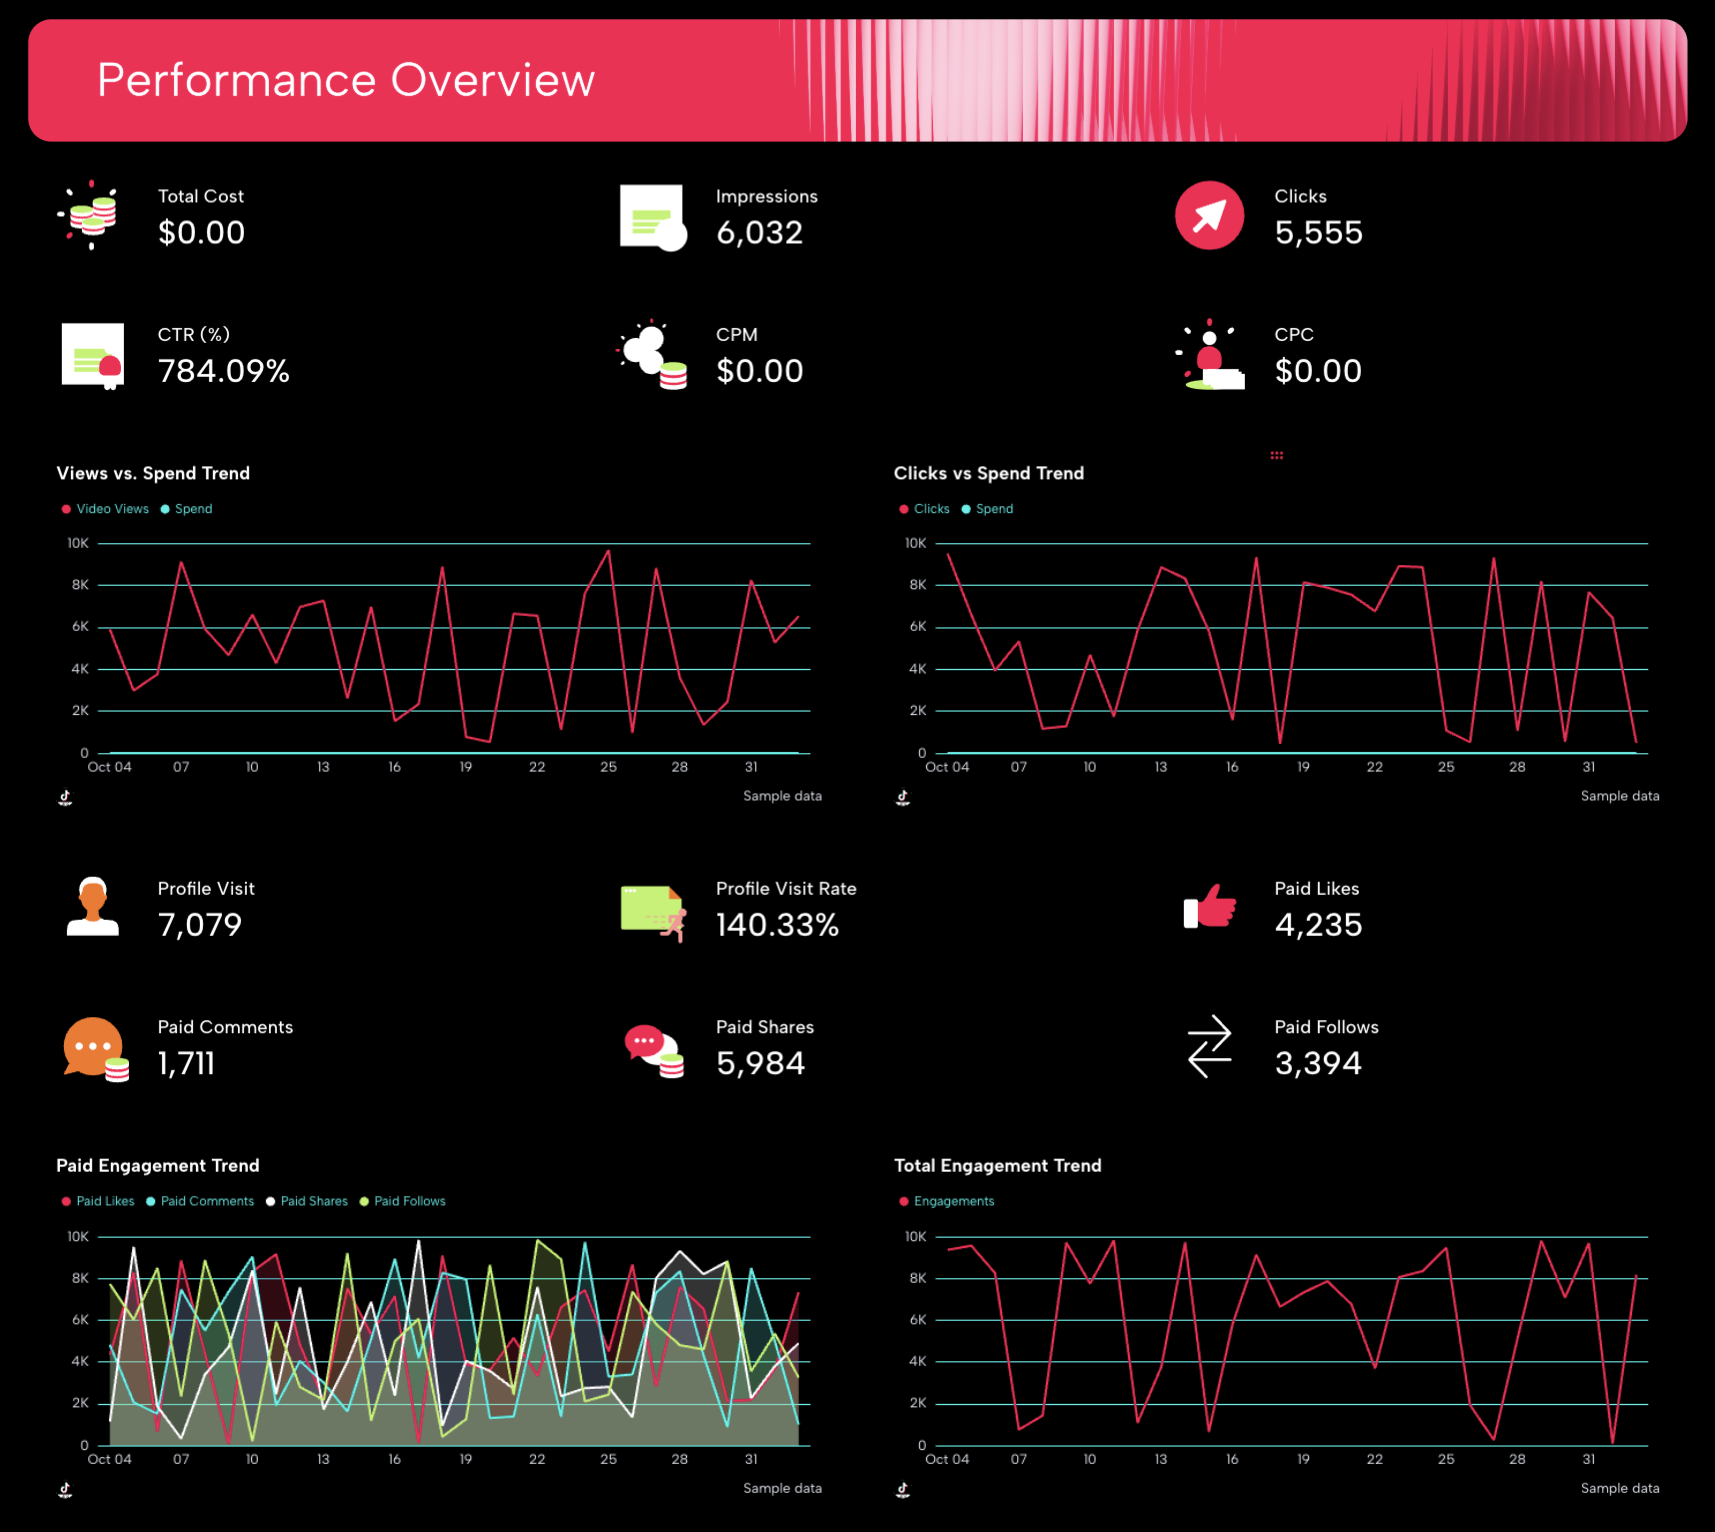
This section gives clients a fast, visual read of your most critical TikTok Ads KPIs.
Display single-value widgets for:
- Total ad spend
- Impressions
- CTR
- CPC
- CPM
- Conversion rate
- Clicks
Compare each metric against the previous period so clients can see at a glance whether performance is trending up or down.
Back these up with trend line charts showing how key metrics moved over the reporting window. This turns a table of numbers into a story - one that's easy to follow even for clients with no ads background.
3. Paid Engagement
Dedicated to paid TikTok Ads, this section breaks down exactly how audiences are interacting with your ads.
Include single-value widgets for:
- Paid likes
- Paid comments
- Paid shares
- Paid follows
Back these up with two trend charts:
1. A paid engagement trend that tracks likes, comments, shares, and follows over time on a single chart
2. And, a total engagement trend that shows combined engagement as a single line.
Together, these views make it easy to spot spikes, identify which engagement types are driving overall performance, and flag any drop-off that might signal creative fatigue.
4. Reach Breakdown
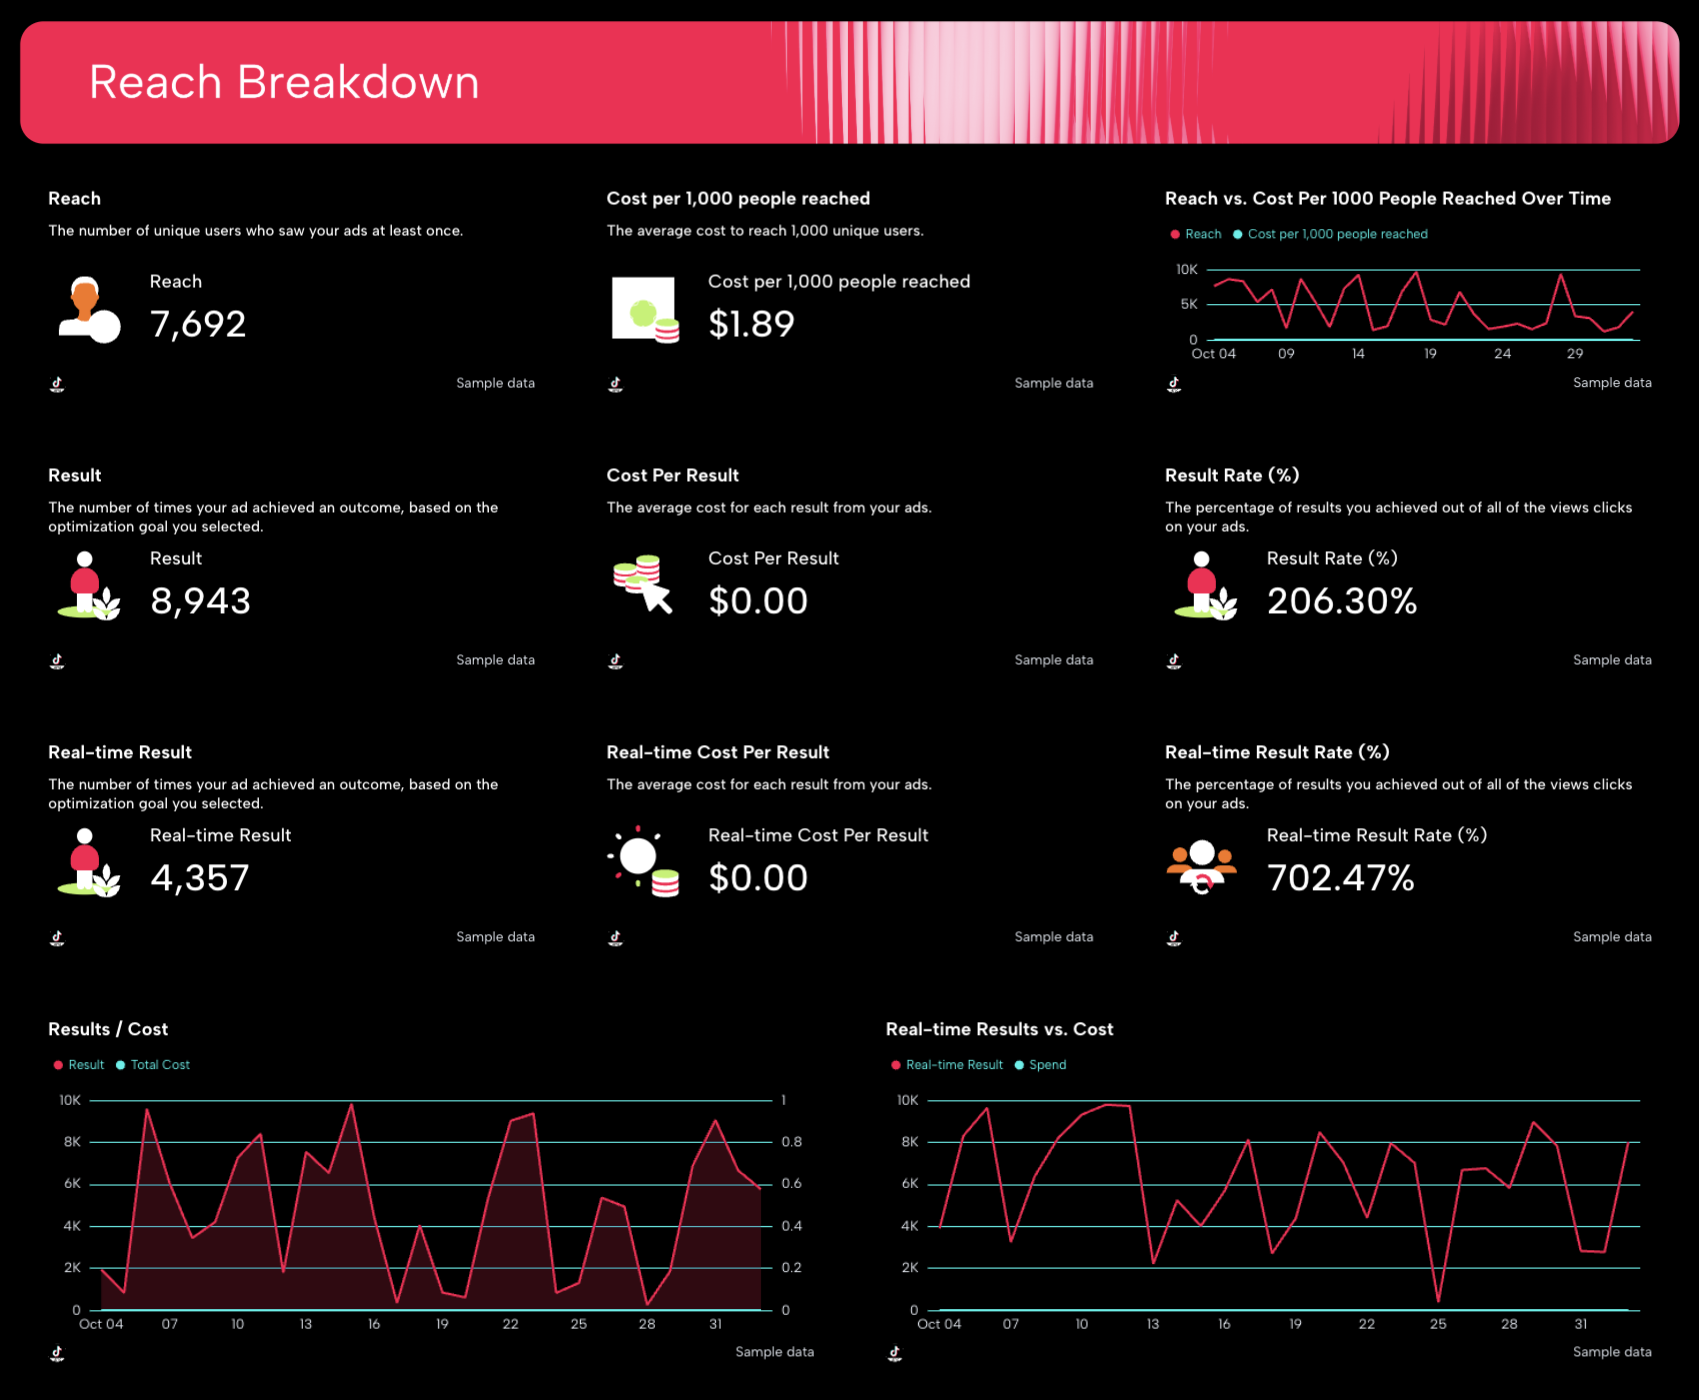
This section answers a question every client asks: how many people are the TikTok campaigns actually reaching?
Include these key metrics:
- Total reach
- Profile visits, and
- Cost per 1,000 people reached
- Result rate
Then show how reach has trended over time and layer in a reach vs. cost comparison chart, so clients can see whether their budget is working efficiently or whether there's room to stretch further.
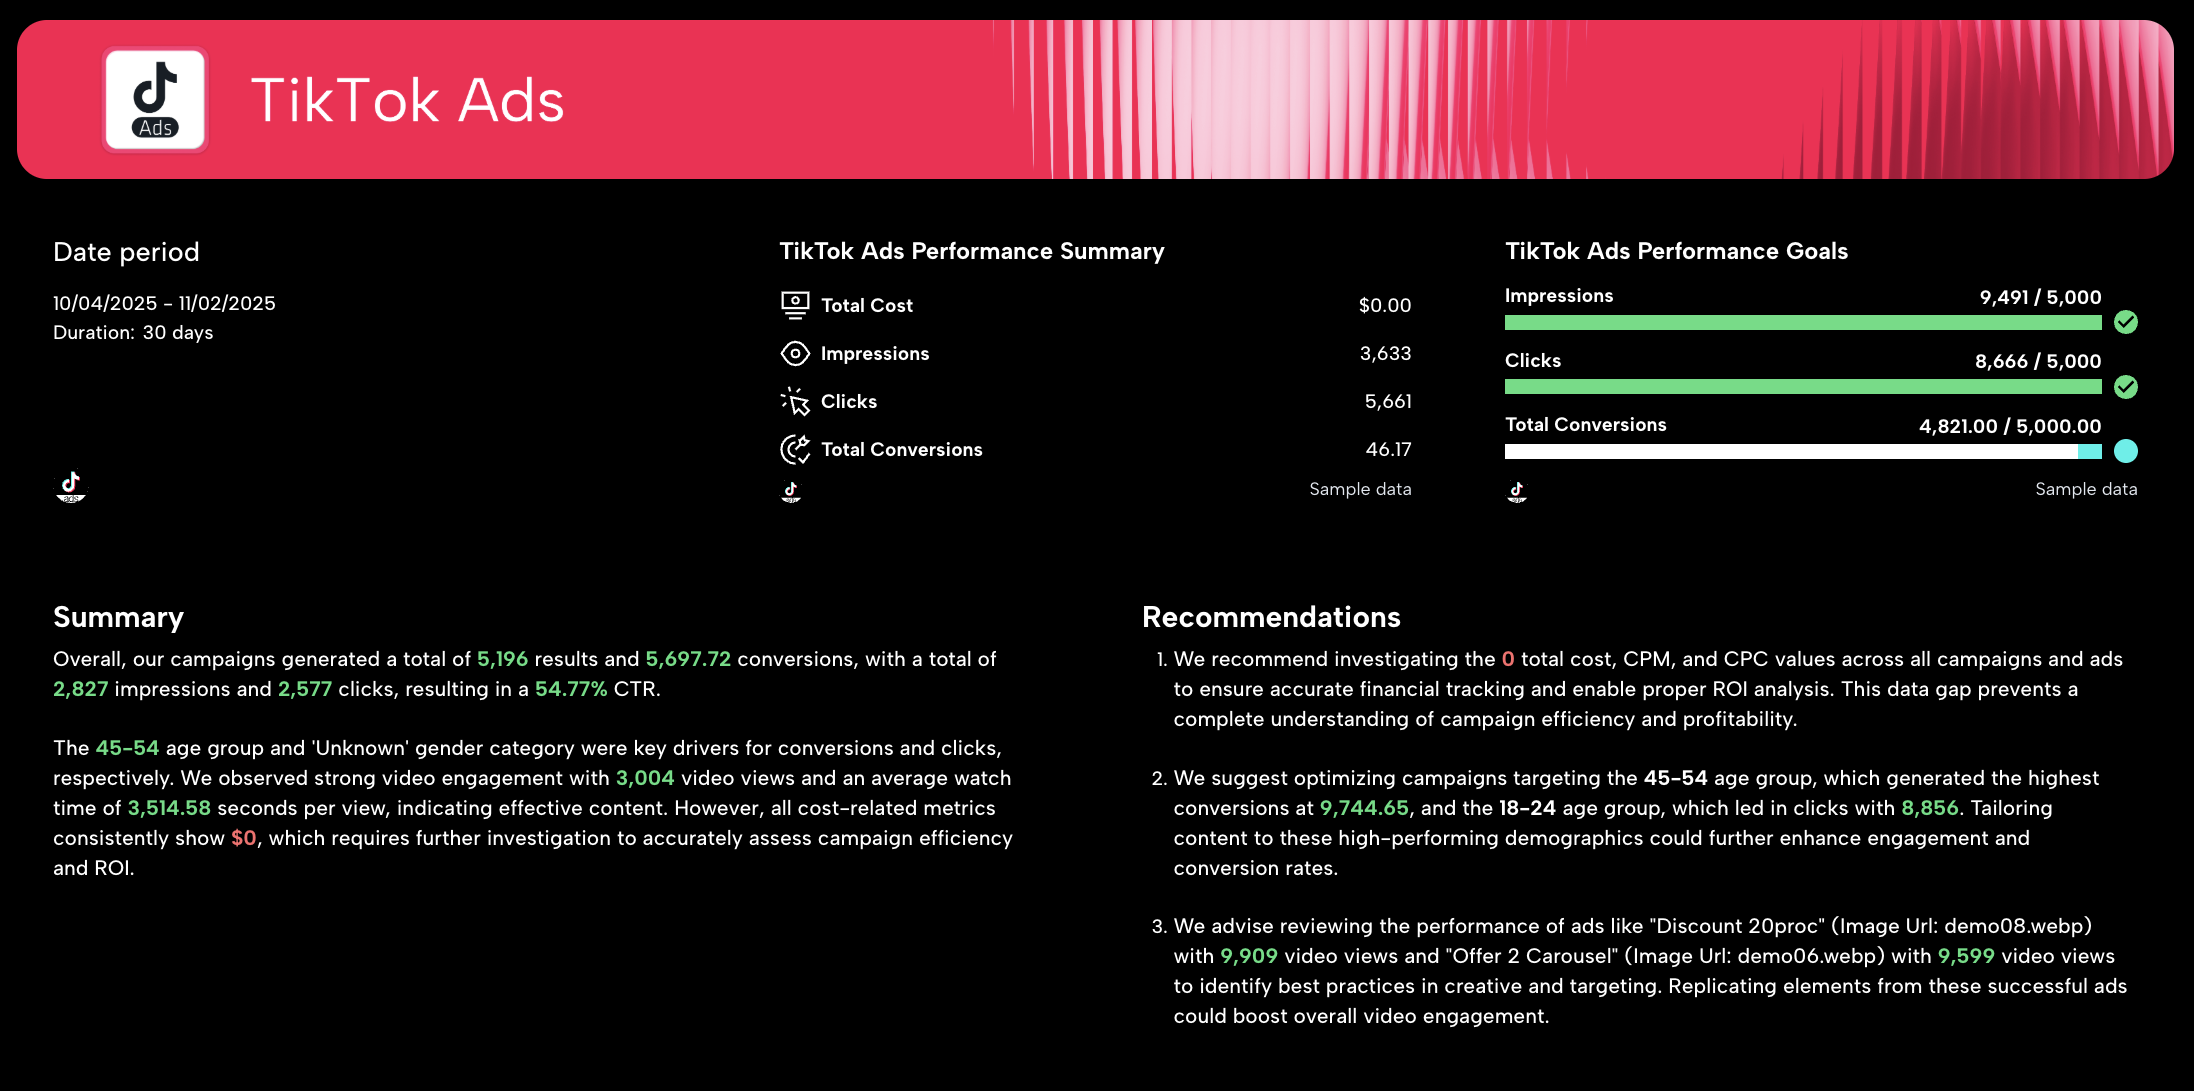
5. Campaign and Ad Performance
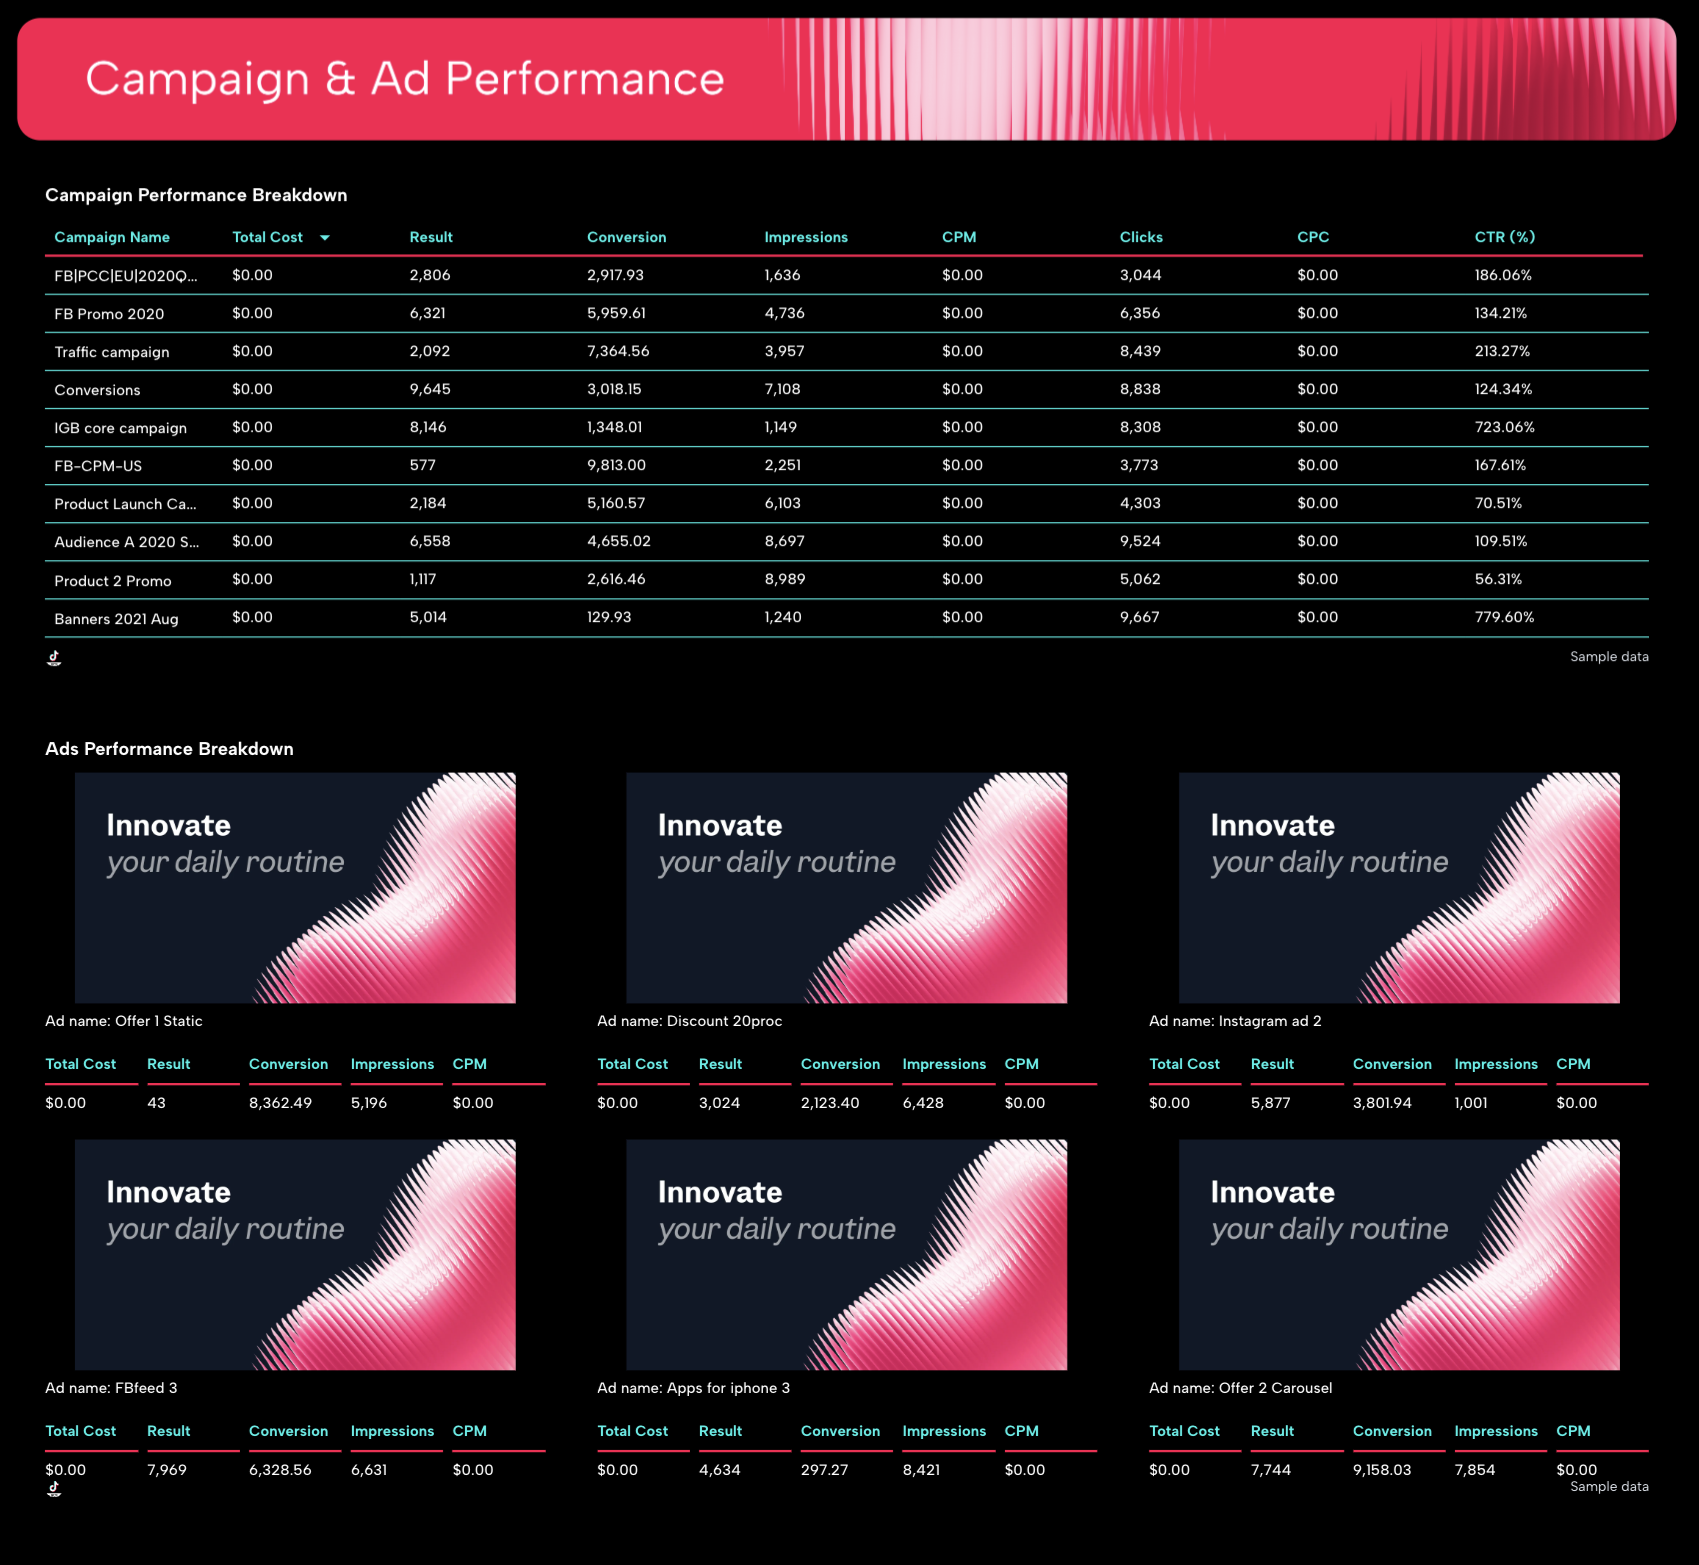
This is where clients see which campaigns are pulling their weight and which need adjusting.
Include a campaign performance breakdown table showing these metrics by campaign:
- Total cost
- Results
- Conversions
- Impressions
- CPM
- Clicks
- CPC
- CTR
This gives a clean side-by-side comparison across all active campaigns without needing to log into TikTok Ads Manager.
6. Views/Video Performance Breakdown
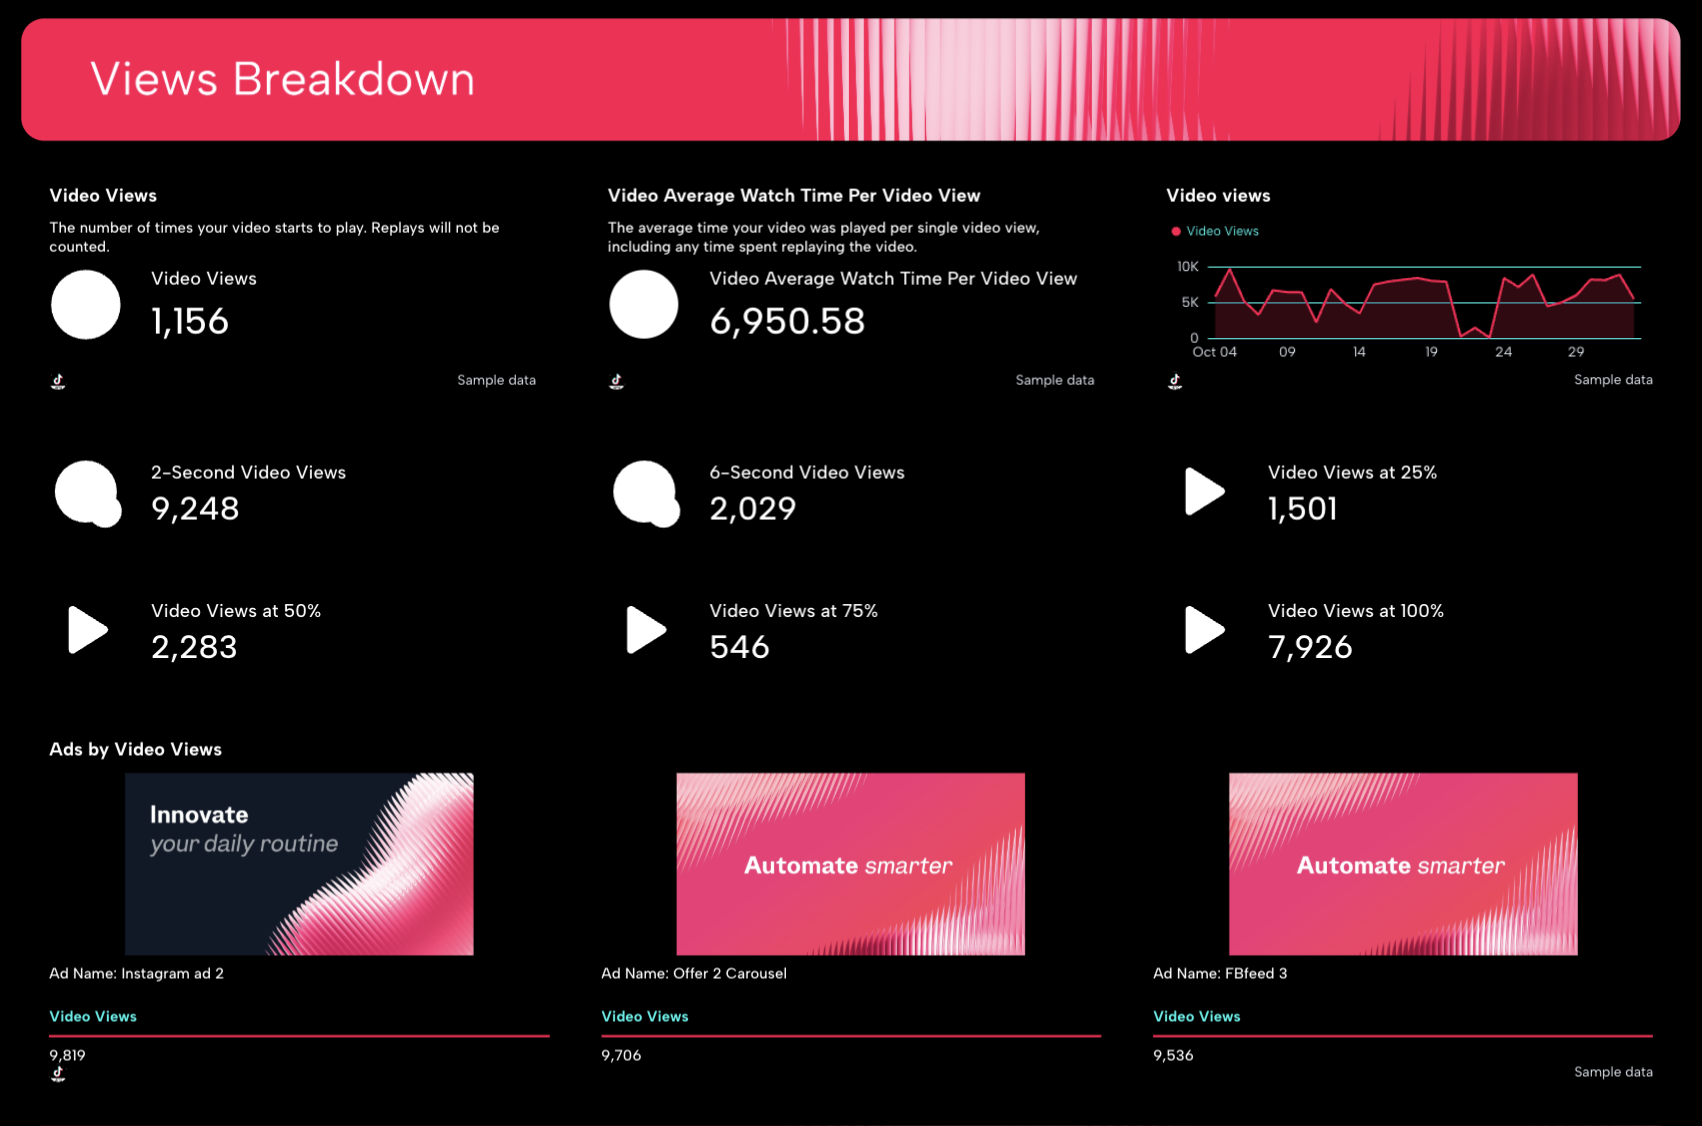
Video performance metrics tell the story that click data alone cannot.
In this section, show:
- Total video views
- Video average watch time per video
- Video views at 25%, 50%, and 75% completion
- A trend chart showing how view metrics have moved over time
- Full video completions.
These numbers reveal how far into your ads audiences are actually watching - a hook that loses viewers at the 25% mark tells a very different story than one that drives completions.
Plus, include a top-performing ads carousel sorted by video views. This helps clients and creative teams understand which formats, lengths, and messages hold attention best.
7. Engagement Breakdown
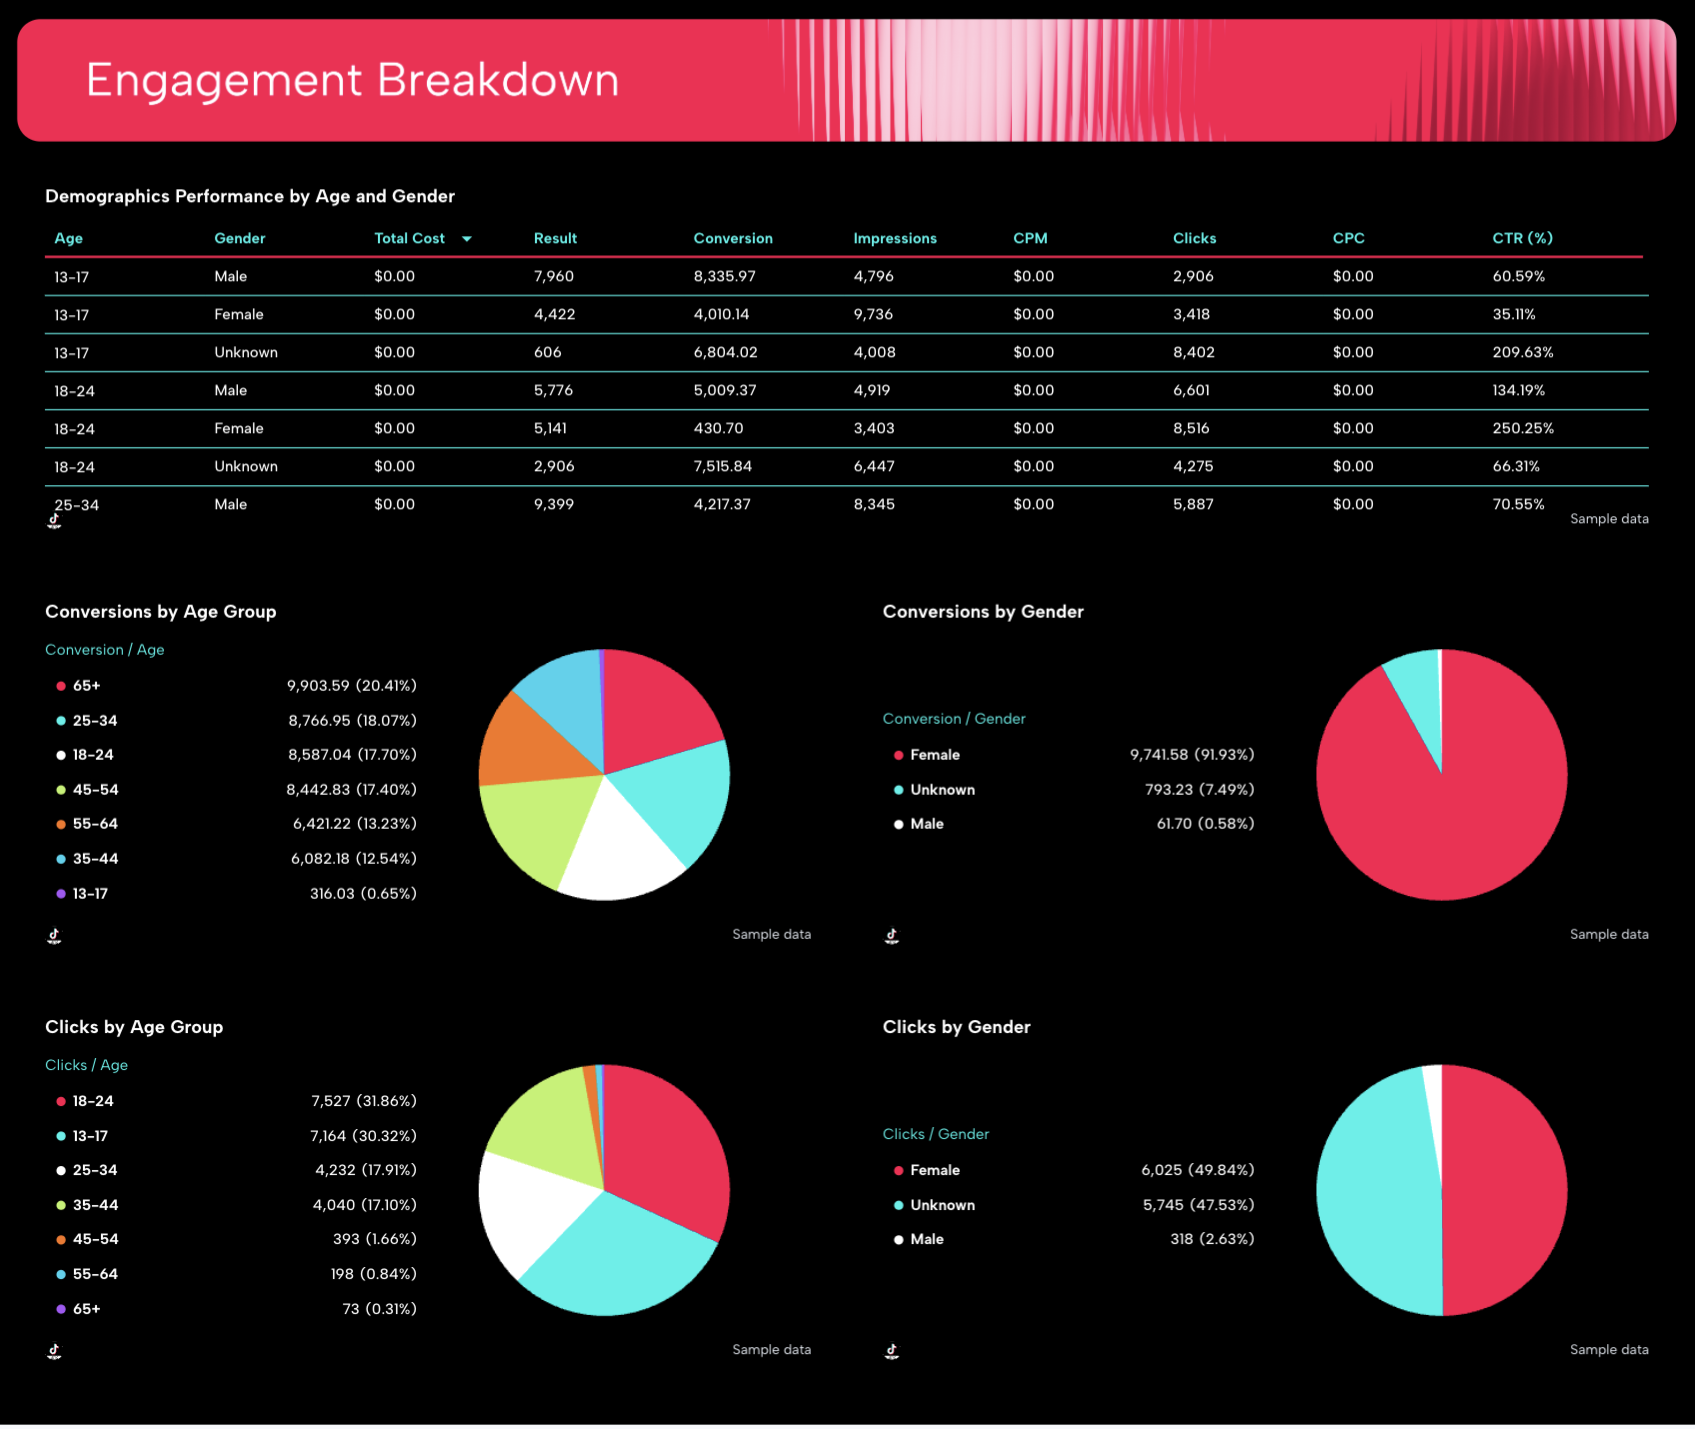
Close the report with an audience-level view that connects performance back to the people behind the numbers.
Include a demographic performance table breaking down:
- Clicks
- CPC
- CTR
- Impressions
- Conversions
- Total cost
- Gender
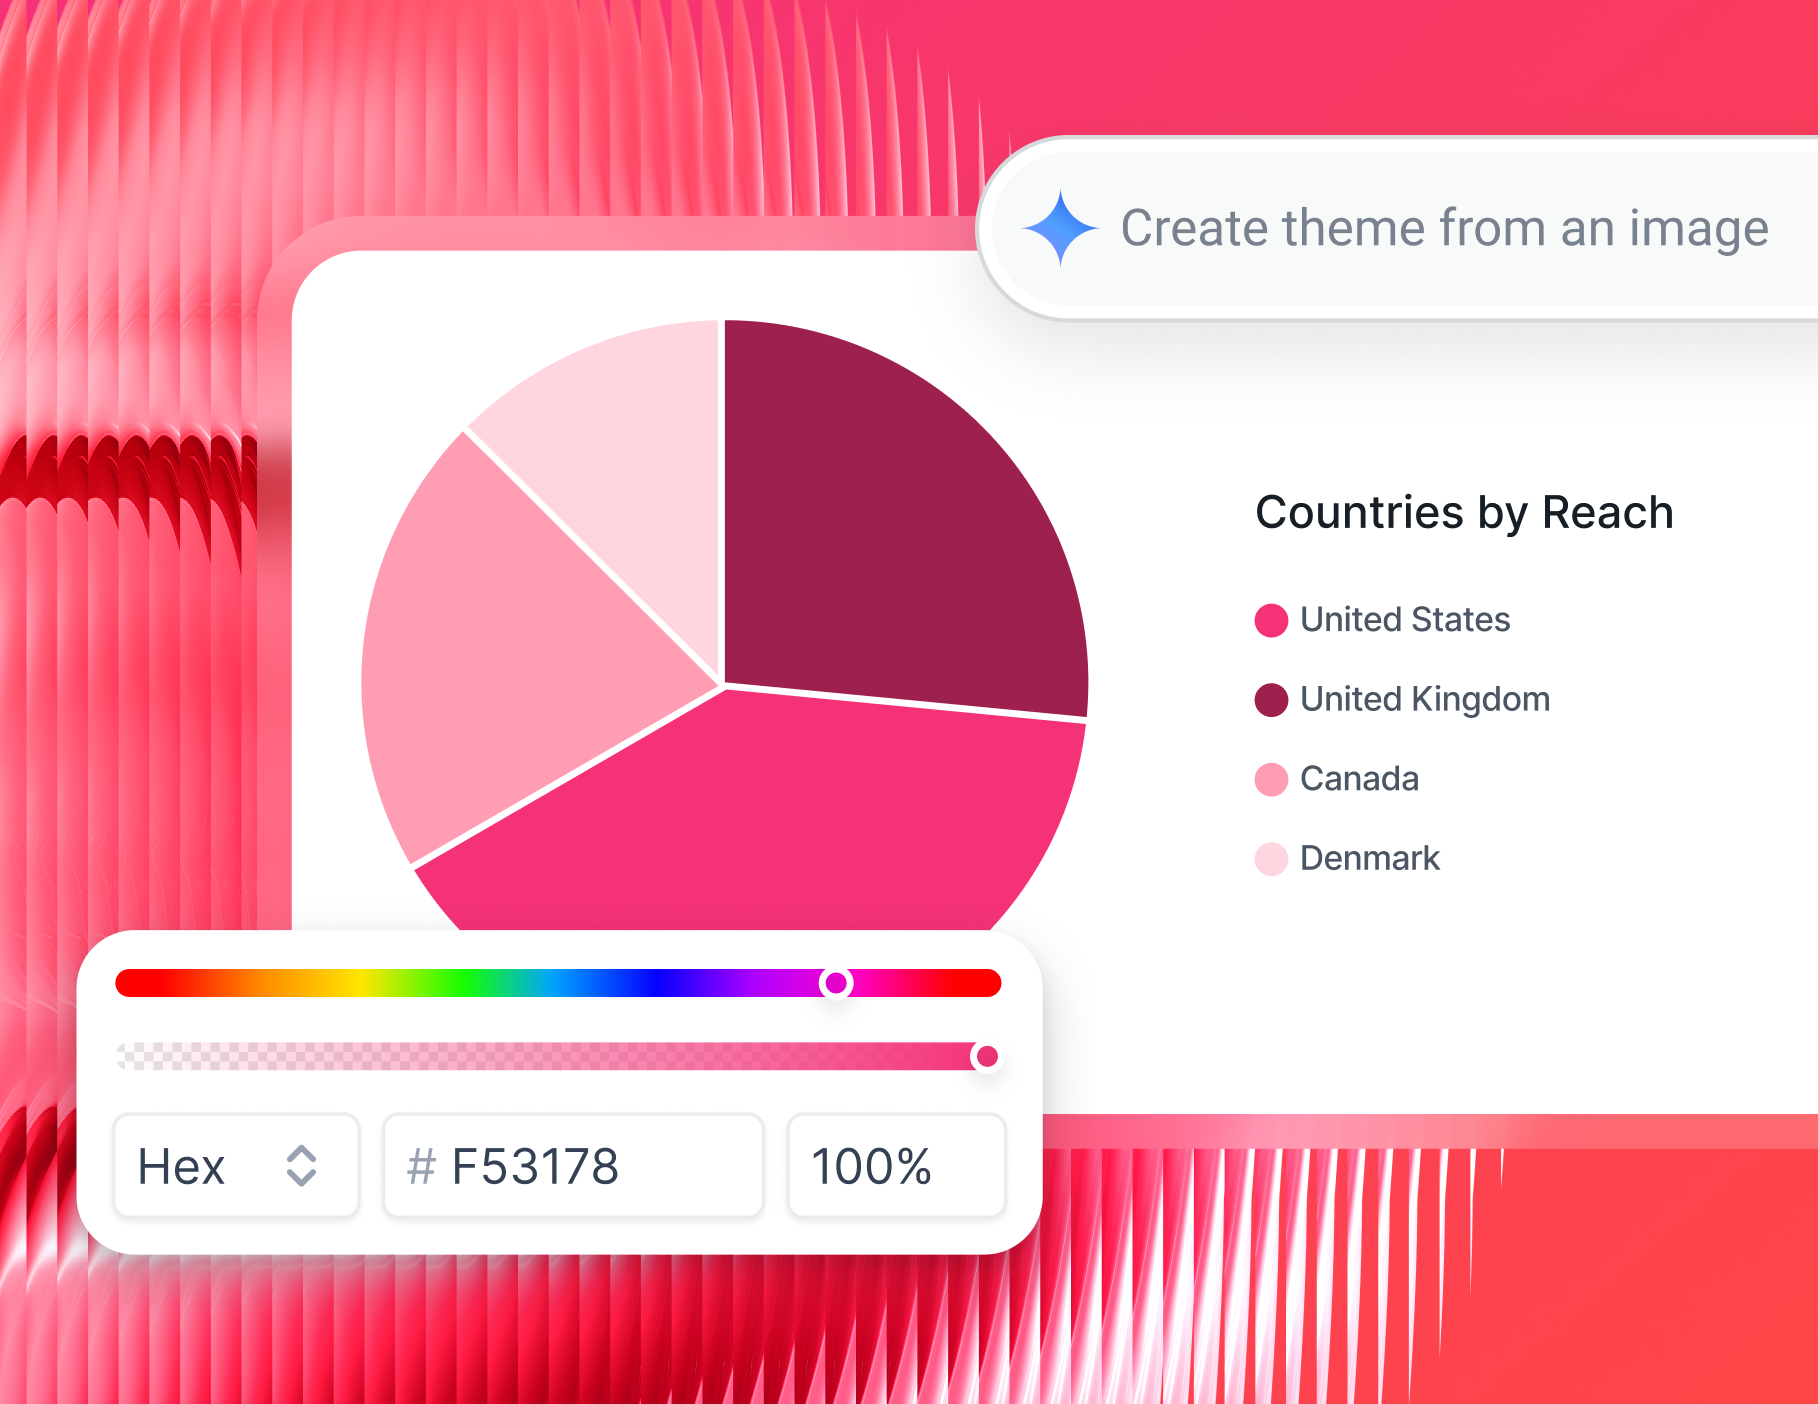
- Age
Back this up with a pie chart visualization, showing conversions and clicks by each gender and age group.
This makes it easy to see at a glance which audience groups are engaging most and where targeting adjustments could improve efficiency.
How to create TikTok reports with Whatagraph’s TikTok reporting software?
Building a TikTok report for clients shouldn't mean logging into five platforms, copying numbers into a slide deck, or spending half a day formatting charts that will be outdated by Monday.
With Whatagraph's TikTok reporting software, you can go from raw data to a client-ready report in under 30 minutes.
Here's how:
1. Connect your TikTok data
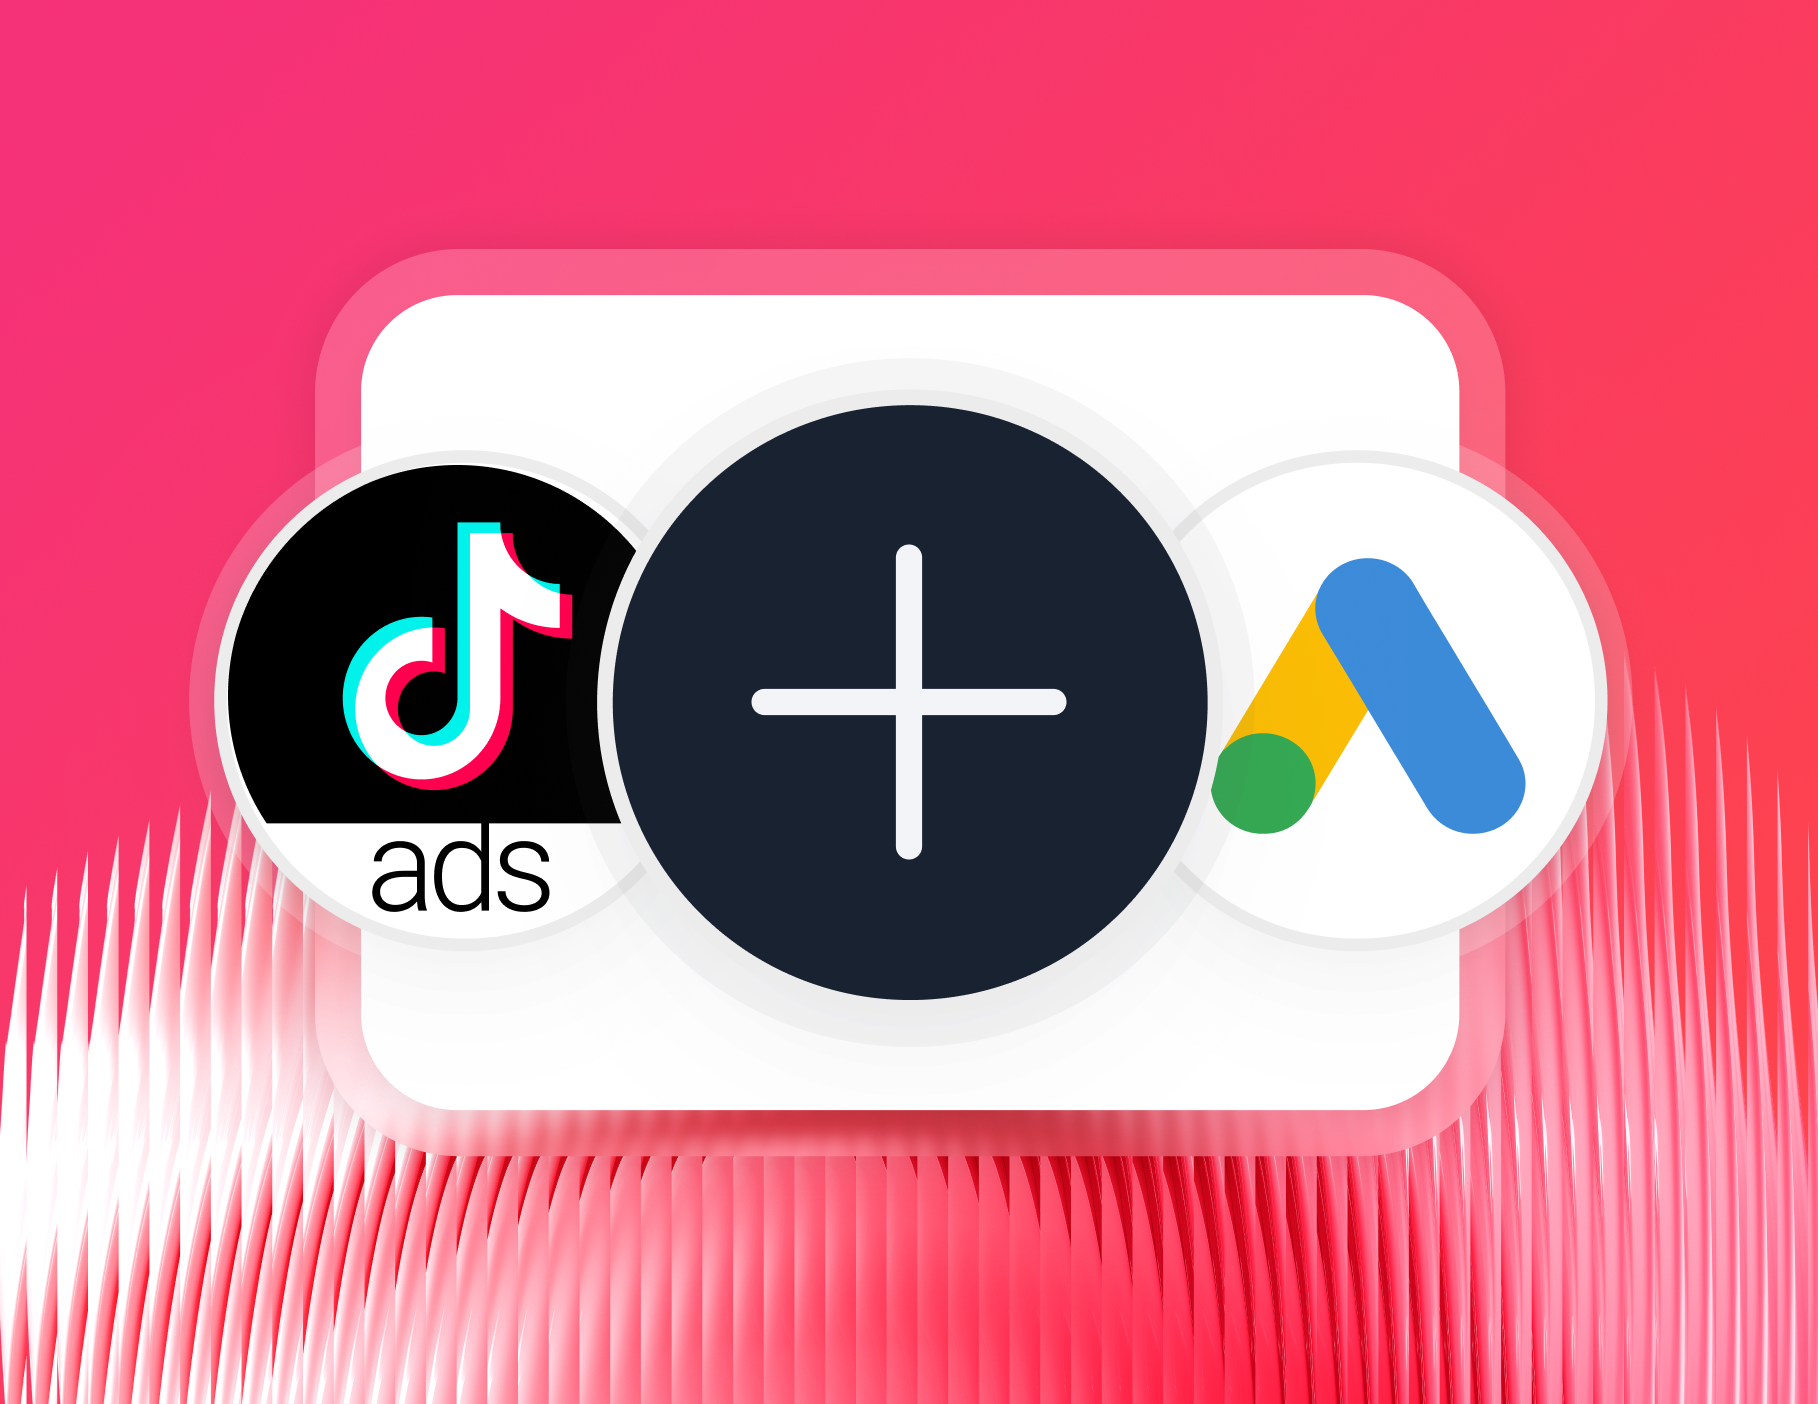
Start by connecting TikTok and any other channels your clients run through Whatagraph's plug-and-play integrations.
From your workspace, select TikTok Ads or TikTok Organic as a data source, authenticate with your login, and your data starts flowing in immediately.
No developers, no third-party connectors, no manual exports. Setup takes minutes, not hours.
You can also bring in data from Google Analytics, paid social platforms, or custom sources via Google Sheets or API connections - giving you a complete cross-channel picture in one place.
Whatagraph supports 60+ integrations in total, including:
- Paid social: TikTok Ads, Meta Ads, LinkedIn Ads, Pinterest Ads, Snapchat Ads
- Social: Instagram, Facebook, YouTube, TikTok
- E-commerce: Shopify, BigCommerce, Magento
- SEO and analytics: GA4, Semrush, Ahrefs, SE Ranking, Matomo
- Email: Mailchimp, ActiveCampaign, Constant Contact
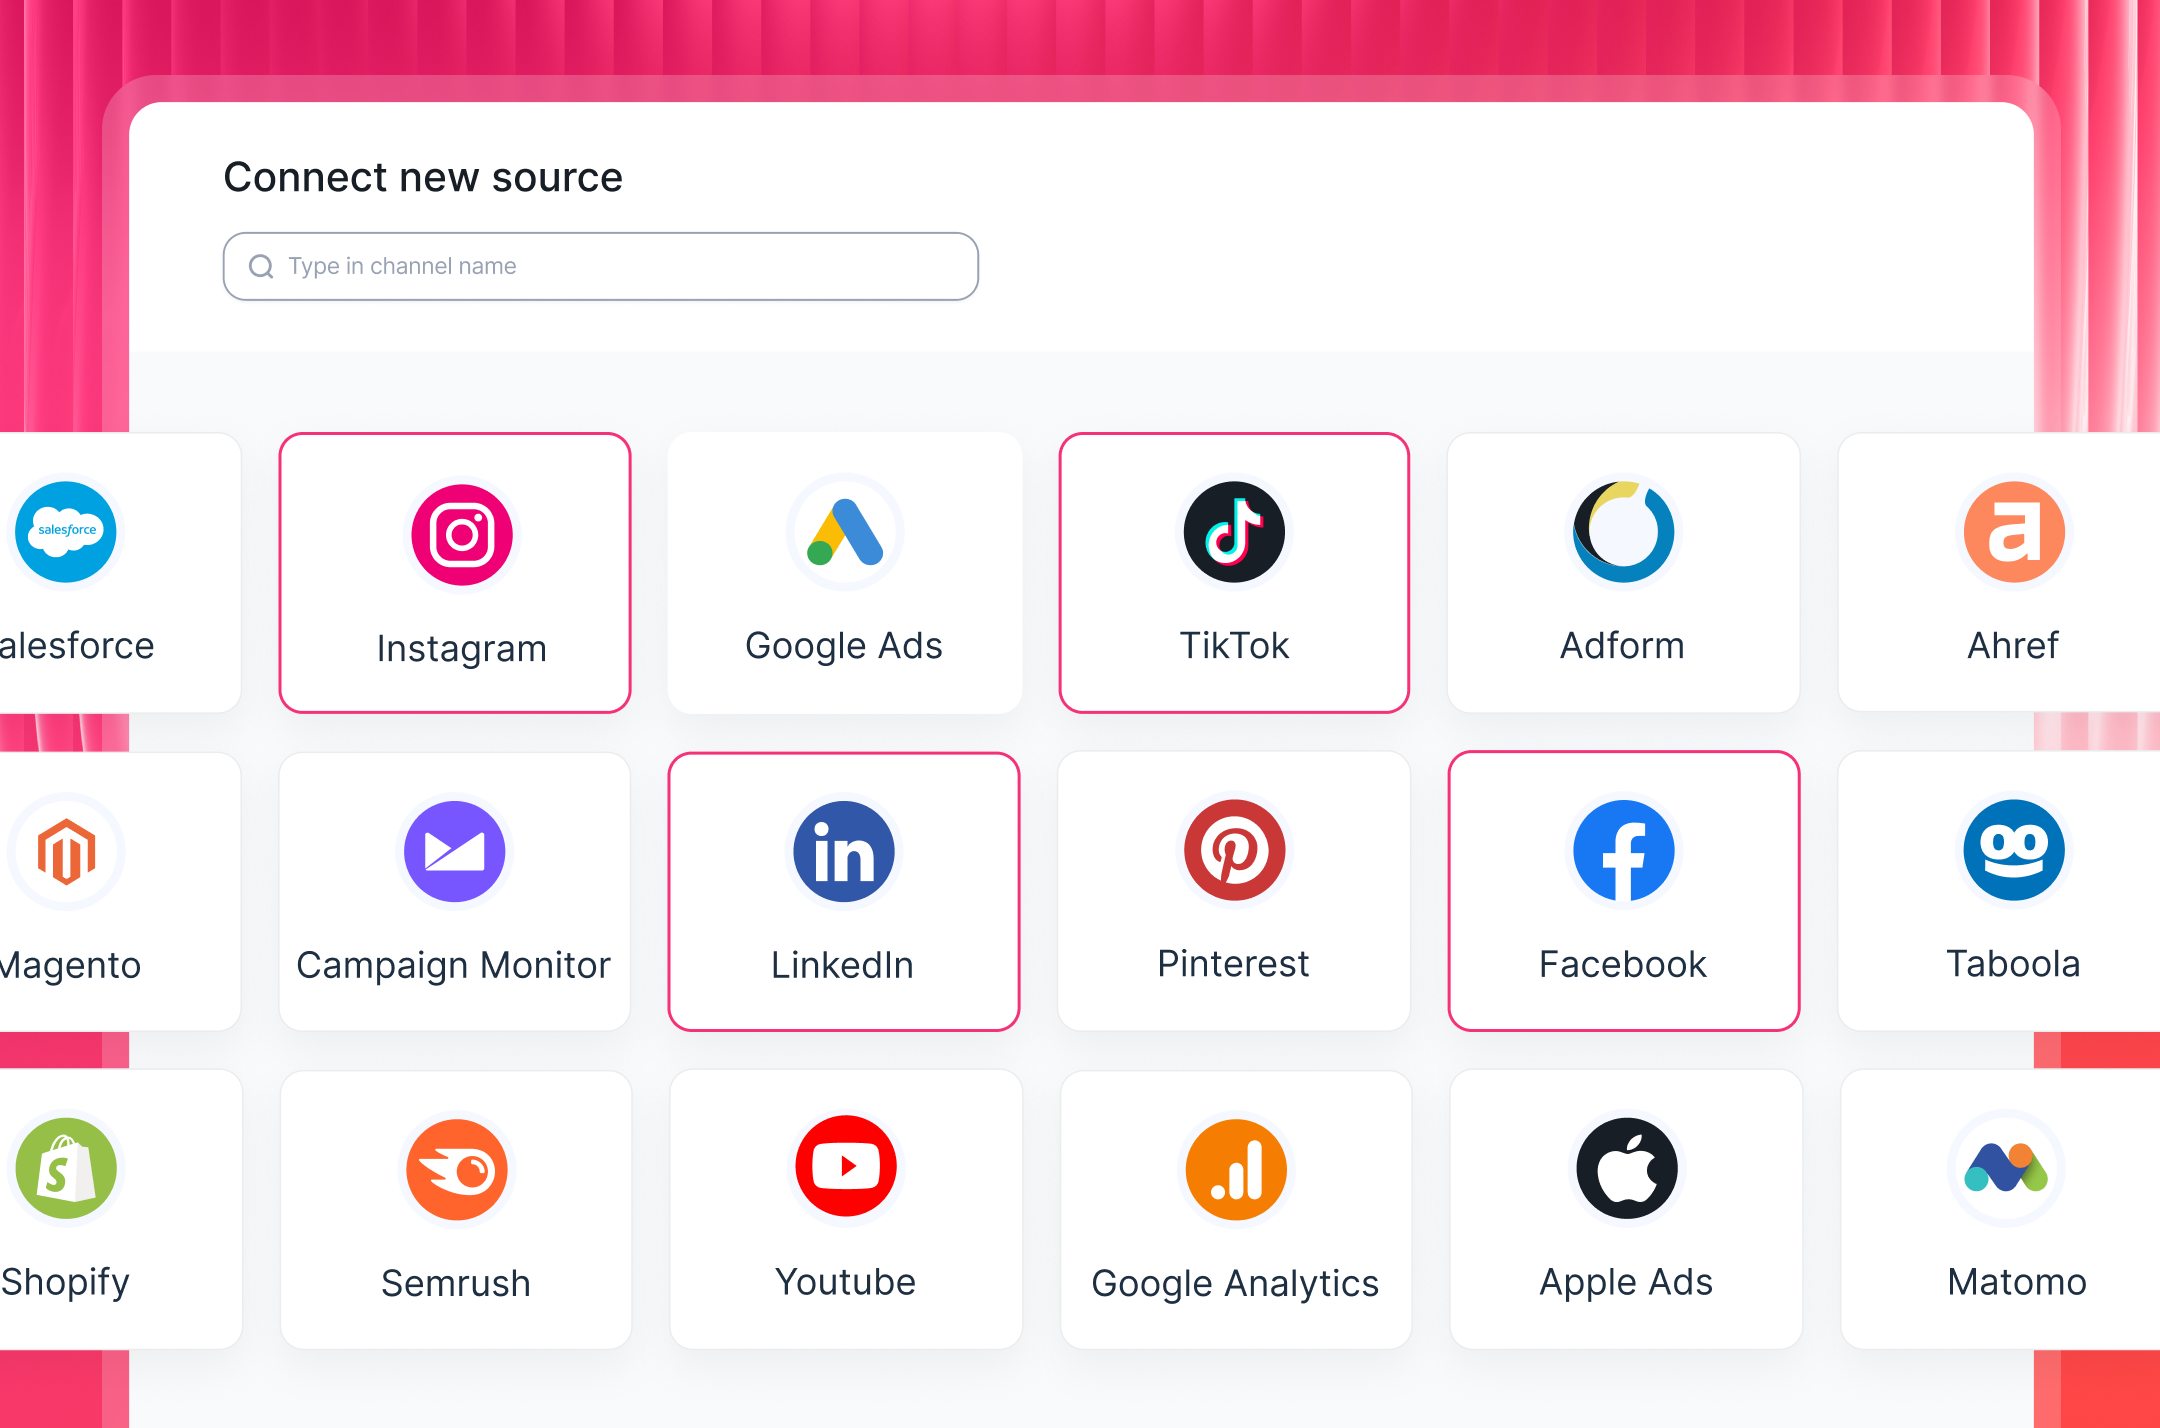
Every integration is fully managed and built directly into Whatagraph - no middleware, no broken connectors, no data that doesn't match the source platform.
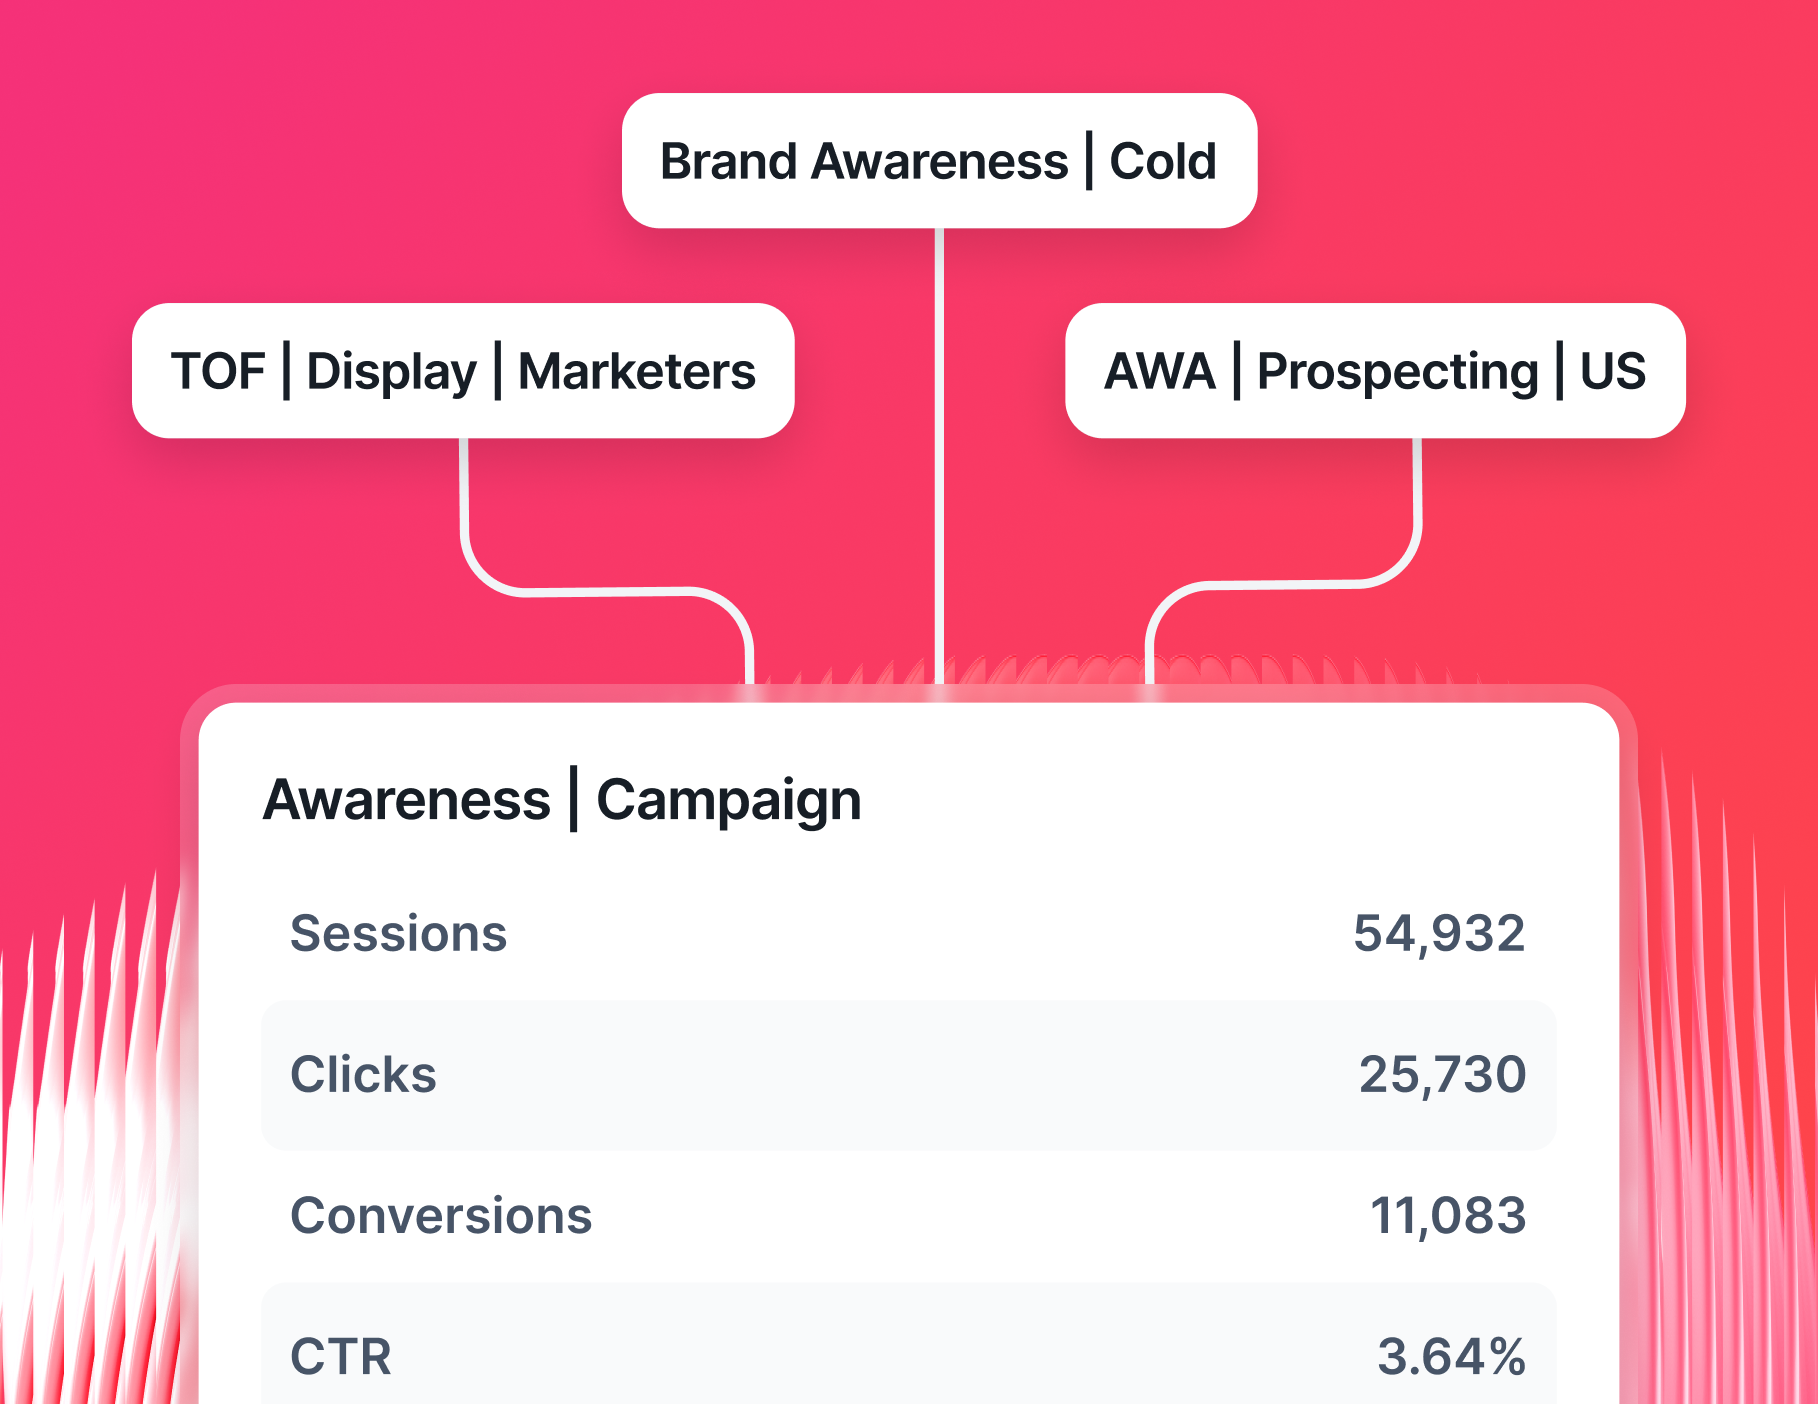
2. Organize and blend your data
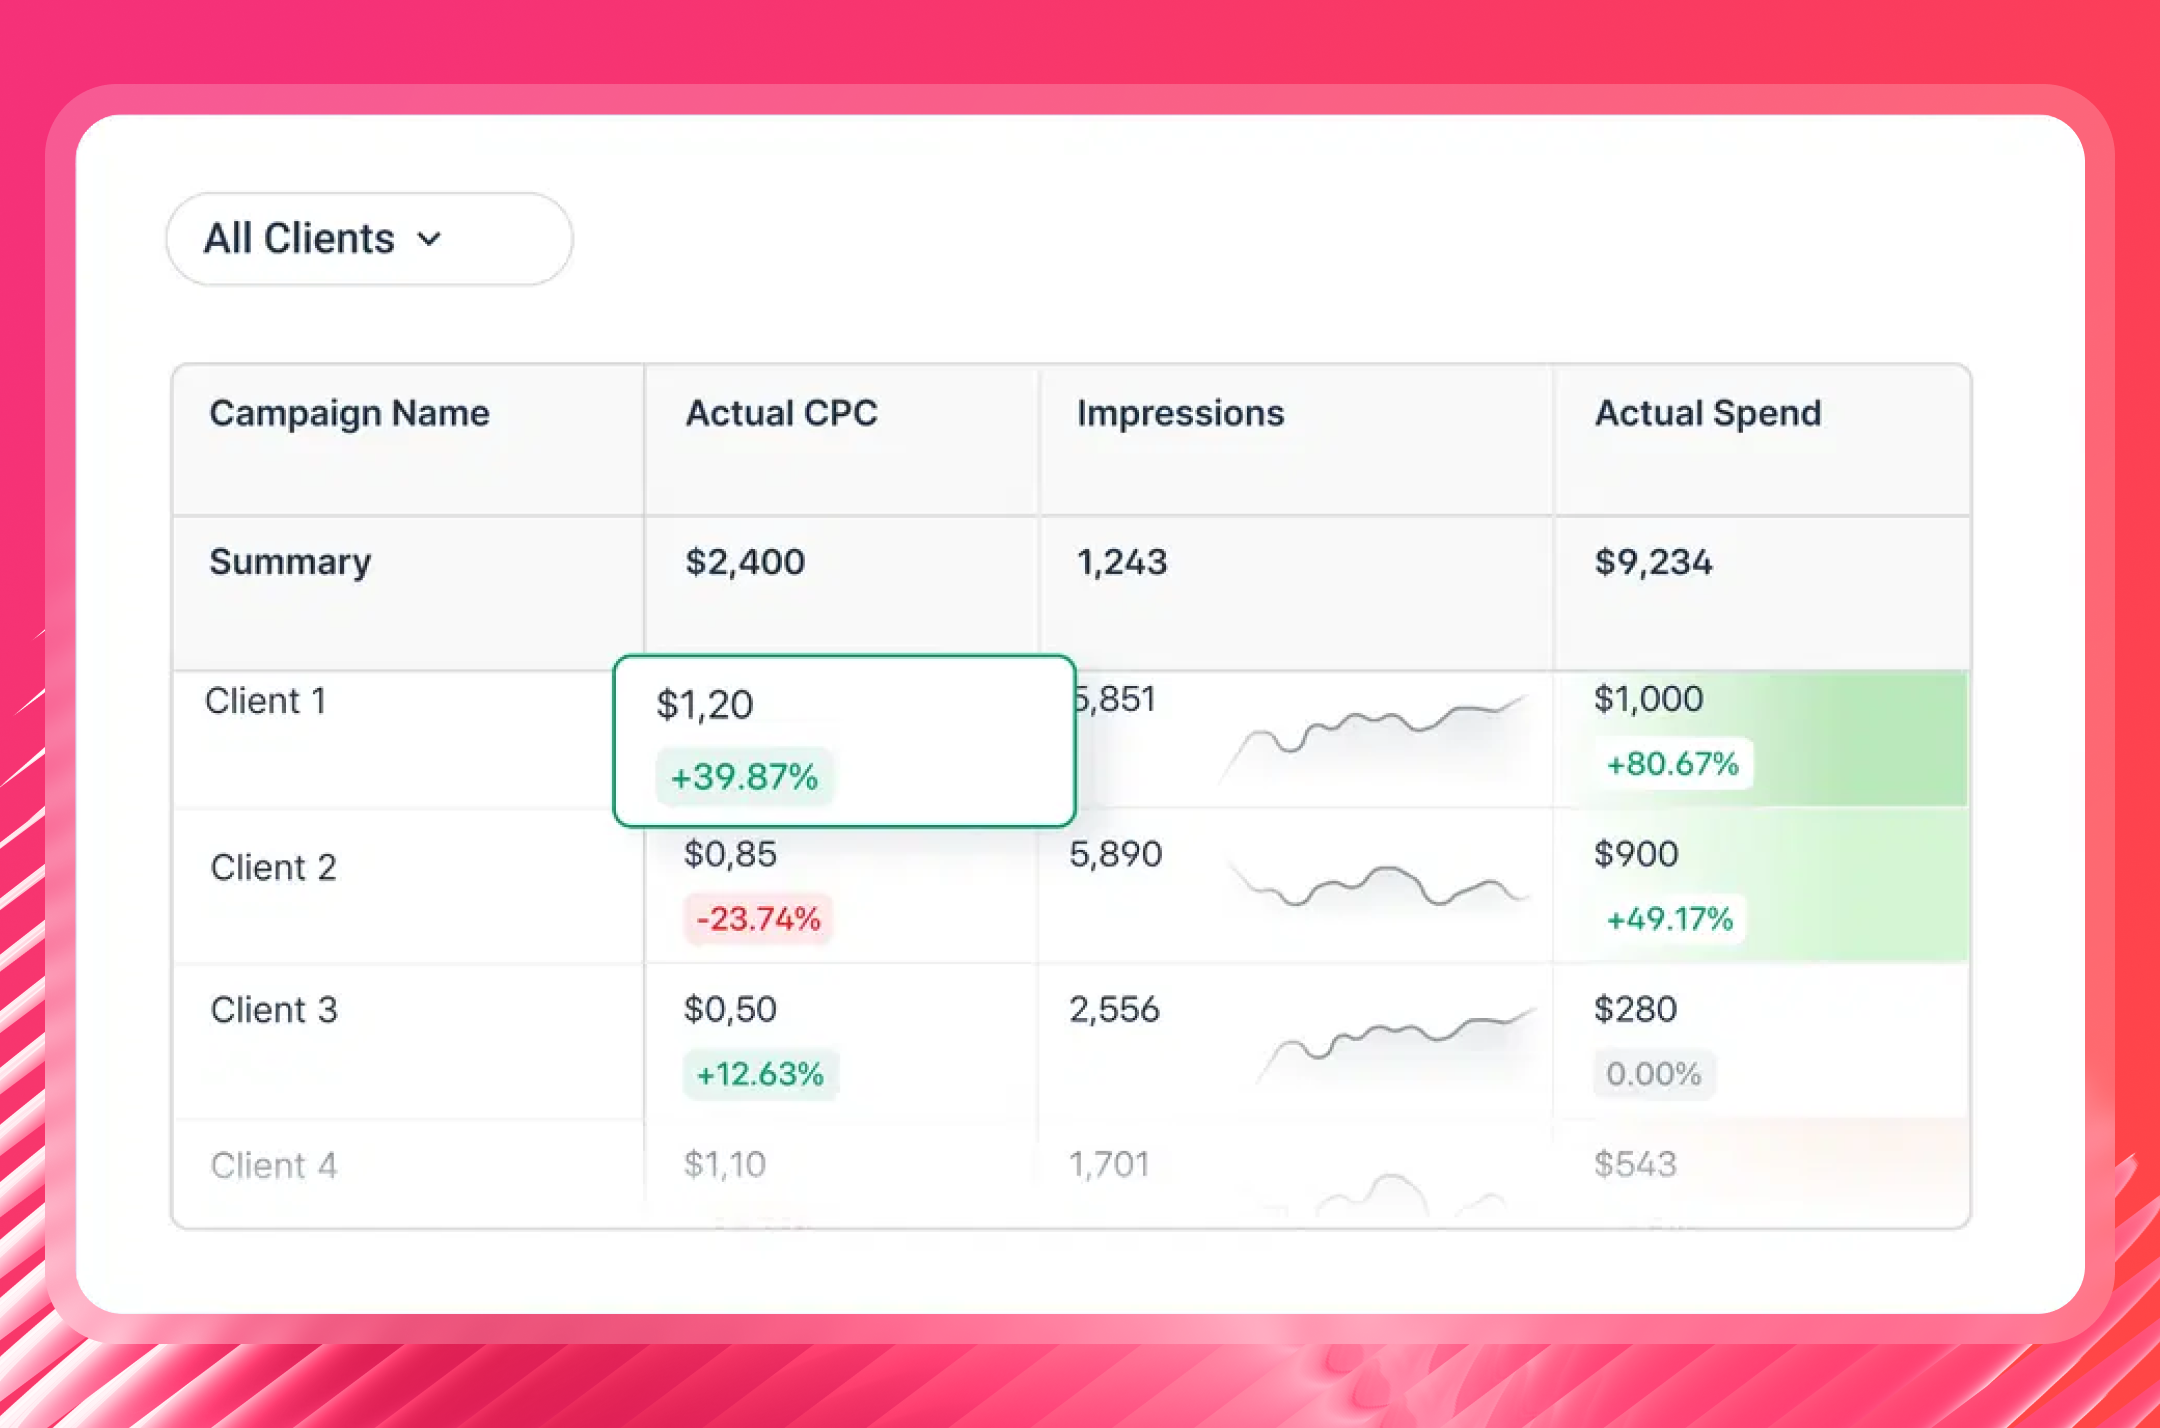
Once your sources are connected, clean things up before building. Standardize campaign naming, align currencies across accounts, and make sure your metrics are structured in a way that makes sense to your team and your clients.
With Whatagraph, you can:
- Group campaigns by channel, objective, geo, or audience
- Filter by platform, device, or custom segments
- Standardize metric naming across different ad accounts
- Blend TikTok Ads data with Meta, Google, and other channels into one unified view
- Organize reports by client, account manager, or region using tags and folders
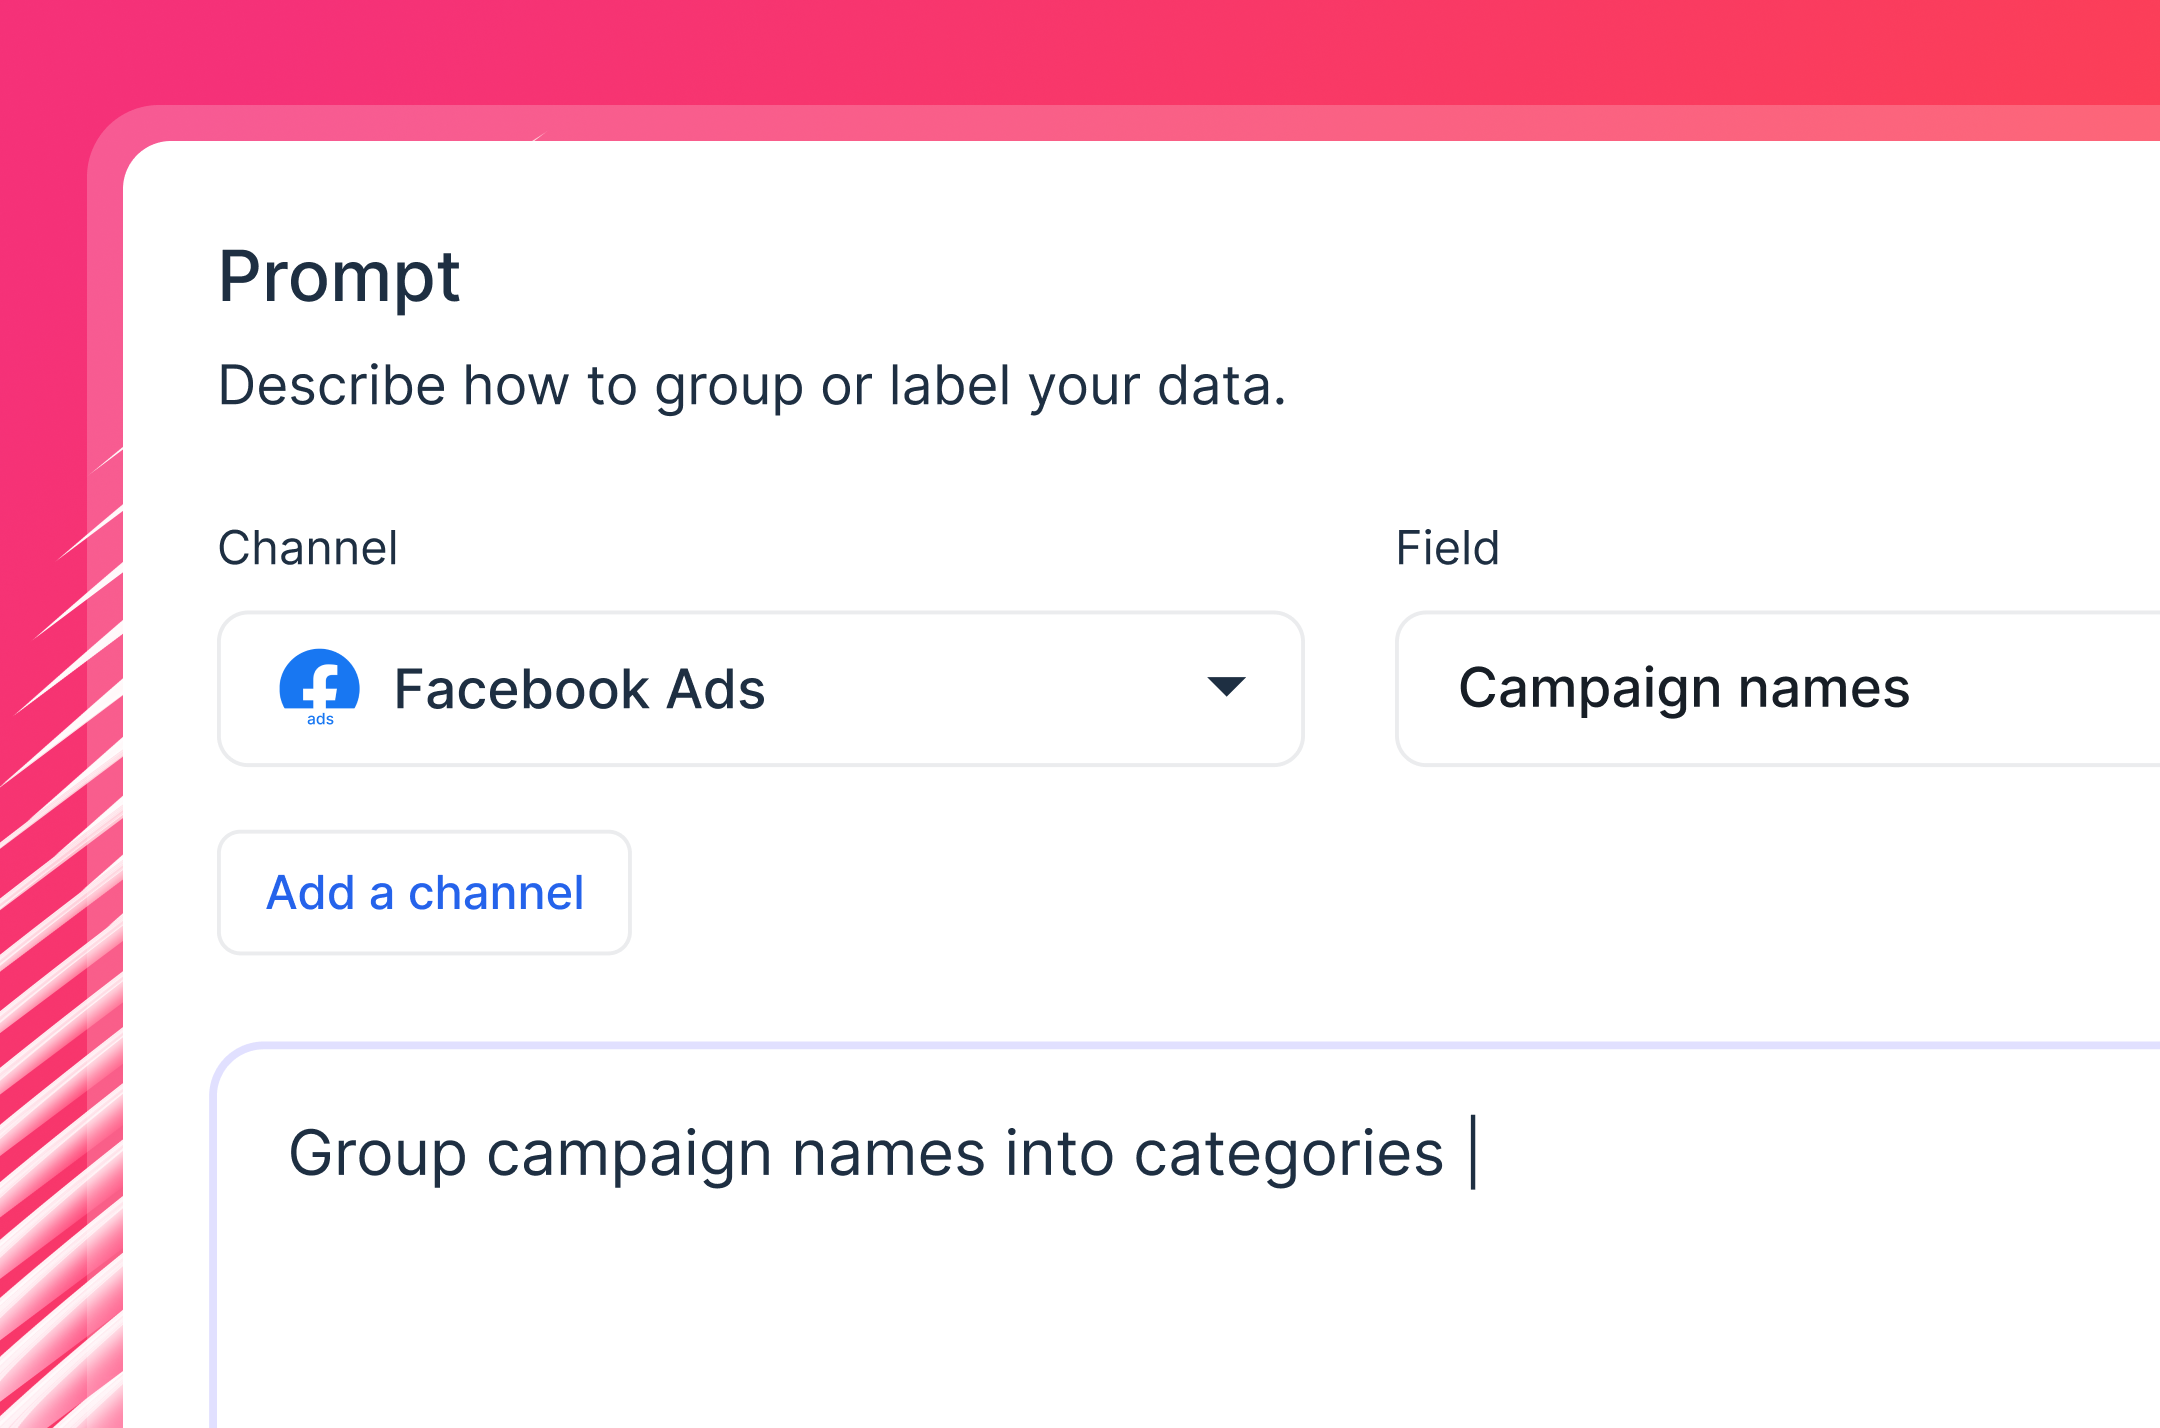
With Whatagraph IQ Dimensions, you skip the manual formula-building entirely. Just describe what you need, and AI handles the rest:
- Build blended metrics instantly. Tell IQ something like "combine TikTok Ads and Meta Ads spend into one total paid social cost," and it creates the metric for you - no formulas needed.
- Create custom metrics. Need blended ROAS across channels, or a TikTok-specific cost per video completion? IQ generates them in seconds.
- Clean up messy campaign names. If your TikTok marketing campaigns are named inconsistently across TikTok accounts, tell IQ how to group them, and it creates a new dimension with consistent naming.
- Normalize data at scale. Group by campaign objective, creative type, or any other dimension that fits your reporting structure - and reuse it across every client report.
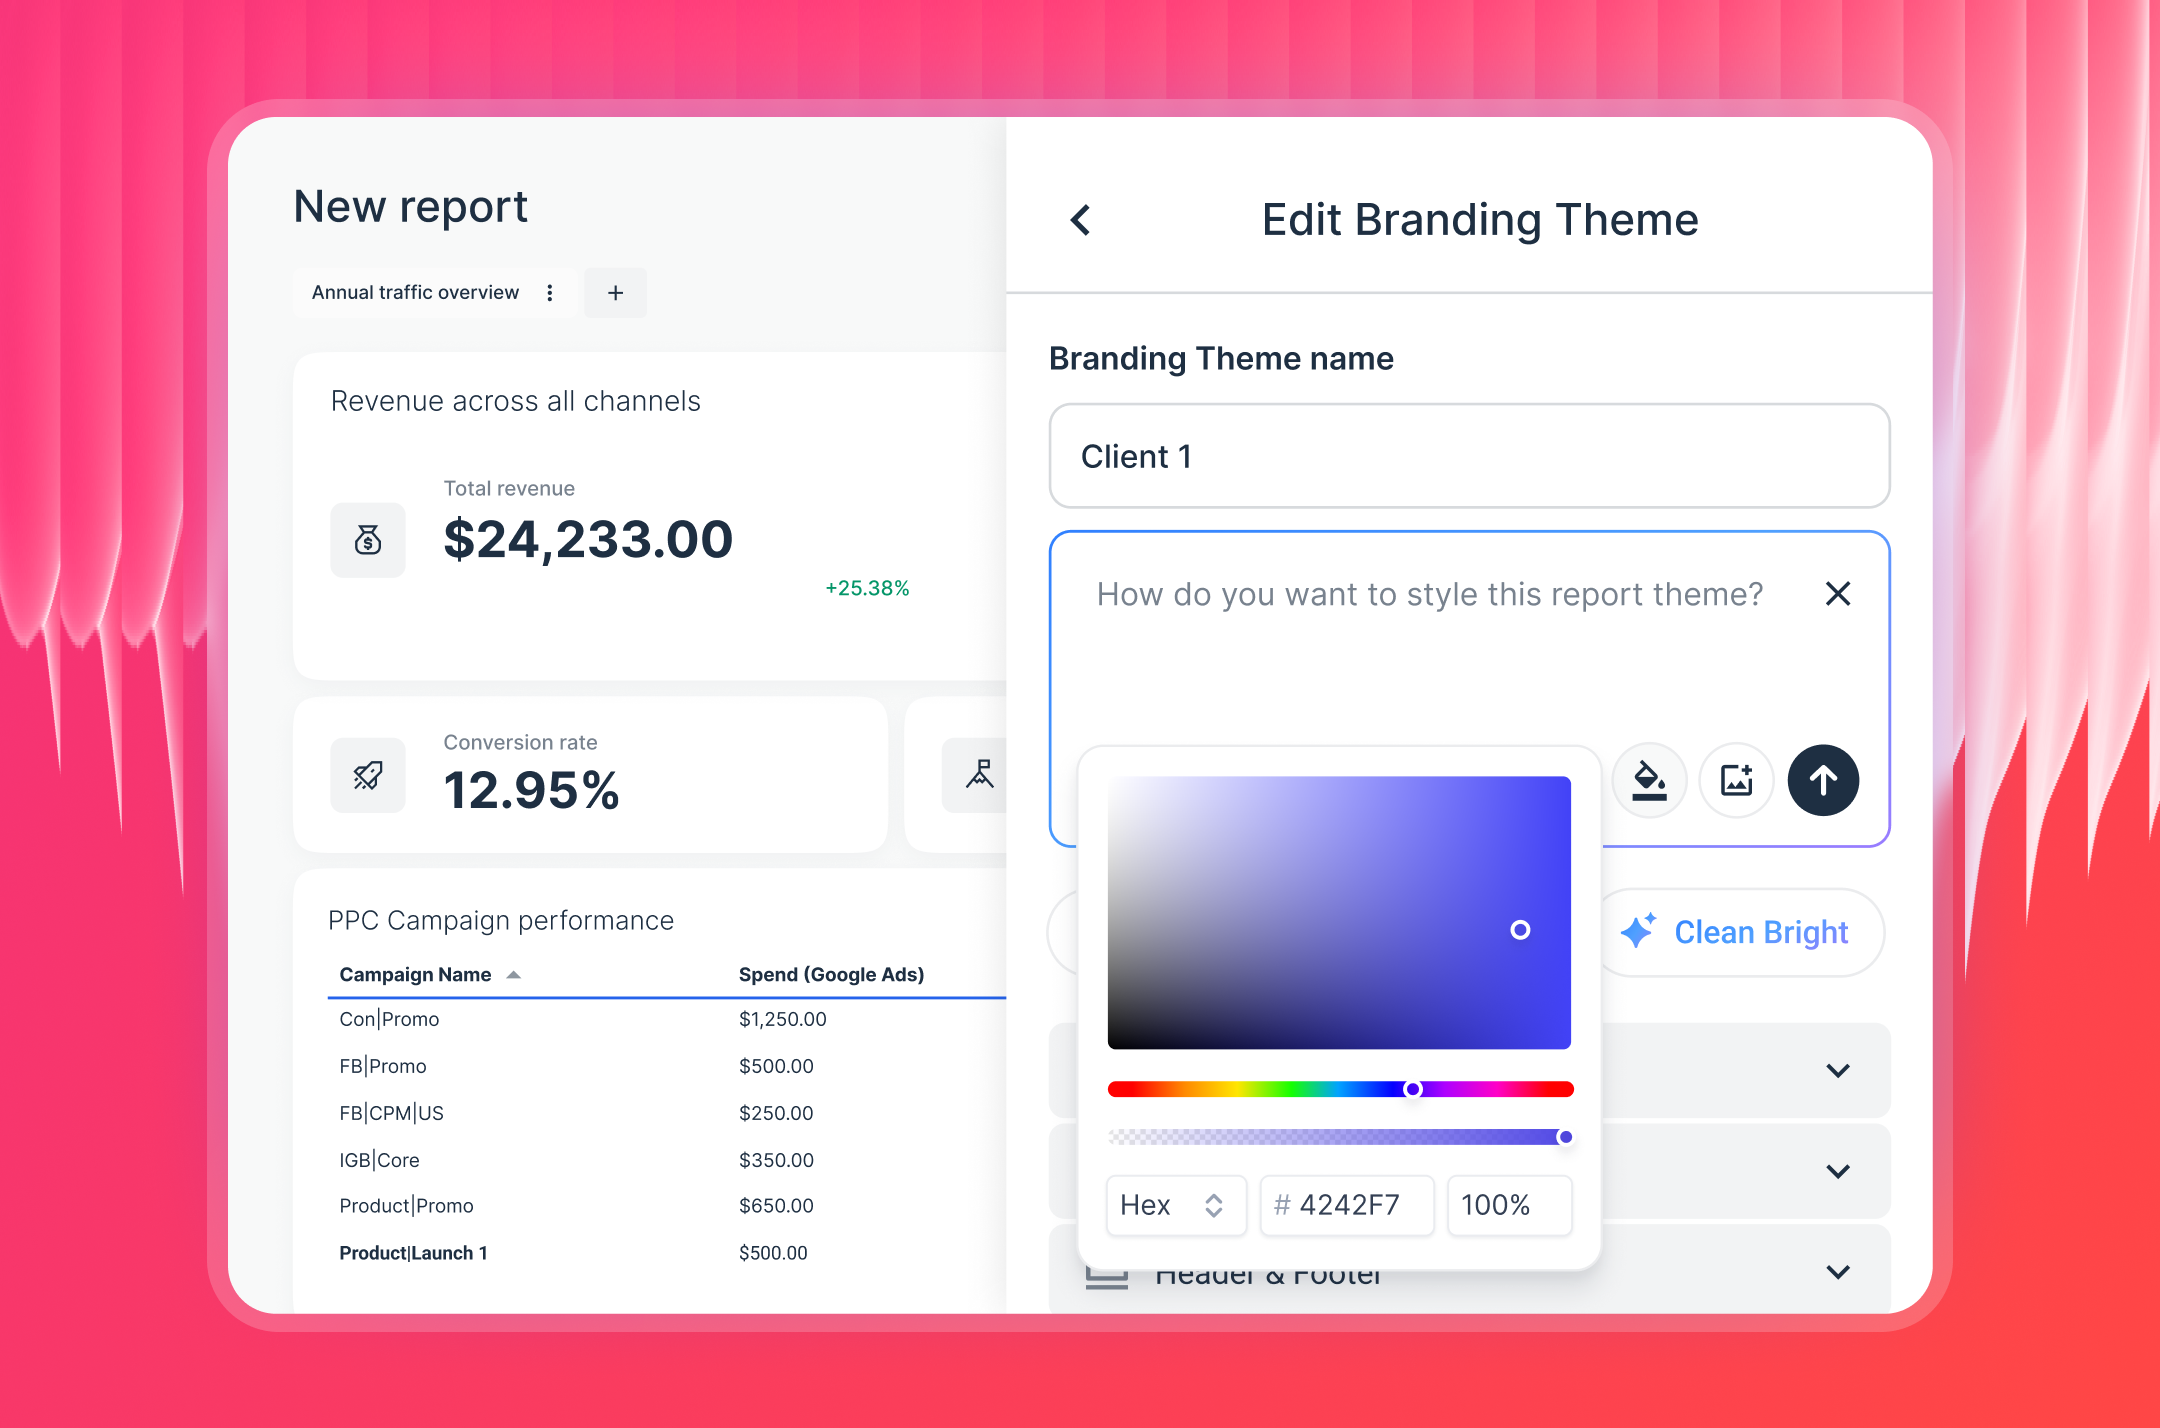
3. Build and brand your TikTok report
With Whatagraph IQ, putting together a client-ready TikTok report is no longer a manual exercise. Just describe what you need, and IQ builds the entire report for you - tabs, charts, KPI widgets, and layout included.
- Generate the full report with one prompt. Type what you want to see, and IQ assembles it in seconds - no dragging, no dropping, no starting from scratch.
- Brand it automatically. Upload a client logo or describe the look you're going for, and IQ Themes applies the right colors, fonts, and styling across the entire report instantly.
- Add written insights without the writing. IQ Summaries generate performance recaps based on the actual marketing data in your report. Edit the output however you like, then send it straight to your client.
Prefer to build manually? Start from a blank canvas and drag and drop widgets onto your report. With every widget, you can:
- Change the label, size, icons, and layout
- Apply custom formulas
- Match color schemes to your agency or client branding
- Set reporting periods, currencies, or hide sections as needed
- Rearrange rows, columns, and headers at any time
Pro tip: Save your finished report as a team template and reuse it across clients. Even better - use linked templates so you only edit the master version once, and every connected client report updates automatically.
4. Monitor TikTok performance across all clients
Want a live view of how all your TikTok campaigns are tracking, without opening individual reports?
Build an internal dashboard in Whatagraph called an “Overview”.
Use Overviews to:
- Track TikTok KPIs across all clients and campaigns in one place
- Flag accounts where spend is high, but conversions are low
- Monitor performance targets and spot issues before clients do
- Set custom goals - like a target CPM or minimum ROAS - and see which accounts are hitting them
This gives your whole team visibility into what's working across the portfolio, without anyone needing to dig through individual reports or log into TikTok Ads Manager.
5. Use AI to answer questions and write performance recaps
Clients don't want to decode a page of charts on their own. They want to know what happened, why it matters, and what you're doing about it.
Whatagraph IQ helps your team deliver that without spending hours writing:
- Generate TikTok campaign summaries based on any data source and time period
- Choose short or long format, adjust tone, and edit before sending
- Ask IQ Chat questions like "show me which TikTok ads are driving the most conversions" and get an instant answer in plain English
You can also enable IQ Chat directly inside a shared client report, so clients can ask their own questions about the data and get answers on the spot - without emailing your team.
As Lars Maat, Co-Founder of Maatwerk Online, shared after rolling out IQ Chat with his team:
Let's say you're in a client meeting and they ask a bunch of questions. Instead of saying 'let me get back to you,' you can just ask the AI chatbot and get the numbers right away. That's really amazing.
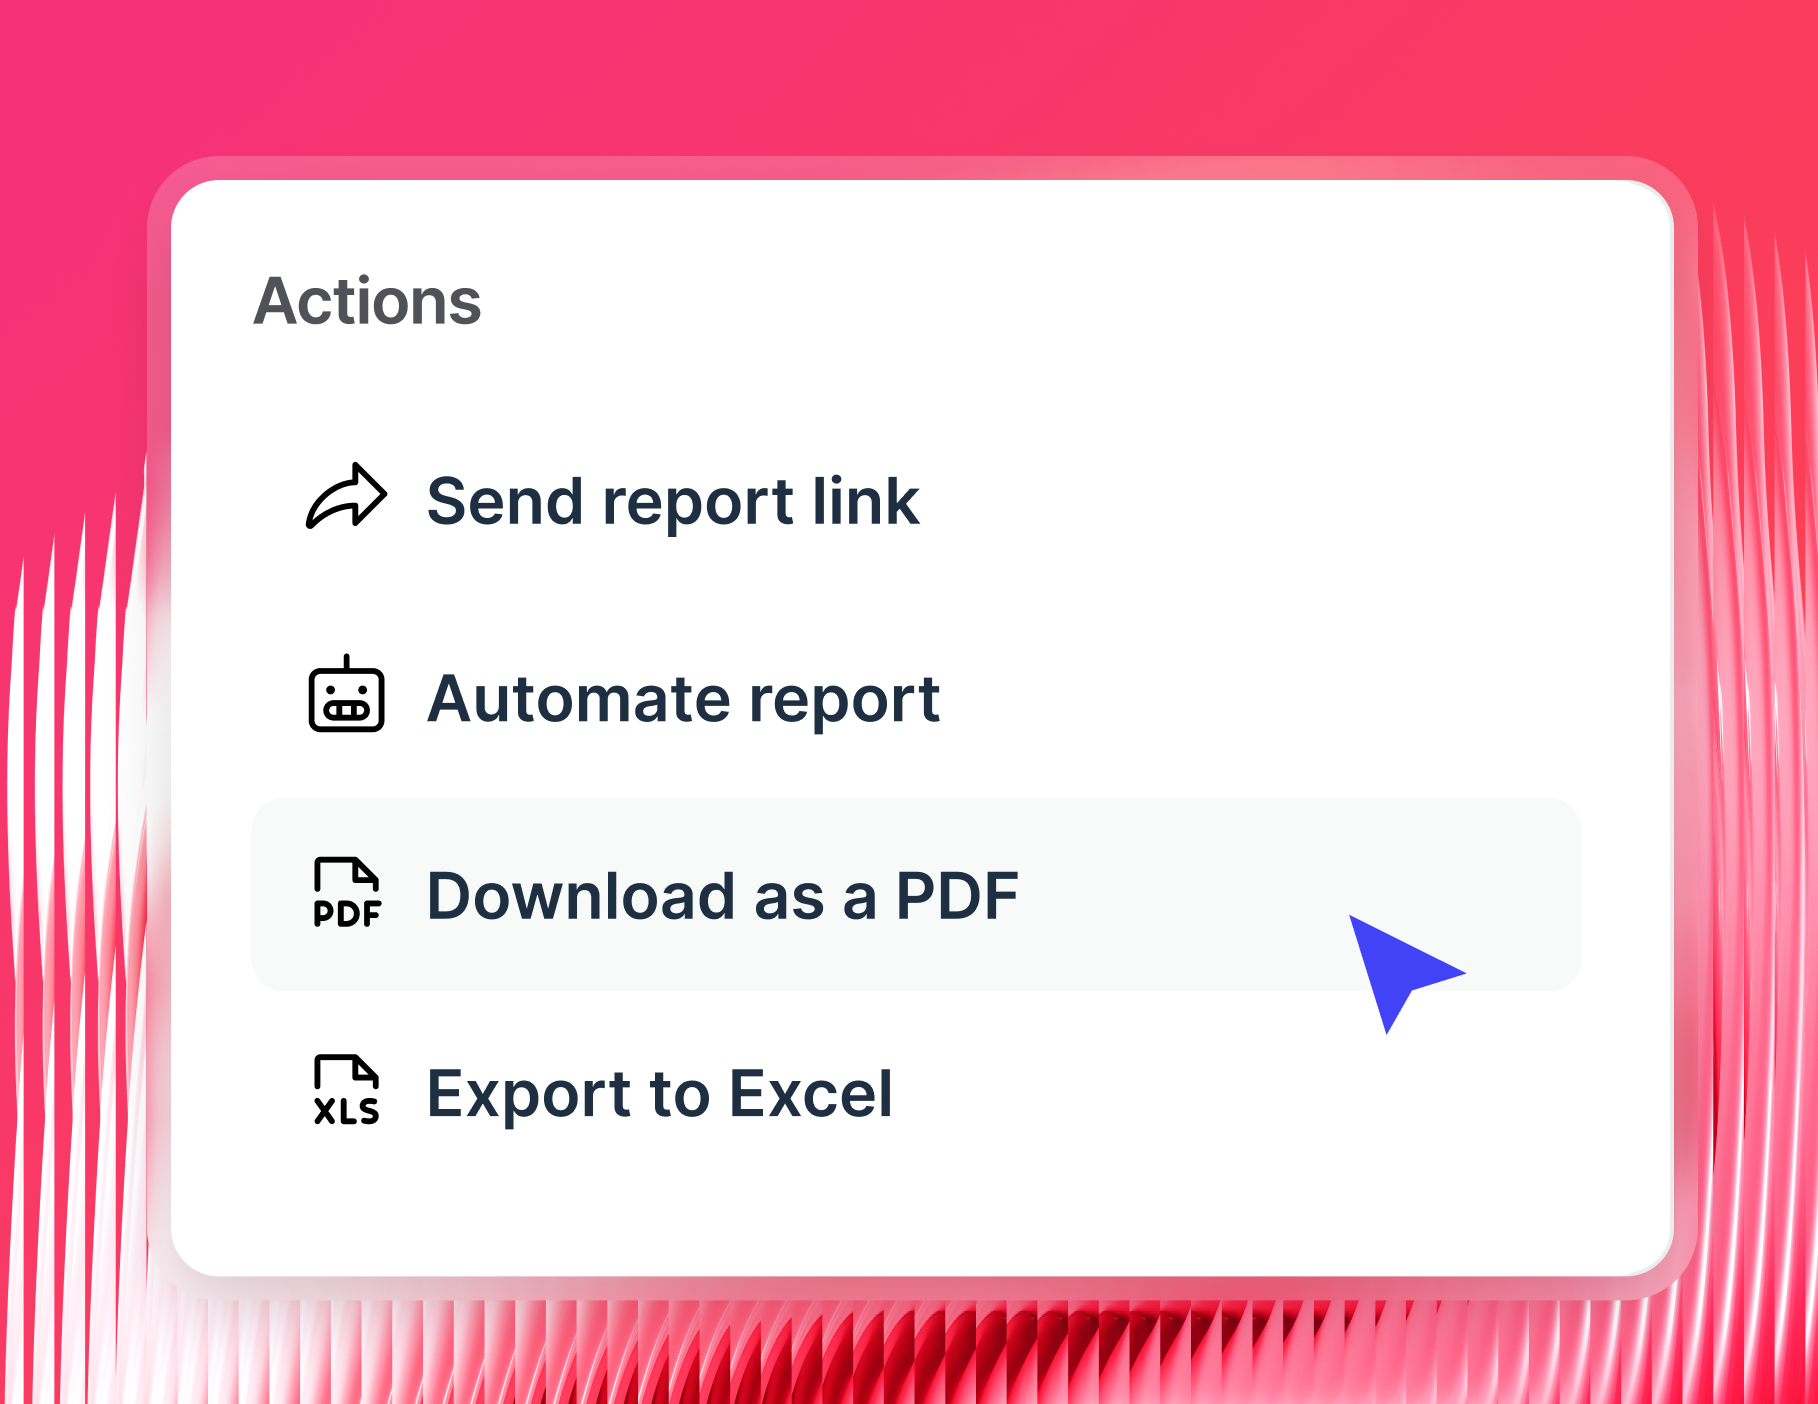
6. Share your TikTok report
Once the report is ready, choose how you want to deliver it:
- Automated email delivery: Schedule reports to send on a specific date, time, and cadence - weekly, monthly, or quarterly
- Slack delivery: Send reports directly to a client or internal Slack channel on your chosen schedule
- Live links: Share a link that updates in real time - clients can check performance any time without logging into anything
- PDF or CSV export: Download for offline use, internal archives, or presentations
- White-label delivery: Send from your own custom domain with your agency branding in place
While automation can send reports out on schedule, make sure to add your own context and recommendations before sending them out.
As Martin Sandgaard, Co-Founder of AdsToGo, puts it:
Reporting with human input is 1000x more valuable than an auto-scheduled report. Context and action plans matter more than the numbers, and most clients don't open or understand reports without that context.
IQ Summaries give you a solid first draft to work from - edit the tone, add your own insights, and make it yours before it reaches the client.