


What is AI reporting?
AI for reporting isn’t just about generating dashboards or reports.
It’s about making marketers’ lives easier by using AI to create, style, and extract insights—without any manual work or technical know-how.
Instead of dragging widgets around, blending data in spreadsheets, or spending hours inside Looker Studio, you can use AI to automate the entire reporting process.
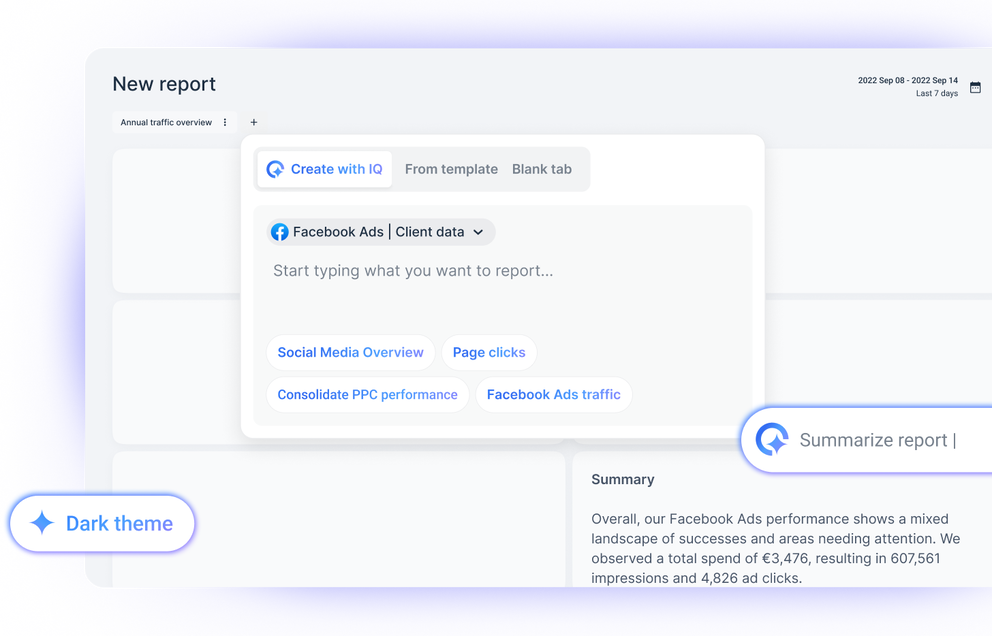
For example, on Whatagraph, you can just ask AI to:
- Create the exact report you want in the exact formats
- Change and edit individual widgets
- Create professional reports from just a screenshot or a prompt
- Blend data and create custom dimensions using AI models
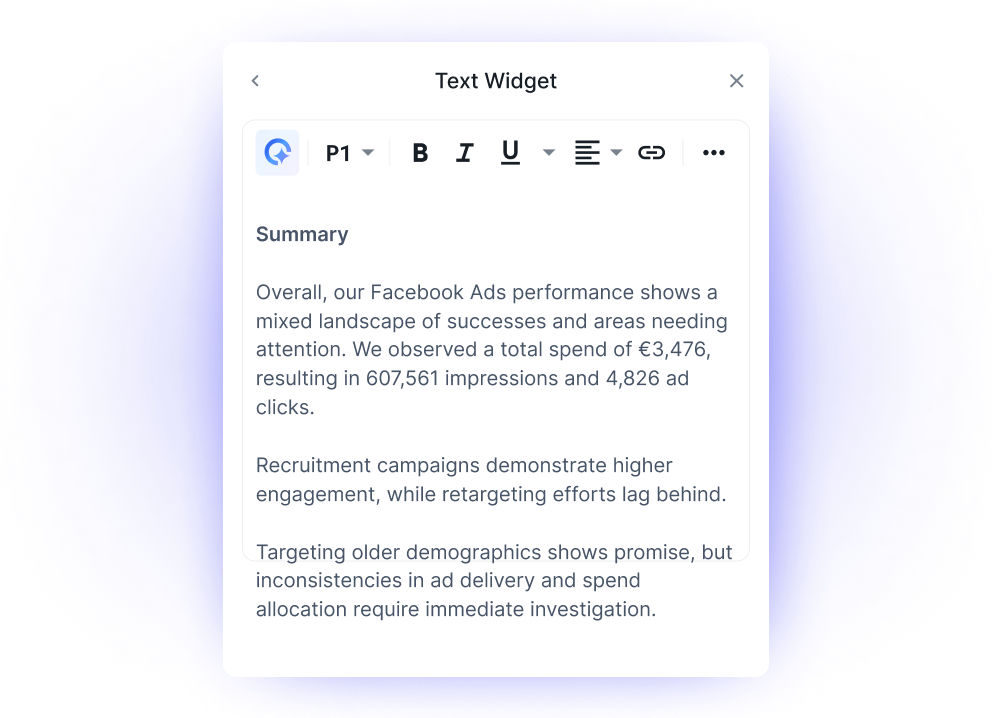
- Write out executive summaries and extract actionable insights
This means you don’t need to pretend to be a data scientist or have any technical background—you can just simply be a marketer and make data-driven decisions, in a quarter of the time.
How is AI used in reporting?
At Whatagraph, we believe that artificial intelligence is ushering in a new era of reporting – the Instant Intelligence Era.
What this means is that AI is helping marketers streamline reporting by:
- Automatically cleaning and transforming data
- Building data visualization dashboards and reports
- Analyzing data on your behalf and giving you valuable insights instantly
- Generating summaries of campaign performance in bulk – ready to be added to your reports or emails
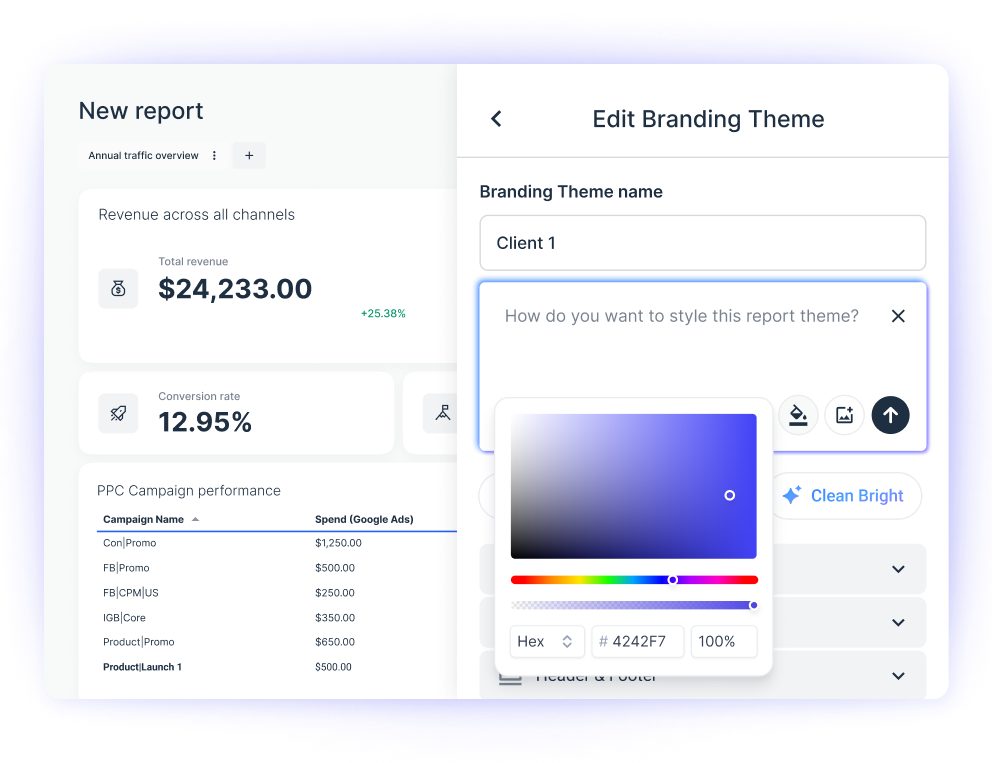
- Styling reports in the exact same way as your brandbook or your client’s in seconds (without having to adjust settings)
That means:
✅ No more manual data blending, tagging, or working with codes
✅ No need to both with drag-and-drop widgets or report templates – AI will build a report for you
✅ No need to dig through dozens of reports or wait for the data analyst to get back to you – you get actionable insights instantly
And this is not a “dream”; it’s a reality with Whatagraph.
At Whatagraph, we bake this functionality into every step of your reporting process. You connect your data once. Then:
- AI handles data integration and formatting.
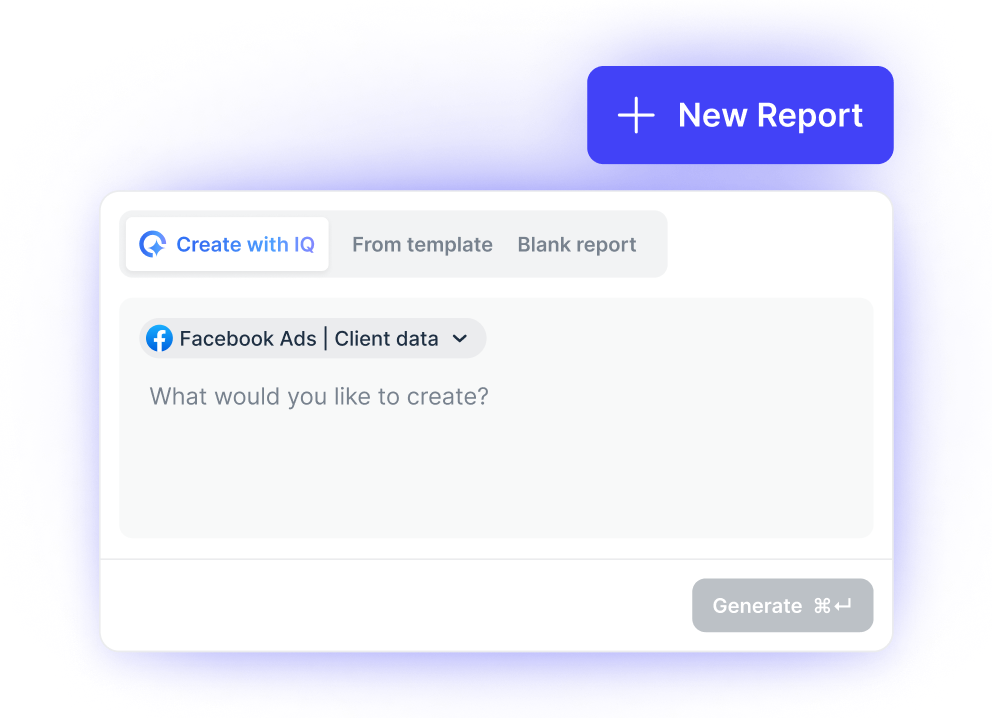
- You type a prompt, and your report builds itself.
- Insights and summaries are generated automatically.
- Custom dimensions, styling, and edits happen in natural language.
It’s real-time marketing intelligence, not just report generation.
Because in the Instant Intelligence Era, you shouldn’t spend your days building dashboards—you should be making informed decisions and driving growth.
How can AI improve data reporting processes?
Traditional reporting tools make you jump through hoops—manually pulling data, blending it in spreadsheets, dragging widgets around, and writing explanations from scratch.
AI flips that process on its head.
With Whatagraph, AI improves every part of the data reporting and report creation workflow:
1. It automates the reporting process
You don’t need to build dashboards manually anymore. Just tell Whatagraph what structured report you want, and it’s generated for you in seconds—widgets, layout, branding, and all.
2. It simplifies data analysis
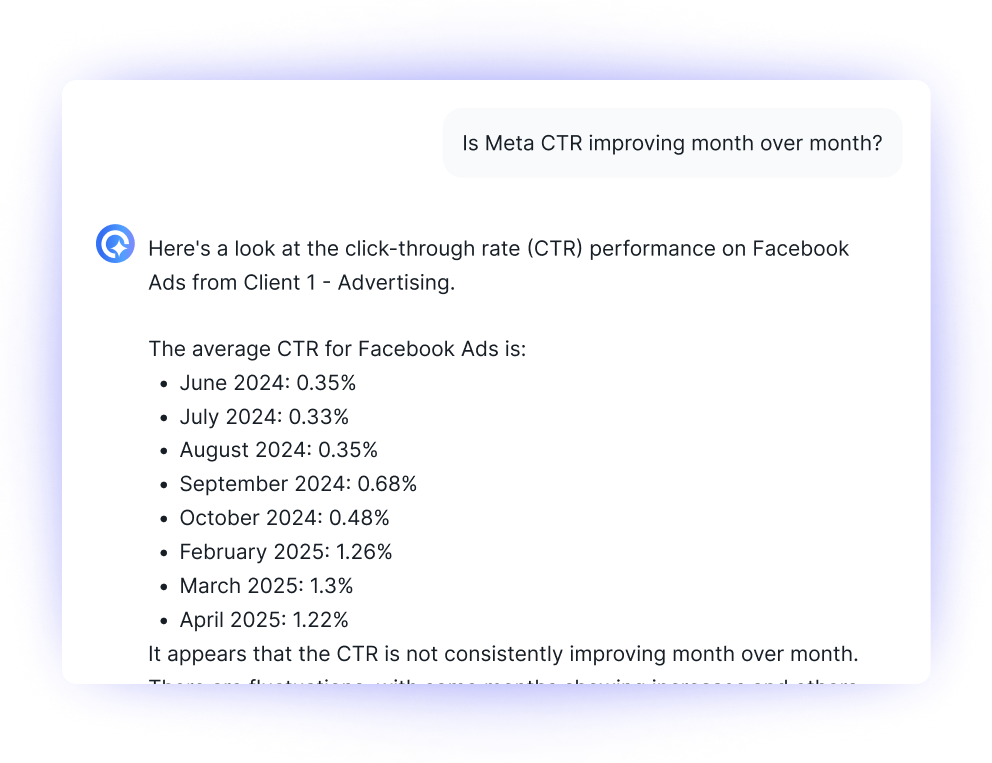
Don’t waste time digging through complex data. Ask our AI Assistant chatbot anything about your performance, and get instant, clear answers you can act on.
3. It gives you instant insights
Our AI-generated summaries turn raw data into client-ready insights—complete with wins, recommendations, and opportunities—across 18 languages.
4. It cleans and organizes your data
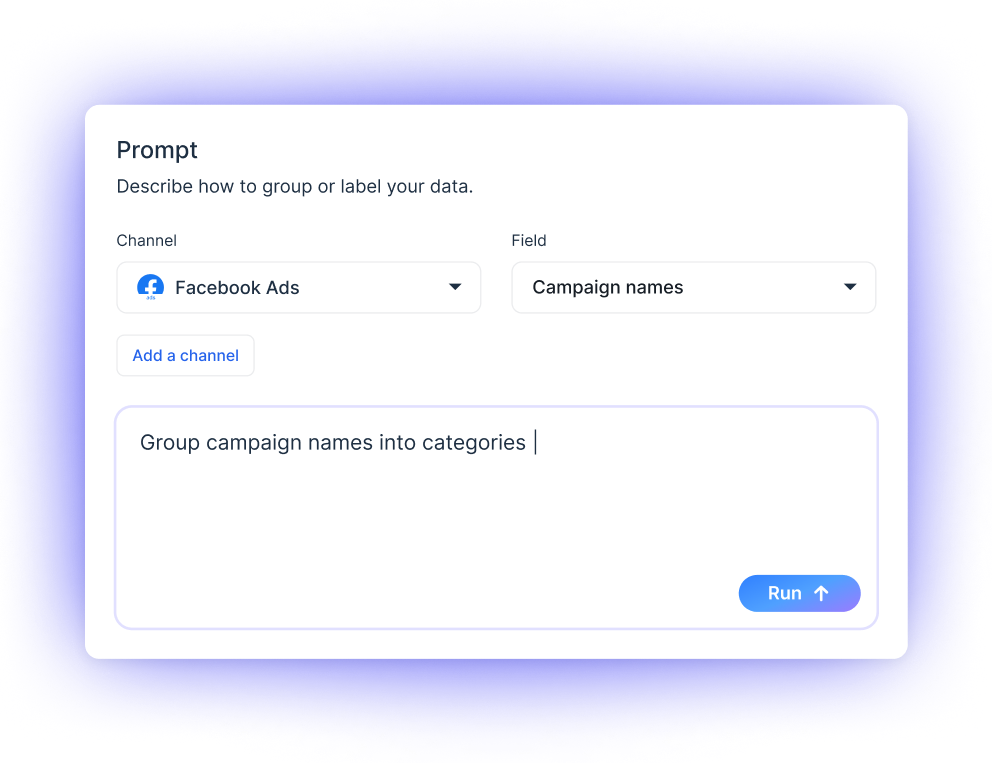
Whatagraph’s AI helps you standardize messy data, create custom dimensions, and blend sources—so you always get clean, consistent outputs without coding.
5. It makes reports look good (and on-brand) instantly
Want your reports to match your client’s brandbook? Upload a screenshot or type in a prompt—our AI applies the right fonts, HEX codes, and layouts in 3 seconds.
6. It speeds up decision making
When AI handles the grunt work, your team can stop being part-time data engineers and start making more data-driven decisions, faster.
These AI reporting features not only save hours each week, but also help your team surface what actually matters—without digging through dashboards.
Why use an AI report generator?
The biggest reason to use an AI report generator is to protect your time, brainspace, and energy.
Using an AI report generator (instead of manual reporting tools) means:
- You get hours of your time back every week to focus on strategy, growth, and actual marketing, not wrangling with connectors or templates.
- You deliver faster, clearer reports your team and clients can understand instantly, no need to explain every chart.
- You reduce human error by automating the most repetitive, time-consuming tasks in your reporting process (like building graphs from scratch).
- You don’t have to be technical or rely on analysts to blend data, create formulas, or build visualizations.
- You look more professional with consistently styled, branded reports that take seconds—not hours—to put together.
This means you spend less time on reporting and more time on optimizing campaigns, building relationships with clients, and growing your agency.
In fact, with a high-quality AI marketing report generator like Whatagraph, Florida-based agency—Peak Seven—saved up to 63 hours per month on reporting, translating into $9K+ savings for each client per month.
On top of this, Whatagraph has also democratized insights for both clients and teams and helped strengthen trust and transparency.
Kim Strickland, Digital Marketing Specialist at Peak Seven, says:
Whatagraph has helped everyone on our team get on the same page about clients, what’s important, and how to talk to them. Our relationships with clients have been amazing, and we’ve even been able to retain them longer. It's now our Bible—both for our clients and teams.
What are AI report generators?
AI report generators help marketers skip the manual grunt work of reporting. Instead of pulling data from different platforms, building dashboards from scratch, or trying to make sense of cluttered spreadsheets, AI reporting tools do it for you—automatically.
They pull your data together, organize it, and generate reports, summaries, or insights based on what you actually need to know. This saves you massive time, brainspace, and money—and allows you to focus on what you do best.
What are the best AI report generators?
Here are three top-rated AI-powered tools tailored to different needs:
1. Whatagraph: Best AI report generator for marketing agencies and in-house teams
Whatagraph is built for marketers, not data scientists.
It’s the all-in-one marketing intelligence platform that makes it refreshingly easy to connect, organize, report, and act on your marketing data.
Here’s what makes Whatagraph stand out:
- Create reports from a single prompt. Just tell Whatagraph what you want and it will build an AI-generated report—widgets, layout, metrics, visuals, and all.
- Customize styling instantly. Upload a screenshot of your brand or type a prompt, and Whatagraph will apply the right fonts and colors in seconds.
- Summarize and explain your data. Get auto-generated summaries, wins, recommendations, and trends in plain language—ready for clients or your CMO.
- Ask anything. The built-in AI chat assistant pulls from your data sources to answer questions like “What campaign drove the most ROI last quarter?”
- Blend and clean your data. Create unified metrics and dimensions across platforms without writing formulas or fixing raw data manually.
- Share automated reports how you want. PDF, Excel, live dashboard, email—every stakeholder gets the format they need, without extra effort.
And unlike other automated reporting tools, Whatagraph builds and maintains its own native integrations, and offers a consistent 30–minute data refresh rate across all your sources, accounts, and blends.
This means your reports always show accurate and up-to-date data—without having to do manual data refreshes or fixing broken connections.
If you’re part of a marketing team or agency that wants to scale without scaling effort, Whatagraph is the AI-powered reporting tool to get you there.
Pricing:
Whatagraph offers four pricing plans as of March 2026:
- Forever-free – lets you get started at no cost, with 5 source credits, Whatagraph IQ basics, templates, and live chat support.
- Start ($229/mo billed annually) – includes 20 source credits and essential integrations
- Boost ($463/mo billed annually) – jumps up to 50 source credits, adds advanced integrations, custom metrics & dimensions, white-labeling, and performance overview with alerts
- Max (custom pricing) – for enterprise/complex teams, with custom source credits, premium integrations, data groups and blends, Whatagraph IQ+, SSO, and dedicated Customer Success Manager
2. Piktochart: Best AI-driven report generator for freelancers and small teams
Piktochart is a simple yet powerful AI tool for generating reports, infographics, and visuals with zero design background required. You can start with a prompt or template, then drag, drop, and customize until your report looks just right.
It’s ideal for freelancers or small teams that want polished visuals fast, but don’t need deep data integrations or complex dashboards.
Best for: Non-technical users, visual content, and lightweight reporting needs.
Pricing:
- Free plan: 2 PNG downloads, all templates, 100MB storage
- Pro: $14/user/month – includes 1000 AI credits, 100GB storage
- Business: $24/user/month – adds brand kits, PDF export, 250GB storage
- Enterprise: Custom pricing with dedicated support and custom templates
3. Tableau: Best AI-based business intelligence tool for enterprises
Tableau is a business intelligence heavyweight with AI reporting capabilities like Tableau Pulse and Tableau Agent. These features help teams clean, explore, and visualize complex datasets using natural language and predictive analytics.
It’s great for enterprise-level reporting and deeper data analysis, but it requires upfront setup, clean data, and technical users to unlock its full potential.
Best for: Data teams and organizations with advanced reporting needs and large datasets
Pricing:
- Viewer: $35/user/month
- Explorer: $70/user/month
- Creator: $115/user/month
(All plans billed annually)
Here’s a quick comparison table of these three AI reporting solutions:
| Tool name | Best for | Key benefit |
| Whatagraph | Marketing agencies and in-house marketers | AI-built, styled, and summarized reports in seconds. User-friendly interface |
| Piktochart | Freelancers and small teams | Easy-to-use and relatively affordable |
| Tableau | Enterprises and data teams | Deep AI-powered data analytics |