Challenges
The Need for Reliable Systems and Alignment Between Teams and Clients
To drive leads and sales for clients, Peak Seven relies on two key teams: Accounts and Digital. At the center of the two is Kim Strickland, Digital Marketing Specialist at Peak Seven.
Kim started out as a Project Manager and later an Account Executive, where she experienced how chaotic reporting can be.
At the time, Peak Seven didn’t yet have a dedicated person to bridge Accounts and Digitals, and reporting would often fall through the cracks.
Account Executives scrambled to create reports on the fly, while Digital Specialists were pulled away from their key tasks to explain the data to other teams.
Reports were data heavy and insights were muddled. Internal teams struggled to see what was working, what wasn’t, and how to improve performance. In turn, clients struggled to understand the impact the agency was driving.
“I realized we needed a dedicated person for reporting because it’s so important in communicating with our clients,” Kim remarked.
This was when she stepped into her role as a Digital Marketing Specialist, and made it her mission to bridge the gap between Accounts, Digital, and clients.
But there was just one problem.
Looker Studio Woes
Previously, the team was using Looker Studio to create reports and Funnel and Supermetrics to push non-Google data into Looker.
This entire setup was slow, unreliable, and riddled with issues.
“Looker Studio was slow and always breaking. The data wouldn’t pull through, or it would pull through incorrectly,” Kim recalled.
A huge chunk of Kim’s time went to triple-checking the data on reports against the data on source platforms like Supermetrics or Meta, rather than analyzing data or communicating with clients.
Filters had to be inspected, connections re-verified, and date ranges checked—all to catch errors that would inevitably creep in week after week.
“It was just time consuming, frustrating, and a constant guessing game,” Kim stated.
Creating reports on Looker was equally painful. Even with templates, it took hours for Kim to manually customize the tables, widgets, and layouts.
“The first report I created on Looker Studio took me 40 hours. It’s just not a very user-friendly system,” she remarked.
The challenges didn't stop with the internal teams—clients felt the frustration too.
Clients wanted to track their accounts’ performance in real time, but broken data made that impossible. Worse, when errors popped up, it left clients questioning the entire report.
“At that point, Looker Studio was useless,” Kim said plainly. “If you can’t trust it, and you’re constantly fixing it, what’s the point of using it?”
This was when she realized something needed to change.
Looker Studio was slow and always breaking. The data wouldn’t pull through, or it would pull through incorrectly. It was frustrating, time-consuming, and a constant guessing game.
Solution
A Single Source of Truth for Clients and Teams
Kim set out to replace Looker Studio, and her priorities were clear: she wanted a tool that was easy to use, visually appealing, and capable of showcasing top-line KPIs for clients.
After testing several platforms, including TapClicks and Domo, she found the perfect fit in Whatagraph.
“The first report I built on Whatagraph was amazing. It was so easy to build,” Kim raved.
Unlike Looker Studio, she didn’t need to waste hours building everything from scratch. It was all pre-made, and all she needed to do was drag and drop widgets onto her report canvas.
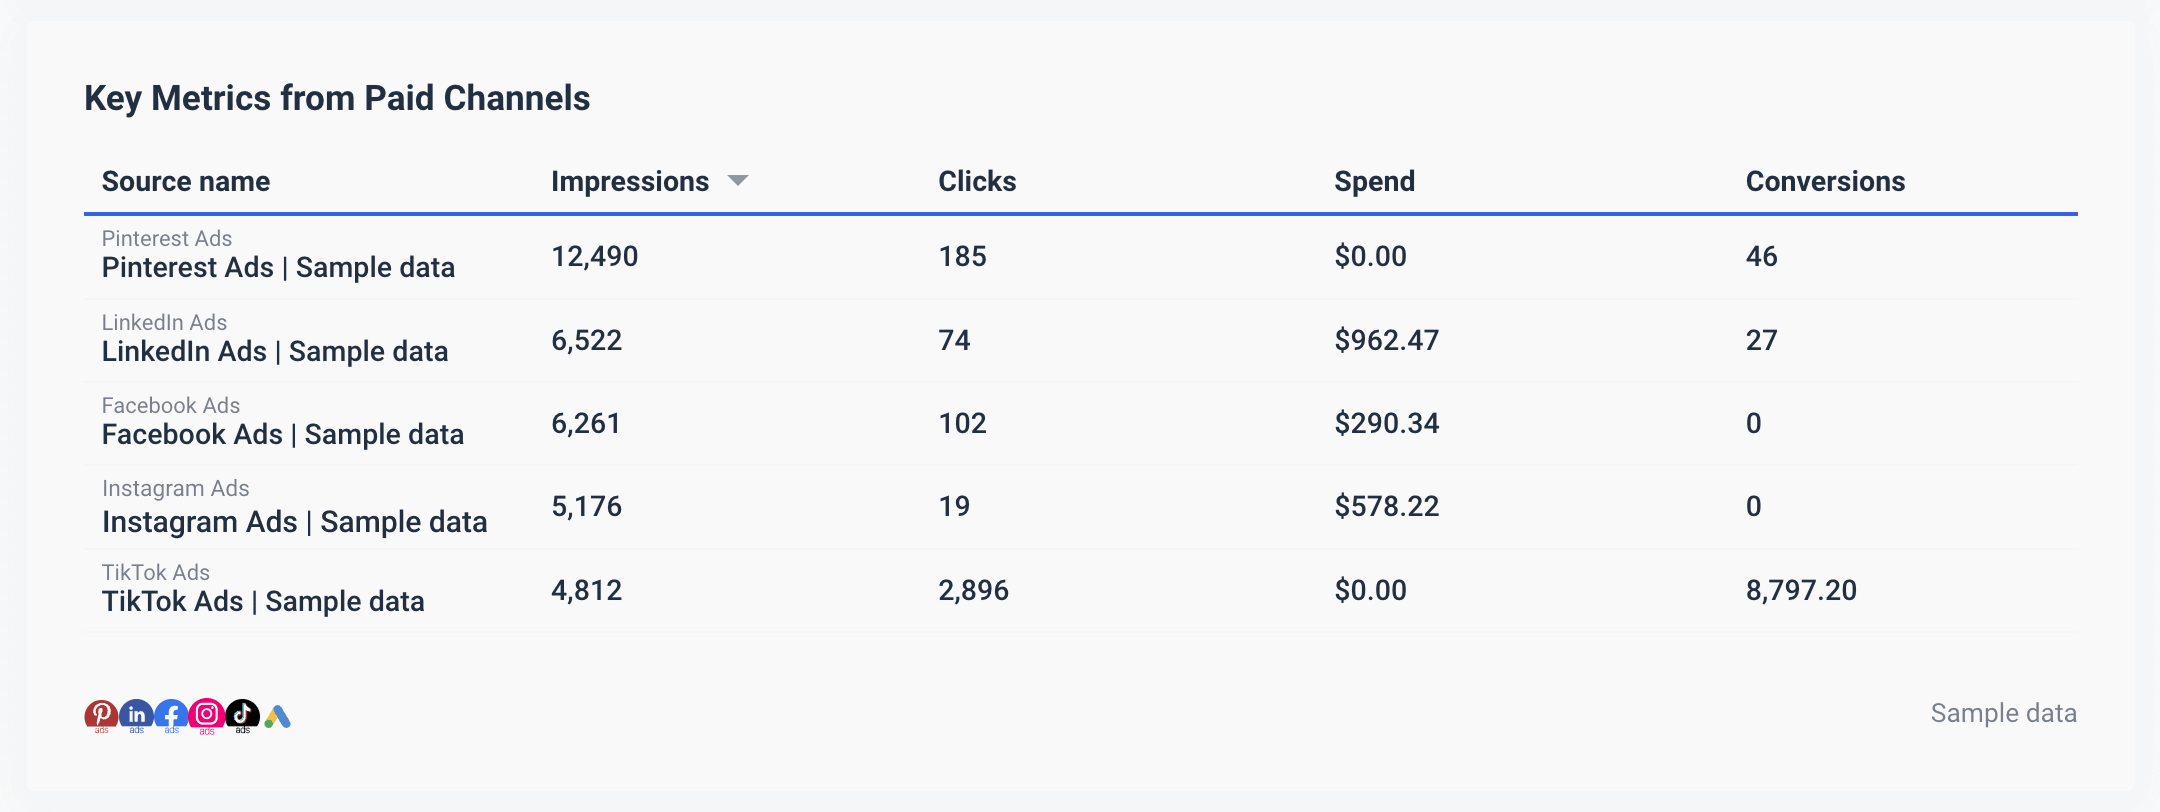
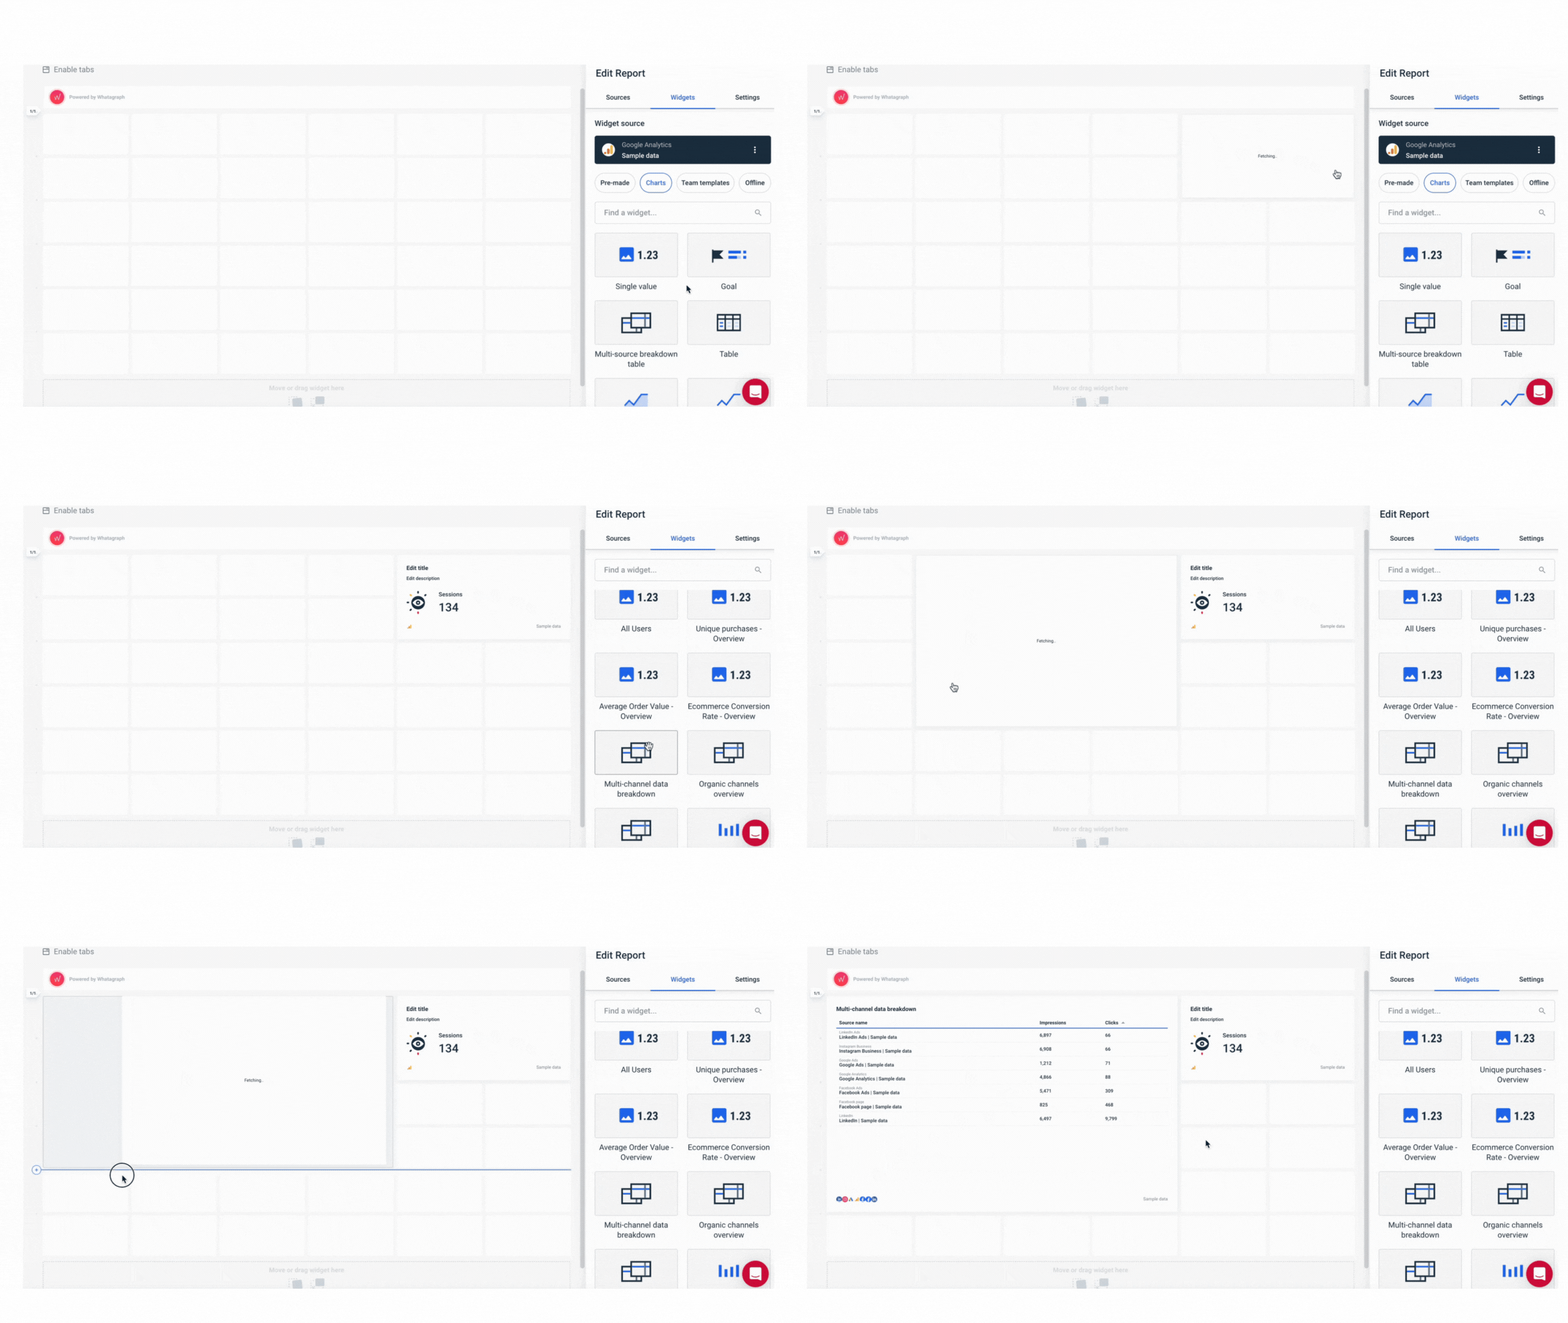 But the biggest “Aha” moment for Kim was our multi-source breakdown tables. With this widget, she could see any metrics from any sources in one table. This was exactly what she needed.
“I immediately knew Whatagraph was going to save us a lot of time, and that we were going to have accurate reporting,” Kim noted.
From there on, Kim set out to onboard Whatagraph, and she was pleasantly surprised at how easy the process was. All she needed to do was create the first three reports and connect all of the data sources.
In fact, the migration from Looker Studio only took a couple of hours.
Kim also had a dedicated Customer Success Manager (our amazing Misha Johanna) who helped her build reports for clients and organize them into tags and folders.
Whatagraph also made it really easy for Kim to start creating reports on her own. She first used our Smart Builder to automatically create reports, but as she got more familiar with the platform, she started building her own.
She experimented with the report structure and layout, and once she found the ideal version, she saved that report as a template so she could re-use it for clients.
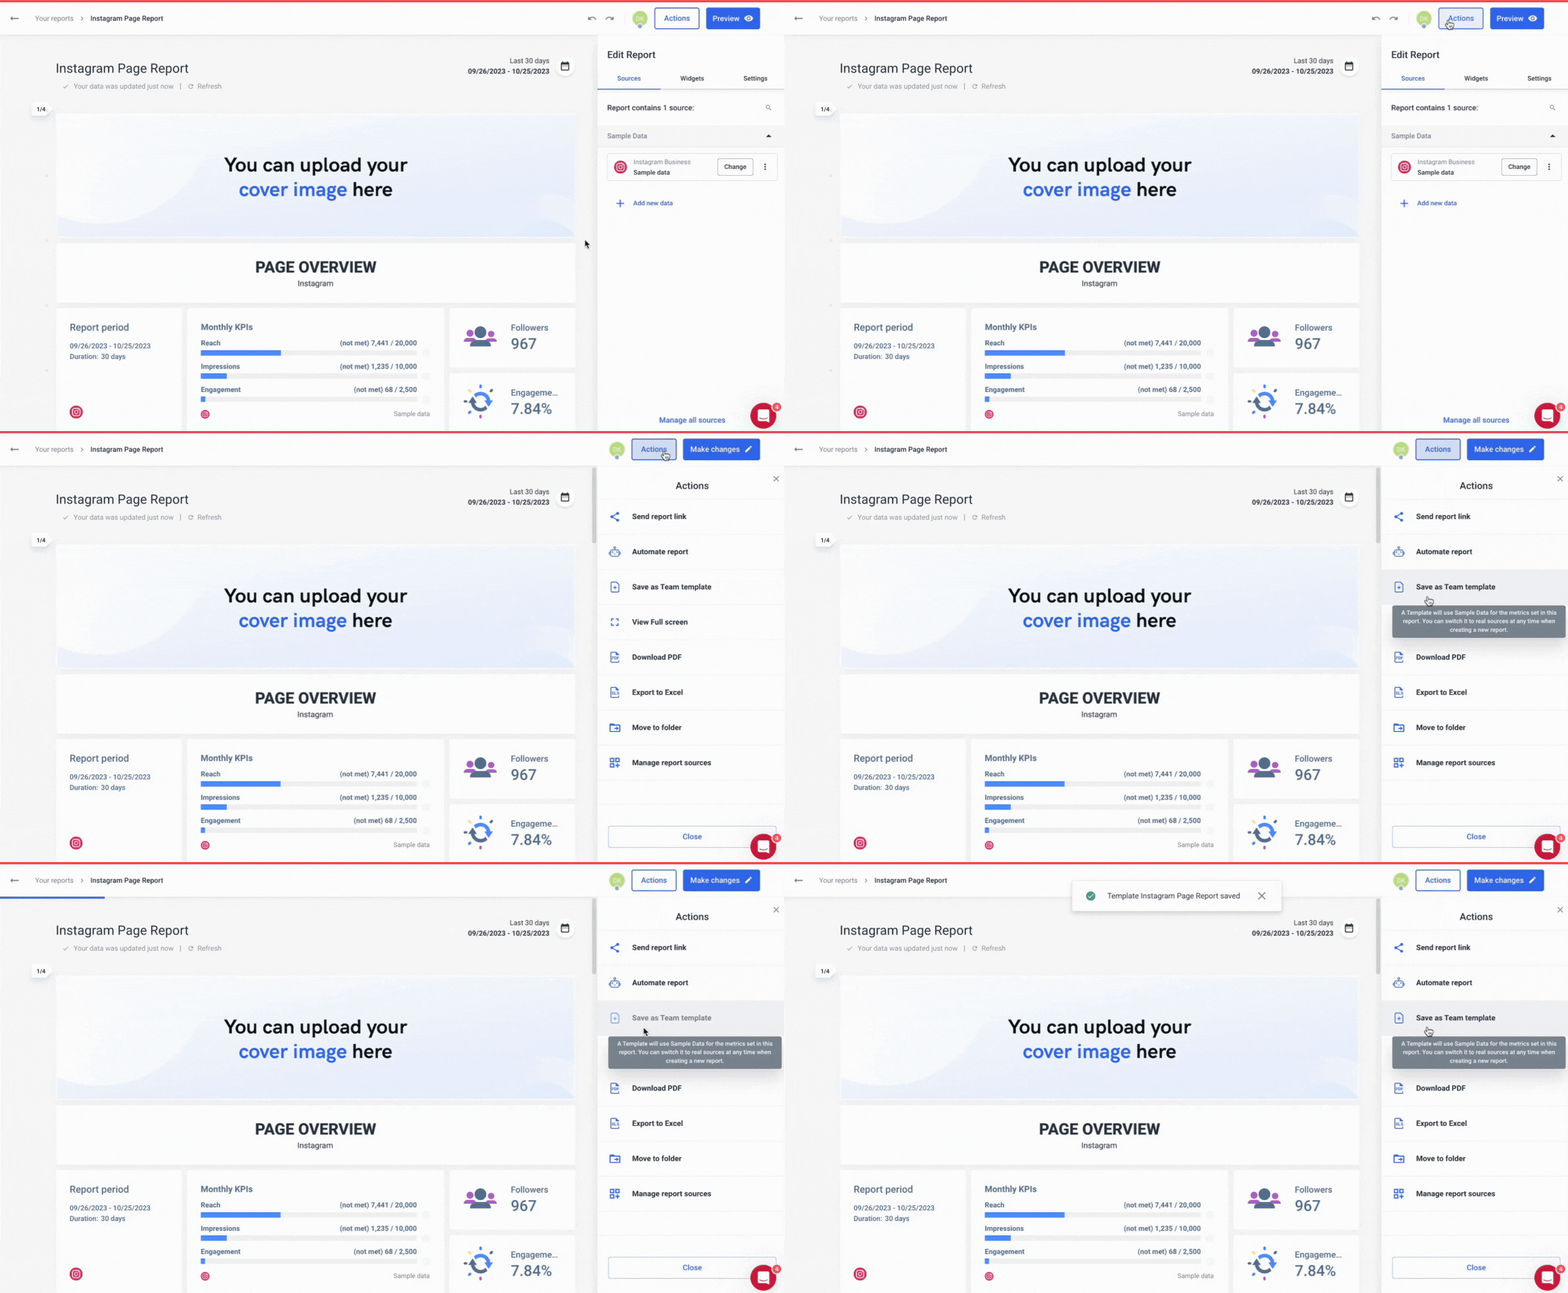 Kim even discovered a “trick” that would save her even more time.
For franchise clients that reported on the same metrics, Kim created one “Master” template with the layout and structure she liked. Then, she simply swaps out the data sources for every new report she needs for a client, rather than starting completely from scratch again.
Thanks to this, what previously took hours with Looker Studio now takes one hour or less per report.
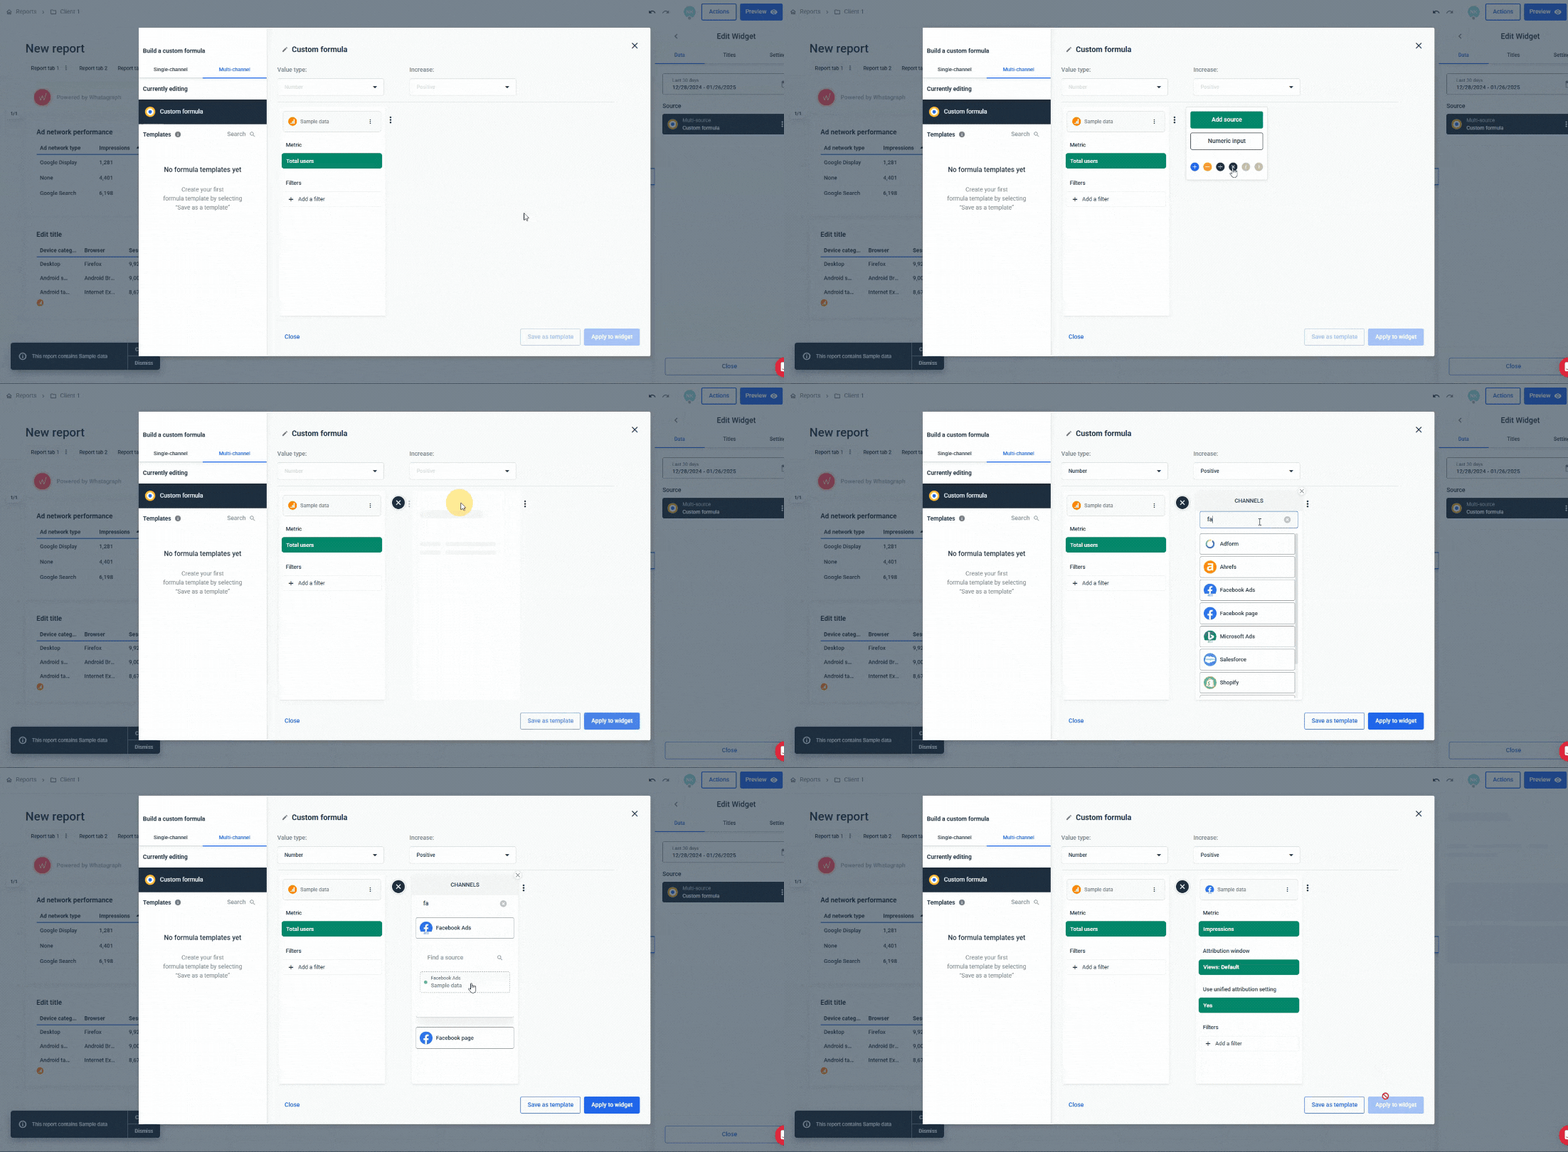
Custom formulas were another game-changer. Kim uses them to combine data from different platforms and visualize a high-level view of how campaigns are performing.
Custom formulas also made sure metrics were accurate and not over-reported, like on Google and Meta.
If Kim ran into roadblocks, she simply reached out to our live chat Customer Support which resolved issues within an hour. For larger issues, the support team kept her in the loop until they were resolved.
This was a stark difference from Looker Studio, which doesn’t come with Customer Support.
“I've joked about this often—with Whatagraph, we're not paying for a reporting system. We're paying for customer support,” Kim laughed. “There's a level of dedication from the Whatagraph team that you don't often experience anywhere else.”
Today, Kim uses Whatagraph as the single source of truth for both clients and internal teams.
For clients, Kim builds detailed reports and conducts performance analysis to prepare for their monthly, bi-weekly, or weekly meetings.
“I’m so happy,” Kim beamed. “When we’re on a call with a client and they have a question, I can just create a graph in real-time while we’re still talking. It’s just so easy to use.”
Clients can also access these reports anytime via a shared link, and they see fresh, accurate data whenever they open one up.
The next part is internal performance monitoring. Kim constantly monitors campaign performance across all channels and clients on Whatagraph, identifies KPIs that are trending up or down, and shares performance summaries and insights with Account Executives, ensuring everyone is aligned before client meetings.
“Whatagraph is now our Bible—both for clients and internal teams,” Kim shared. “It’s also my favorite part of the job—I’m genuinely within Whatagraph 6 out of 8 hours a day.”
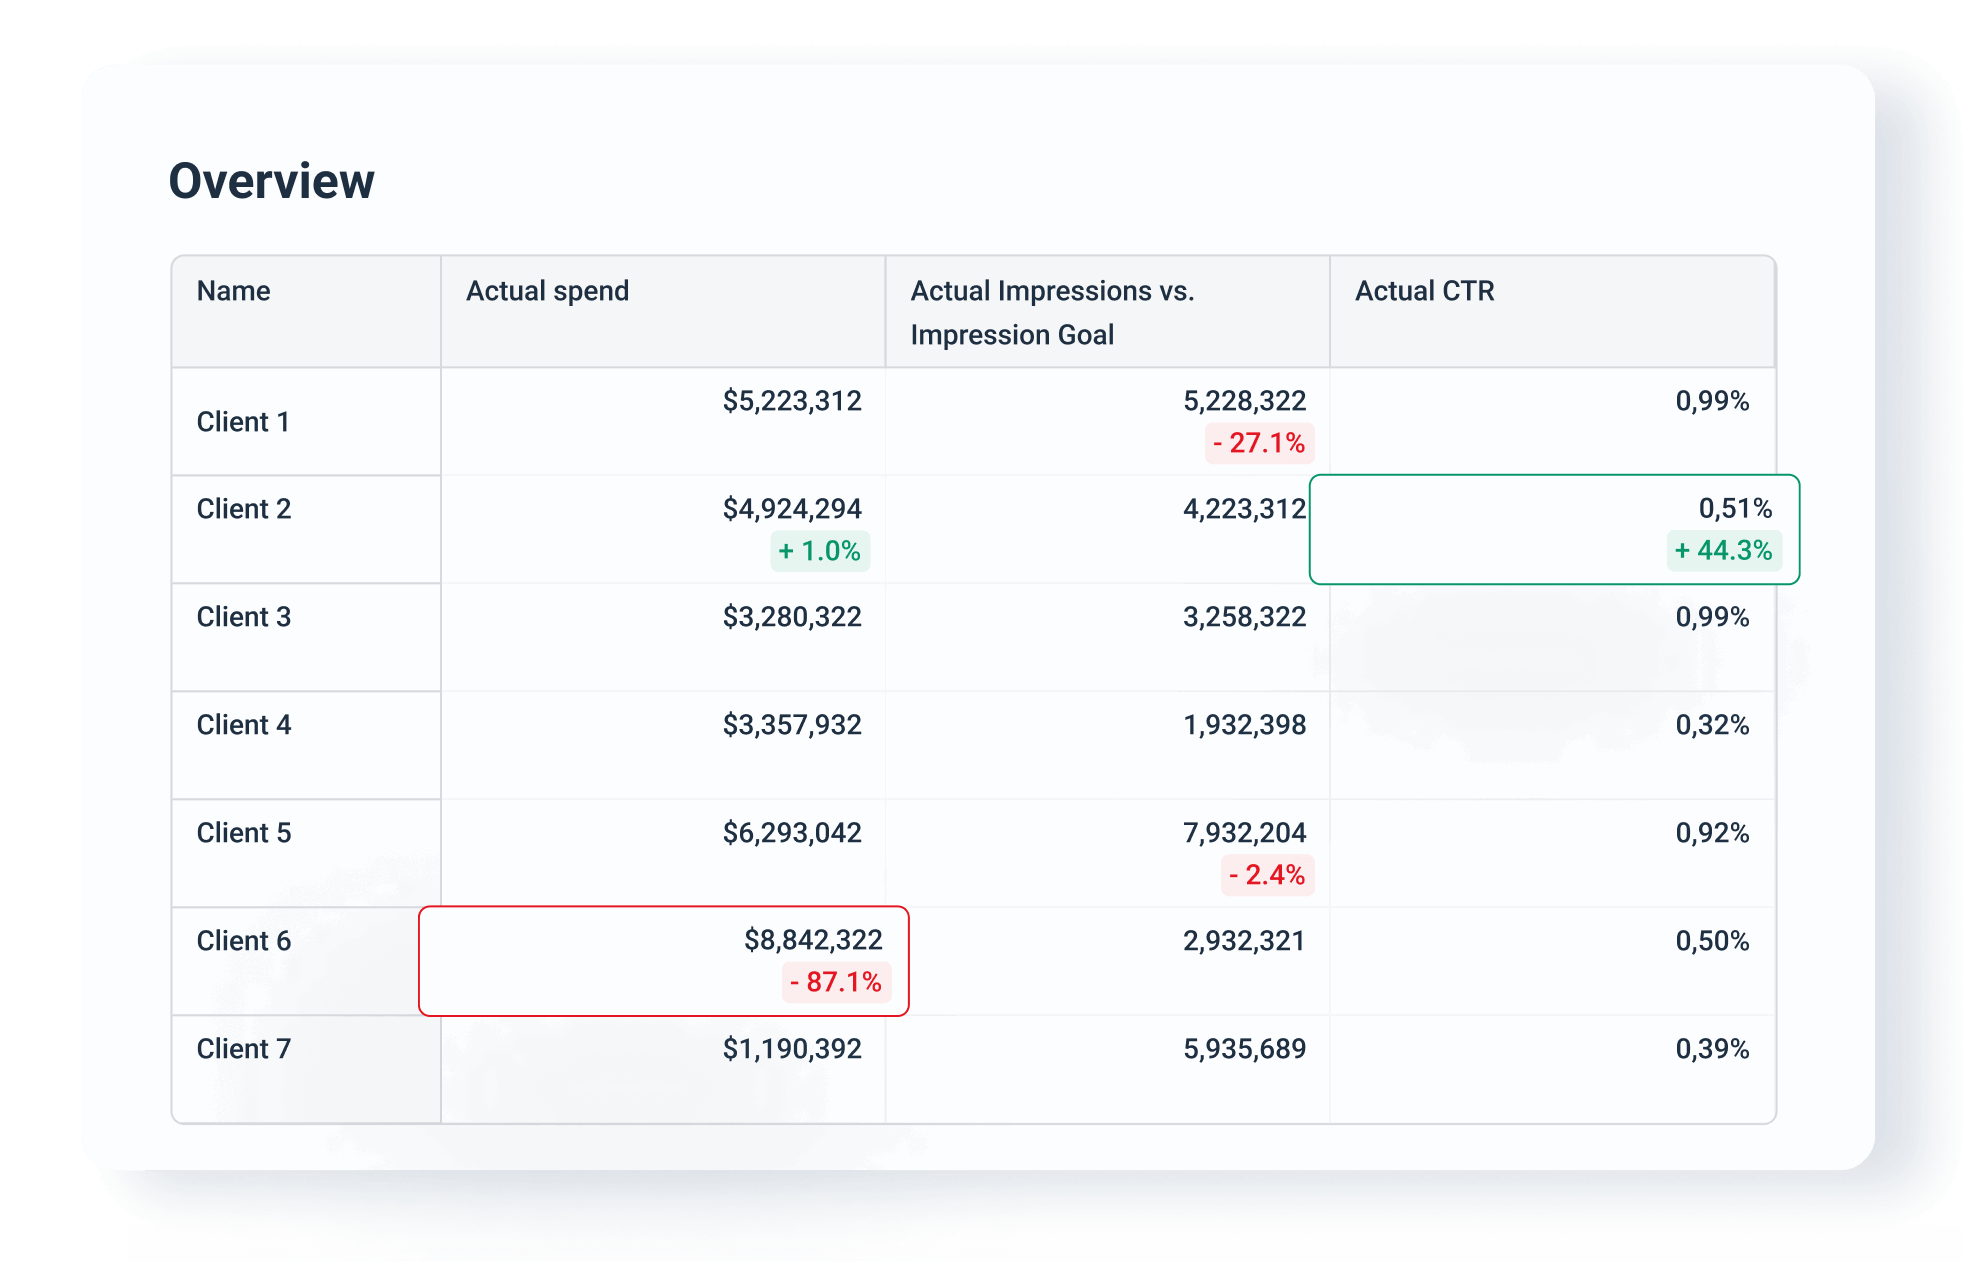
Currently, Kim is developing a budget tracker within Whatagraph’s Overview section to help account teams stay on top of ad spend.
I immediately knew Whatagraph was going to save us a lot of time, and that we were going to have accurate reporting.
Results
63 Hours Saved Per Month on Reporting, Retained Clients, and Democratized Insights
Switching to Whatagraph has transformed the way Kim and Peak Seven approach data and reporting.
What once took Kim 4 hours on Looker Studio now takes just 1.5 hours (or less) with Whatagraph. Across 25 reports each month, this shift saves her an incredible 63 hours of work—time she can now dedicate to deeper analysis and strategy.
This efficiency translates to $9,450 saved per month for clients on reporting, using the hours multiplied by the average retainer value. This frees up valuable resources for the agency to focus on growth and delivering even greater value to clients.
Moreover, the sleek, accurate reports produced by Whatagraph have impressed both internal teams and clients.
“When I shared this report with my account team, they said, ‘Oh my God, we’ve never had a report look this good to show to clients,’” Kim shared.
These reports have even become a key part of Peak Seven’s client pitches, where they highlight the always-accurate 24/7 dashboards and monthly reports that clearly show campaign performance and results.
One of the biggest improvements Kim has seen is in data accuracy. With Looker Studio and Funnel, reporting was a constant struggle—broken connections, double-counted conversions, and inaccurate metrics were the norm.
In Whatagraph, connections are fully-managed and native, meaning there are no data inconsistencies or delays in data.
“With Whatagraph, it’s so much easier. The data always matches what we’re seeing on the platforms,” Kim explained.
But the biggest benefit, according to Kim, is the transparency and communication between clients and teams.
“Whatagraph took us to the next level with our clients and within our team. With Looker Studio, everything was muddled. But Whatagraph has opened up transparency and communication. It allowed us to see clearly how our campaigns are performing and even pointed out the flaws in our data tracking systems,” Kim remarked.
Whatagraph also equipped Account Executives with the insights they need to demonstrate value to clients.
“Whatagraph has helped everyone on our team get on the same page about clients, what’s important, and how to talk to the clients about it. Our relationships with clients have been amazing.”
These insights have strengthened client relationships and even helped retain them.
“There were clients we were on the verge of losing,” Kim shared. “But being able to show exactly how we’re performing, why it’s better, and that it’s because of us has made a huge difference.”
Last but not least, Whatagraph has empowered Kim in her role as a Digital Marketing Specialist.
“Whatagraph has helped me build my role into such an integral part of the company. I know I’m helping my team and my clients, and I find that great, honestly,” Kim shared.
Looking ahead, Kim is excited to expand Whatagraph’s use within Peak Seven. She intends to:
- Build a budget tracker to stay on top of ad spend and avoid over- or under- spending
- Use custom tags to build reports for each Account Executive
- Cross-train other team members to create reports on Whatagraph
When asked would she recommend Whatagraph to other agencies, Kim said:
“Absolutely yes. With Whatagraph, you’ll find accuracy, transparency, and ease of use. It’s built for agencies like us—to save time and report to clients the way we want to.”
Whatagraph took us to the next level with our clients and within our team. With Looker Studio, everything was muddled. But Whatagraph has opened up transparency and communication.
