


What is an SEO reporting tool?
An SEO (search engine optimization) reporting tool pulls data from your SEO platforms - Search Console, Ahrefs, Semrush, GA4 - and turns it into clear, shareable reports for clients and internal teams.
Instead of logging into five different SEO tools to piece together a story about SEO rankings, traffic, and backlinks, your clients get one report that shows exactly how their organic presence is improving.
A good SEO reporting tool does the heavy lifting for you:
- Connects directly to your SEO platforms - Search Console, GA4, Ahrefs, Semrush, and more
- Standardizes data across tools so a “session” in GA4 and a “visit” in Search Console don’t end up telling two different stories
- Turns complex SEO data into visuals that clients can read without a tutorial
- Let's you brand every report - fonts, colors, logos, so the report feels like yours, not a third-party tool
And with Whatagraph’s IQ, you can take this even one step further:
- Ask AI to generate full SEO reports instantly, complete with charts, tabs, and layouts
- Get plain-language summaries that explain rankings, traffic, and backlink changes
- Chat directly with IQ to get instant answers about any metric in your report
- Use IQ Themes to automatically brand reports for each client from a single image upload
Whatagraph has also launched an MCP that lets you connect your data to Claude or ChatGPT and do your analysis there.
What features should I look for in an SEO reporting tool?
Below are the features that actually matter when selecting an SEO reporting tool.
1. Native integrations with all your SEO tools
A good SEO report starts with accurate, up-to-date data. Your SEO report software needs to connect natively with every tool you use - without third-party connectors potentially causing issues.
Look for native integrations with:
- Google Search Console
- Google My Business
- Google Analytics 4
- SEOMonitor
- AccuRanker
- SE Ranking
- Semrush
- Ahrefs
Plus, integrations with other marketing channels should also be available for cross-channel reporting.
On Whatagraph, all of these connect in a few clicks. Our integrations are fully managed and refresh every 30 minutes, making sure your reports are always up-to-date.
2. Cross-channel data blending
Your SEO clients almost always run paid campaigns alongside organic. Showing them organic rankings in isolation misses the full picture. The best tools let you blend data from multiple data sources into one unified view.
And for agencies that report on more than just SEO, your tool should layer in social media, email campaign, and e-commerce data. On Whatagraph, you can connect 60+ platforms across paid, social media, email, CRM, and ecommerce.
This way, clients get a rankings report, as well as a broader picture of their marketing performance. But blending data is only half the job - presenting it in a way each client understands is the other half, which Whatagraph also helps with.
Drew Cove, Senior SEO Manager at DigitalParc, likes Whatagraph specifically for this reason:
We use Whatagraph for all our clients' reports. The ability to title metrics differently is important to me because we often report the same metrics to different clients and just need to call them differently - many clients have internal terminology that is very different from one another.
3. White-labeling and custom branding
White-labeling means more than just slapping a logo on a PDF. It also means:
- Custom domains for live report links
- Client brand colors, fonts, and logos
- Branded email delivery
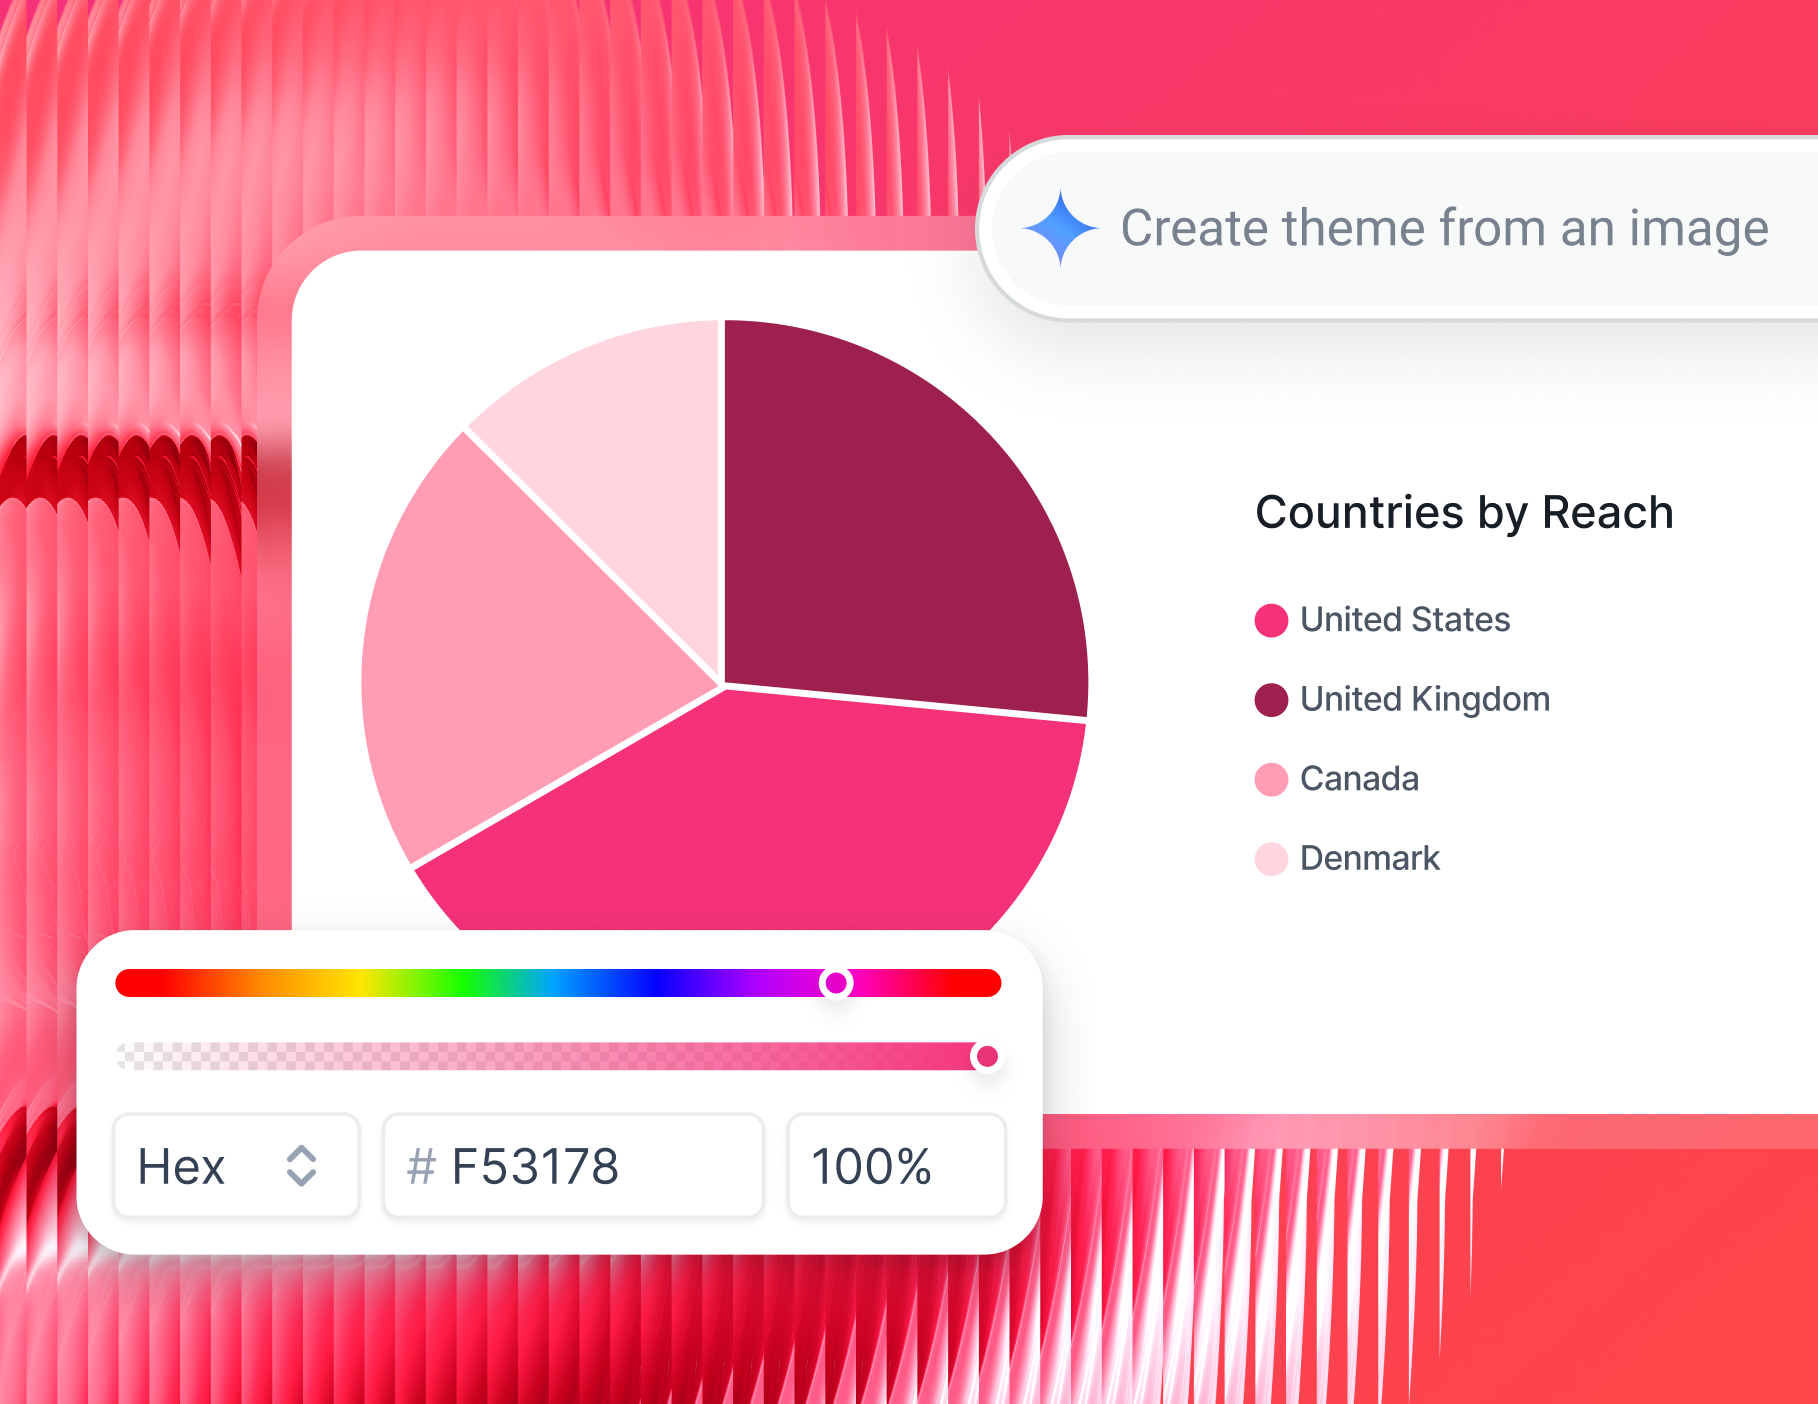
With IQ Theme, you can create entirely branded SEO reports in seconds with AI. Simply describe the style you want, or upload a logo or brand image, and Whatagraph builds a matching palette.
4. Automated report delivery
If you’re still manually exporting PDFs and attaching them to emails, you’re spending time that could be entirely automated.
Look for a tool that lets you send reports:
- Via email, on a schedule you set once
- Via Slack, so updates land where your team already works
- Via a live link, your client can access at any time
- Via PDF or CSV export for clients who want a file they can save, share, or present internally.
- Via BigQuery or Looker Studio for deeper visualization
On Whatagraph, you get all of the above. Pick what works for each client, and deliver reports with little to no manual effort.
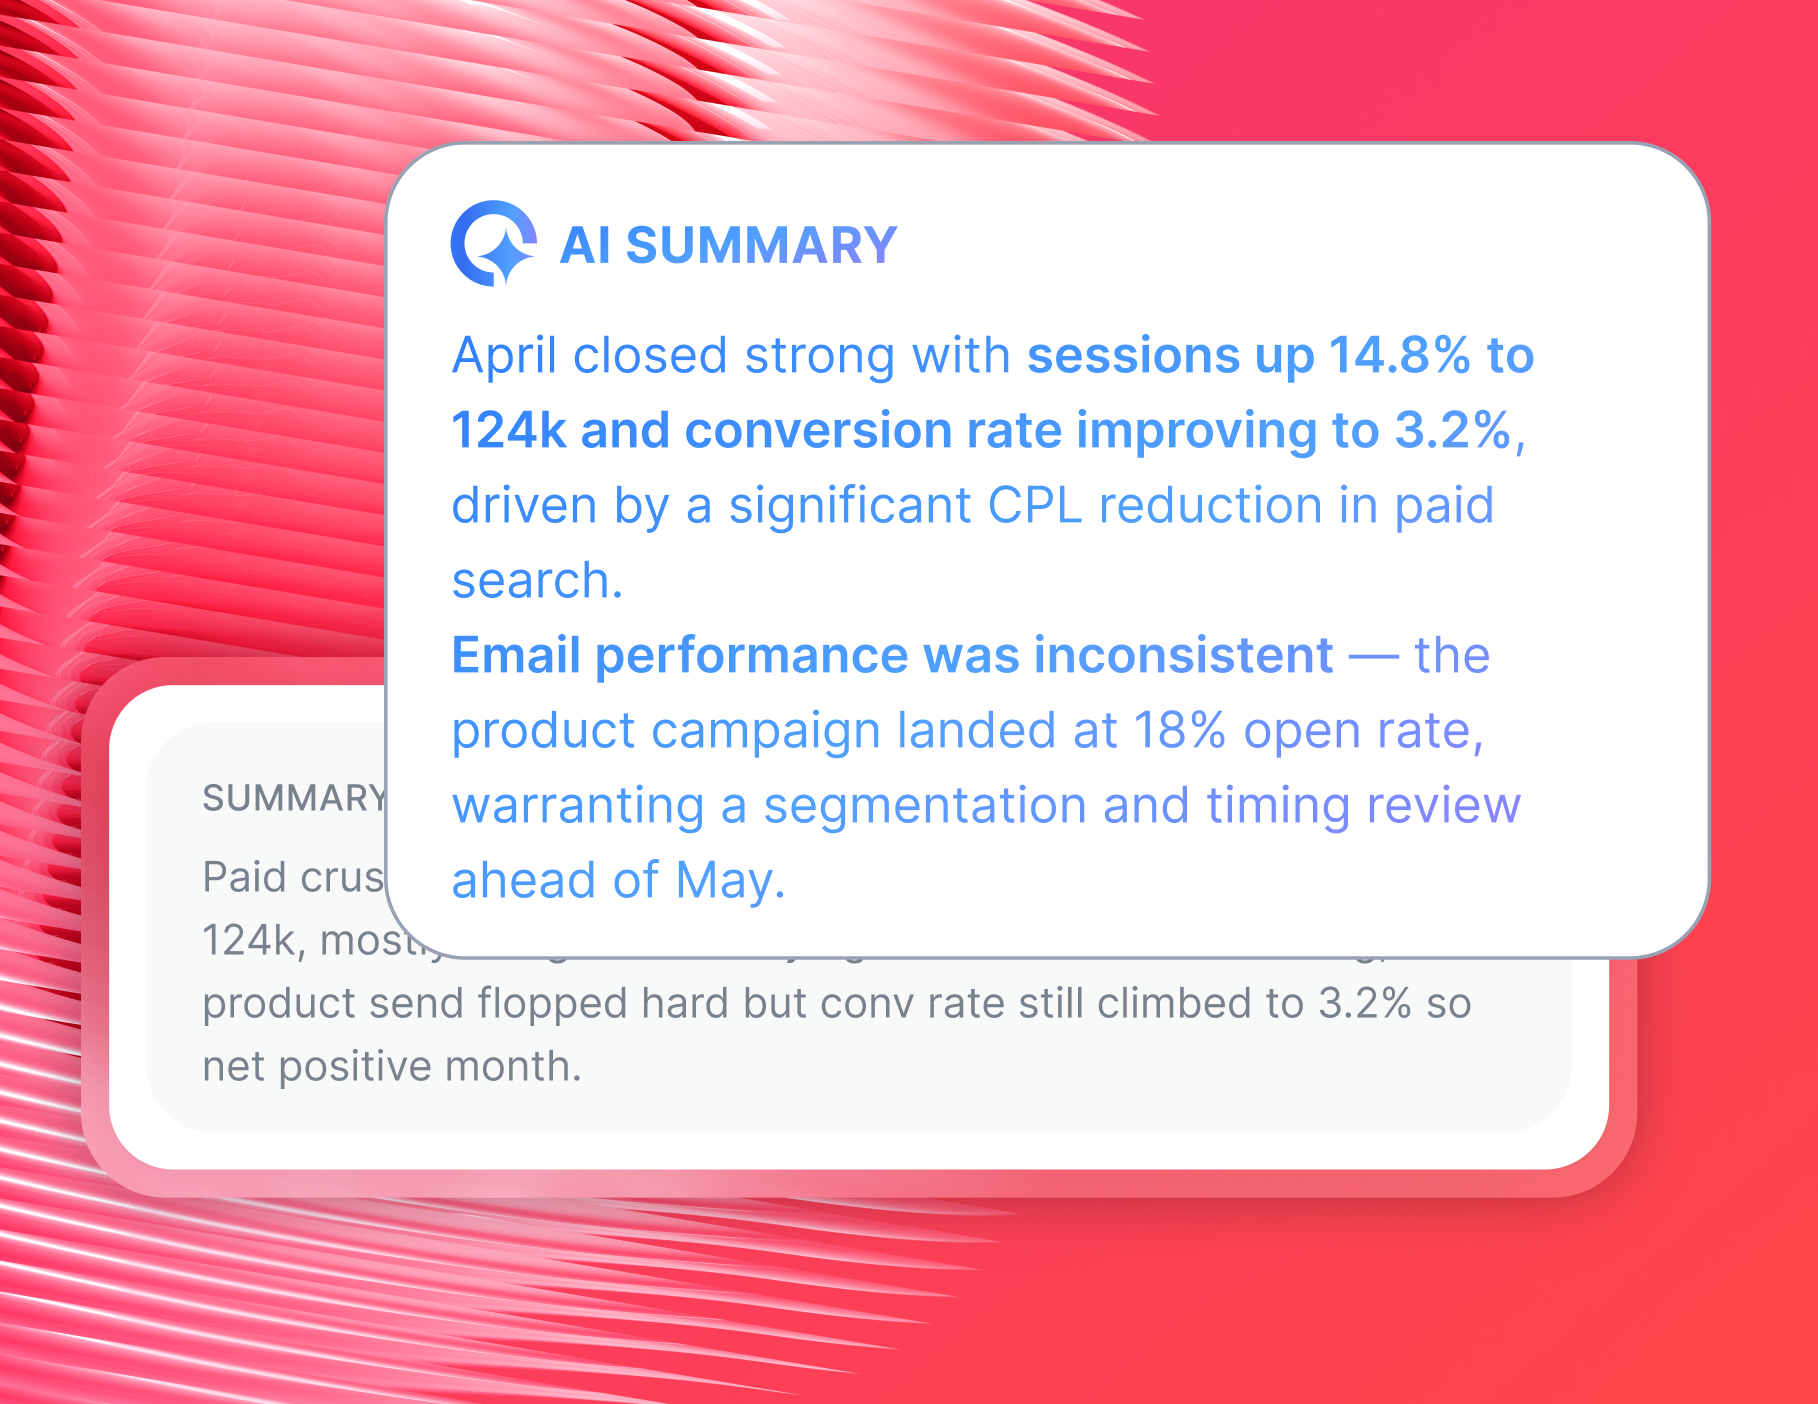
5. AI-powered insights and summaries
Writing the same "organic traffic was up 12% month-over-month due to..." paragraph every month is a time sink with zero upside.
The top SEO reporting tools now handle this automatically - pulling data from your sources and generating accurate performance summaries.
For example, here's how AI summaries (IQ summary) work inside Whatagraph:
- Drop a text widget into your report (from the “Charts” drawer).
- Click the AI button and pick the type of content you want - Summary, Recommendations, Issues, Winds, or Custom Prompt.
- Select the language. Whatagraph covers 18, so your client gets the summary in the language they actually work in.
- Generate, read through it, and click “Insert” to add it directly into the report.
- Edit it further if needed to add a bit of human touch
Try it out here:
And AI summaries aren’t just about saving time - they’re about making the report actually mean something to the person reading it.
As Janet Mesh, the CEO and Co-Founder at Aimtal, puts it:
I think one of the biggest mistakes that marketers make when creating reports is just adding screenshots of performance charts without any context or analysis. Your role is to be a non-fiction storyteller.
What are the best tools for generating SEO performance reports?
To actually go ahead and generate SEO performance reports, you’ll need an SEO reporting tool. Below are the top six we can recommend.
1. Whatagraph - Best SEO reporting software for agencies
Whatagraph is built for marketers, not data engineers.
It’s an SEO reporting tool that replaces the spreadsheets, the manual exports, and the fragile connector setups with one platform your whole team can actually use.
Here’s how it works:
- Connect to SEO tools - Ahrefs, Semrush, GA4, Search Console, Google My Business, and 50+ other marketing platforms
- Organize your data by creating custom dimensions and blends with AI or no-code workflows
- Create the actual reports by simply telling IQ the type of report you want to build
- White-label reports by uploading a screenshot or your brand book, or use our ready-made templates
- Get summaries instantly by asking our AI any questions about your SEO data
- Share reports with automated emails, PDFs, live links, and Excel spreadsheets. Or, push them to BigQuery or Looker Studio for further analysis.
And unlike most SEO reporting tools, Whatagraph integrates with “lesser-known” SEO tools, like SE Ranking, SEOMonitor, and AccuRanker.
On Whatagraph, you (and your clients) can get the full picture of your SEO efforts:
- Keyword ranking movements and search volume data side by side
- Website traffic metrics - sessions, CTR, impressions, and more
- Backlink profiles and referring domain growth
- Best-performing pages and queries
- Site health indicators
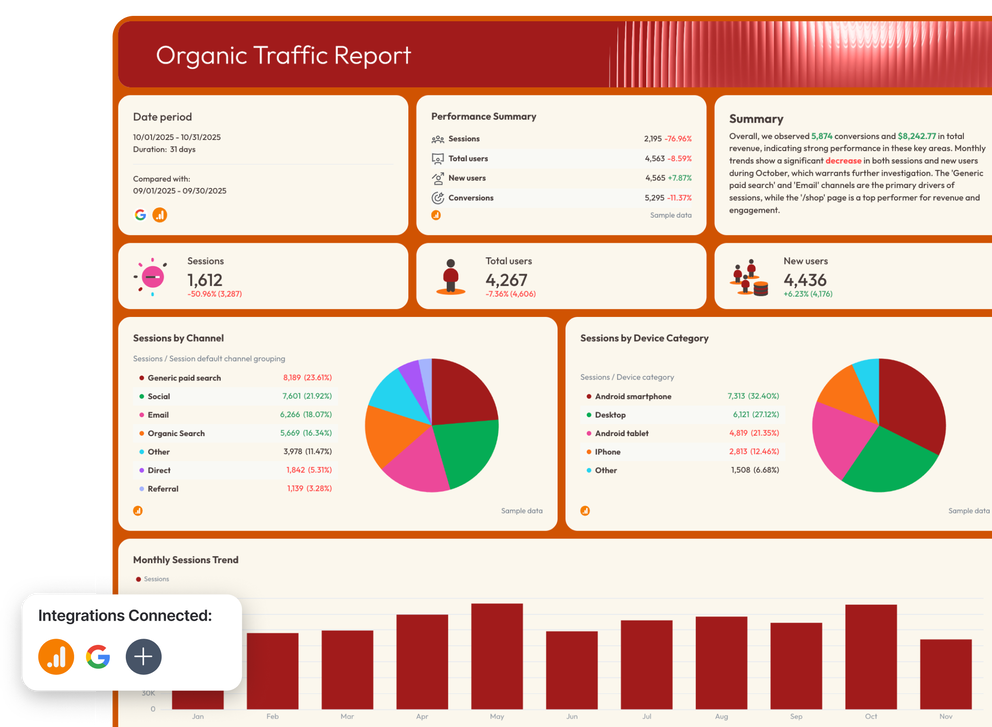
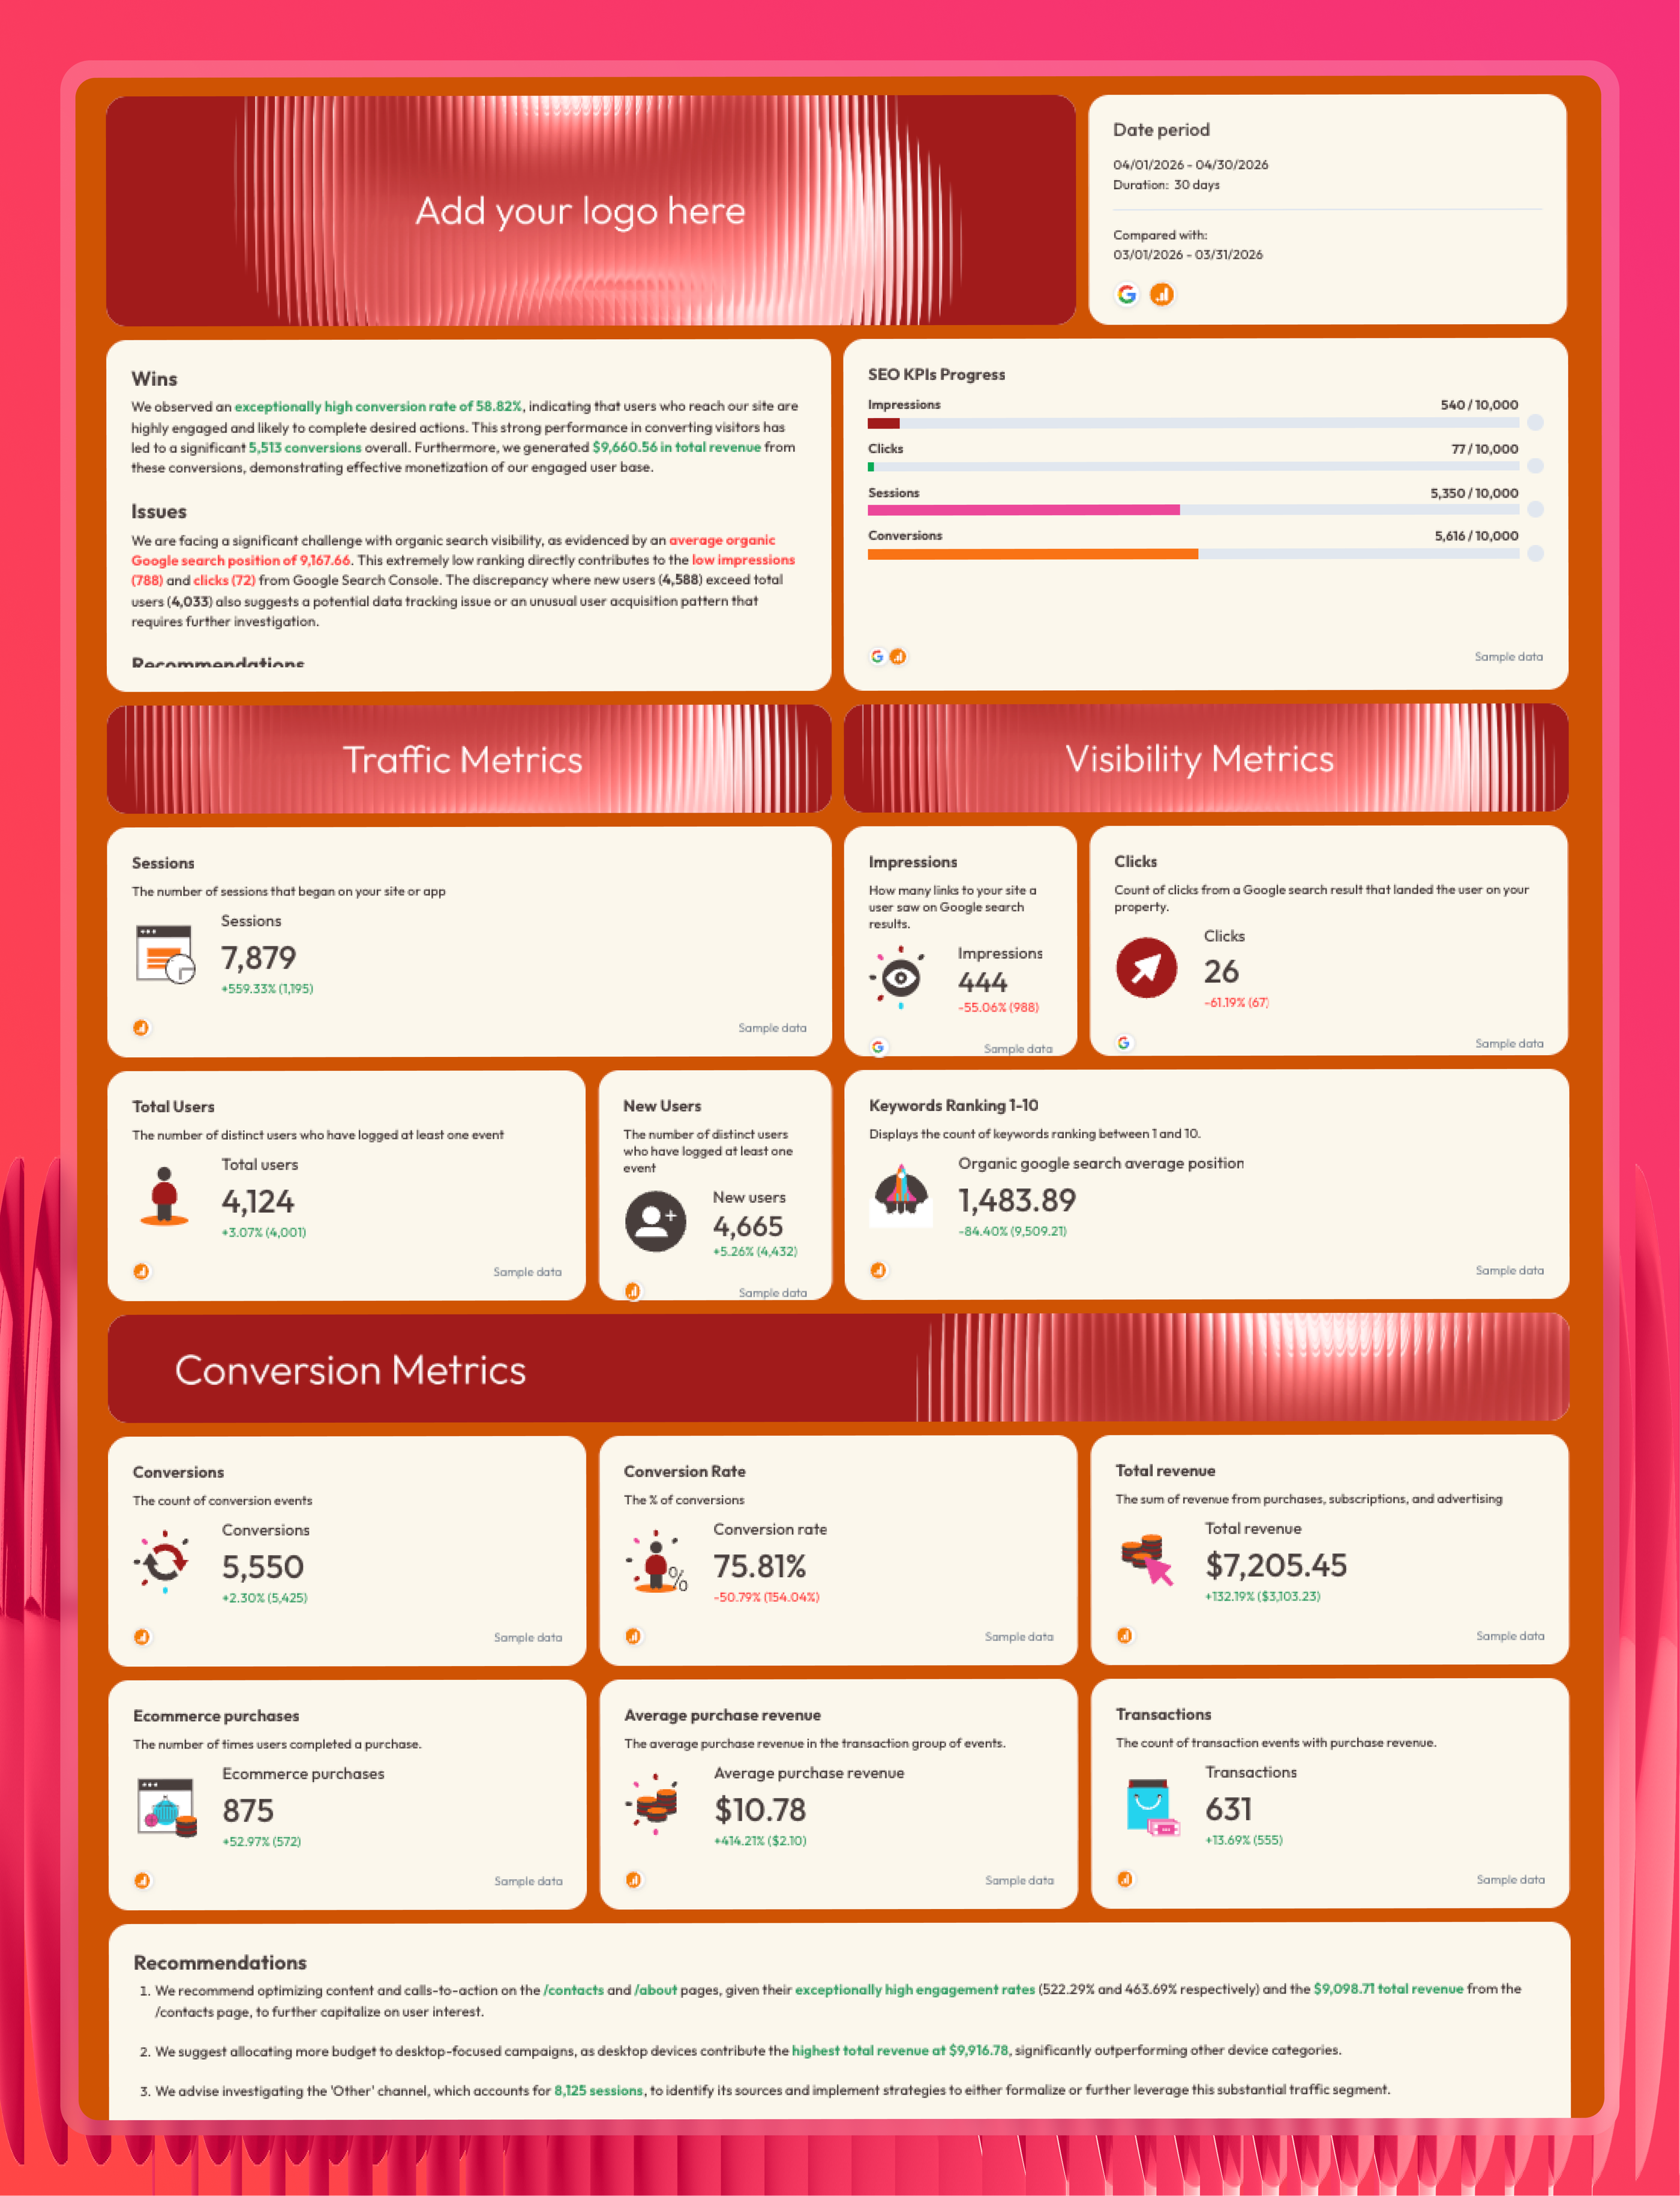
For example, here’s an SEO report template example created by Whatagraph:
But where Whatagraph truly shines is Whatagraph IQ, which takes the heavy lifting out of SEO reporting.
With Whatagraph IQ, you can:
- Build full reports from a prompt: Describe the report you need, and IQ assembles it from scratch - tabs, charts, KPI widgets, and layout - in seconds.
- Edit widgets by typing: Want to change a chart or add a metric? Just describe what you want, and IQ makes the change. No manual configuration required.
- Create separate tabs per channel, location, or brand: So clients get a clean, organized report instead of one long scroll.
- Build custom blends and metrics: Describe what you need - "combine all organic traffic from Search Console and GA4" - and IQ builds it instantly.
- Standardize messy data at scale: Got inconsistent campaign names across clients? Tell IQ how to group them, and it creates a clean, reusable dimension you can apply across every report.
For Maatwerk Online, these AI features translated directly into 100 hours saved every month. Here's how Co-Founder Lars Maat describes it:
Whatagraph’s AI saves time and energy for our marketing specialists. And the hours we’re saving is just pure profit. We now have the time to focus on more strategic things that help both our agency and our clients grow.
Start free with Whatagraph today.
2. TapClicks - Best for agencies that need deep data integration
TapClicks is a data and reporting platform built primarily for larger agencies with complex data needs. It connects to a wide range of marketing platforms and has strong data pipeline capabilities.
With TapClicks, you can:
- Pull data from hundreds of marketing sources into centralized dashboards
- Build white-labeled client reports with custom branding
- Set up automated report delivery on a recurring schedule
Worth noting: TapClicks has a steeper learning curve than most reporting tools, and several users have reported data inaccuracies and lag times that require manual fixes.
3. Databox - Best for real-time dashboards and goal tracking
Databox is an SEO reporting dashboard tool that makes it easy to track KPIs in real time across multiple sources. It's particularly strong for teams that want to monitor performance at a glance rather than generate in-depth client reports.
With Databox, you can:
- Build real-time SEO dashboards from 100+ data sources
- Set KPI goals and track progress against benchmarks
- Create scheduled report snapshots for email delivery
Databox is a solid KPI monitoring tool, but it wasn't built with agency-scale SEO client reporting in mind. Users report connectors breaking, and design and white-labeling options are limited.
4. AgencyAnalytics - Best for white-labeled reporting with basic customization
AgencyAnalytics is an SEO and marketing reporting tool built specifically for agencies that need branded, client-facing reports. It covers the essentials well and is relatively straightforward to get started with.
With AgencyAnalytics, you can:
- Connect to Google Analytics, Facebook Ads, and 80+ other marketing platforms
- Build fully white-labeled, custom reports
- Schedule automated report delivery to clients on a recurring cadence
That said, data can take 2-3 days to pull through, which makes real-time tracking difficult for agencies that need fresh numbers before every client meeting.
5. DashThis - Best for teams looking for a simple, affordable reporting solution
DashThis is a straightforward marketing reporting platform that pulls data from 50+ integrations into pre-built dashboard templates. It's a solid starting point for smaller teams that need basic consolidated reporting without a steep learning curve.
With DashThis, you can:
- Connect data from 50+ marketing platforms into one dashboard
- Use pre-built templates to get reports up and running quickly
- Schedule consistent monthly reports and export them as PDFs
The main drawback: customization is limited - design-focused teams will quickly find themselves working around what the tool can't do rather than building what they actually want.
6. Swydo - Best for small teams with straightforward reporting needs
Swydo is a reporting platform that connects to 30+ marketing platforms and lets teams generate automated, scheduled reports without much technical setup. It works well for small businesses with simple, single-location clients.
With Swydo, you can:
- Pull data from Google Analytics, Google Ads, Facebook Ads, and other major platforms
- Use pre-built templates to generate reports quickly
- Schedule automated report sending to clients
Tip: For a full breakdown of these, we’ve made a comparison article of the best SEO reporting tools on the market.
3 success stories of agencies using Whatagraph's SEO reporting tool
Thousands of agencies use Whatagraph to report on SEO for their clients. Here are three of their stories.
1. Peak Seven: 63 hours saved per month on reporting
Challenges
Peak Seven was running their reporting on a Looker Studio, Funnel, and Supermetrics stack - managing 25 clients and over 100 active ad campaigns.
Data frequently failed to pull through correctly, and Kim Strickland, Digital Marketing Specialist, spent more time triple-checking numbers against source platforms than actually analyzing performance. A single report took 40 hours to build from scratch.
"Looker Studio was slow and always breaking. The data wouldn't pull through, or it would pull through incorrectly. It was frustrating, time-consuming, and a constant guessing game," said Kim Strickland, Digital Marketing Specialist at Peak Seven.
Solution
Kim moved the entire agency to Whatagraph in a matter of hours. She built a master template for franchise clients that could be cloned and updated with new data sources instead of being rebuilt from scratch each time.
Custom formulas combined data from different platforms, and a live dashboard gave clients accurate performance data at any time.
Results
- 63 hours saved per month on reporting
- $9,450 saved per month for clients on reporting costs
- Report build time dropped from 4 hours to 1.5 hours
- Stronger client relationships and improved retention
Whatagraph is now our Bible, both for our clients and internal teams. With Looker Studio, everything was muddled. But Whatagraph has opened up transparency and communication. - Kim Strickland, Digital Marketing Specialist at Peak Seven
2. YourFellow: 50% less time on reporting, 65% lower costs
Challenges
YourFellow is a performance agency specializing in paid media, SEO, CRO, and analytics for 35-40 clients. They were running on a Funnel plus Looker Studio stack that was slow, technically demanding, and constantly breaking.
They spent one full day every week just maintaining dashboards. Dashboards took 15 minutes or more to load because of constant API rate limits. Data calculations lived in three different places at once - the ad platform, Funnel, and Looker Studio - which made troubleshooting a process in itself.
"Whenever we wanted to see data in one of the dashboards, we had to wait for at least 15 minutes because of rate limits. A lot of my colleagues were frustrated," said Linda van Baal, Online Marketing Consultant at YourFellow.
Solution
Linda migrated all 35+ clients to Whatagraph in under two months. She built two core reusable templates - one for e-commerce clients, one for lead generation - and ran a team-wide training session so colleagues could build their own dashboards independently.
Missing integrations were built by Whatagraph's team specifically for YourFellow's workflow.
Results
- 50% of monthly reporting time saved - from one full day per week to half a day
- Up to 65% cost savings compared to Funnel
- Dashboard load times dropped from 15 minutes to 2 minutes or less
- All 35+ client reports migrated in under 2 months
Whatagraph saved me at least half a day a week, maybe even more. The biggest advantage is that everything is now in one tool, and the dashboards look way cleaner and more customized, also to our own brand. - Linda van Baal, Online Marketing Consultant at YourFellow
3. Wise Pirates: 500 reports across 200+ clients, without a technical team
Challenges
Wise Pirates is a full-service digital agency based in Portugal, serving 200 clients globally across performance marketing, SEO, social media, and web analytics.
With 500+ active reports, maintaining consistency and quality at scale was the core challenge. Reports were being built differently by different team members, with no centralized process or quality control in place.
"We felt the need to have a dedicated person to oversee the reporting process to be more organized," said André Cardoso, Project and Performance Marketing Manager at Wise Pirates.
Solution
The team built a comprehensive template library covering their main client types: e-commerce, lead generation, SEO, Amazon advertising, and seasonal campaigns. All reports are organized into 220+ folders, with data sources and team assignments managed at the folder level.
The team also uses Whatagraph IQ's AI features to speed up widget creation and write performance summaries automatically.
Results
- 500 active reports managed on one platform, without technical expertise
- Consistent, high-quality reporting across 200+ global clients
- AI summaries cut the time spent writing insights significantly
- Live links give clients autonomous access to real-time data, building transparency and reducing churn
Whatagraph is simple to use, intuitive, and even those without tech expertise can start getting insights right away. The AI insights are very useful when we have a new client, and we have to analyze everything. - André Cardoso, Project and Performance Marketing Manager at Wise Pirates
How to automate SEO reporting using Whatagraph's SEO reporting tool
Whatagraph’s SEO report creator gives you the right tools to move from manual to automated SEO reporting. These are the six steps to take.
1. Connect your SEO data sources
Start by connecting the SEO platforms you already use. In Whatagraph, this takes a few clicks: select the integration, authenticate with your login, and the data starts flowing immediately.
Whatagraph’s SEO integrations include:
- AccuRanker (keyword rank tracking)
- Ahrefs (backlink analysis, domain authority, competitor insights)
- Google My Business (local SEO performance)
- Google Search Console (search visibility insights)
- SE Ranking (keyword and site audit data)
- Semrush (keyword analysis and traffic insights)
- SEOMonitor (SEO campaign tracking and forecasting)
- Google Analytics 4 (website performance, traffic data, and behavior analytics)
If you run paid campaigns alongside organic, add those sources too - plus any other marketing channel. Whatagraph handles cross-channel data in the same report.
2. Blend and organize your data
Once your SEO sources are connected, the next step is making the data actually usable.
Metric names differ between platforms, campaign naming conventions are rarely consistent, and raw data from five different tools rarely tells a clean story on its own.
With Whatagraph IQ, you can skip the manual work entirely and just ask AI to:
- Build custom blends from a description
- Generate custom SEO metrics on the fly
- Clean up inconsistent campaign or page naming
- Normalize data at scale
3. Build and brand SEO reports with AI
With your data organized, it's time to build the actual report. With Whatagraph IQ, this is no longer a drag-and-drop exercise.
Building reports with IQ is a quick, three-step process:
- Type a prompt and describe what you need, or simply upload a screenshot
- Watch IQ build the full, detailed report - tabs, charts, widgets, and layout - in seconds
- Need to tweak something? Just type the change, and IQ makes it on the spot
Then, you can brand your report. Upload your client's logo or a screenshot of their brand guidelines.
IQ Themes applies the right fonts, colors, and icons across the entire report automatically.
When building your reports, the goal isn't to show everything - it's to show the right things
Cheyenne Skye, Digital Marketing Analyst at Noise New Media, sums it up well:
I think there’s a ton of metrics that we as marketers look at that would make no sense and probably overwhelm clients. So we always try to be very specific about what the client's goal is and then just show the metrics for that.
4. Monitor performance with internal dashboards
Client reports tell the external story. Internal dashboards tell you what's actually going on across your entire portfolio.
In Whatagraph, you can build internal monitoring dashboards called Overviews - a live view of performance across all your SEO clients in one place.
Use Whatagraph Overviews to:
- Track organic traffic, ranking movements, and backlink growth across every client at a glance
- Spot clients whose keyword rankings are dropping before they bring it up in a meeting
- Monitor account manager workload and performance across the team
- Set targets and flag when key website SEO metrics like CTR or domain authority fall outside expected ranges
Slice by client, channel, region, or account manager - whatever structure fits how your agency operates.
5. Summarize SEO campaign performance for a client or stakeholder meeting
Clients don't want to interpret charts - they want to know what happened, why it matters, and what comes next.
And without the right context, even a well-built report can fall flat. As Sophie Brannon, Director of SEO at RushOrderTees, explains:
To most people outside of SEO, your screenshot of a GA4 graph or keyword increase or decrease doesn't mean much. I recommend providing more depth to the reporting with some insights and recommendations to really get buy-in from stakeholders on the work that you are doing.
In Whatagraph, AI takes care of writing the performance summaries.
Add a text widget to your report, and choose the type of content you need: A wins breakdown, key SEO issues, recommendations, or a custom prompt.
Pick the language, generate, and insert. Add your own expertise if needed.
Your team can also use IQ Chat to ask questions directly:
- "Which pages lost the most organic traffic this month?"
- "How did organic traffic perform compared to last month?"
- "Which backlinks did we gain or lose in the last 30 days?"
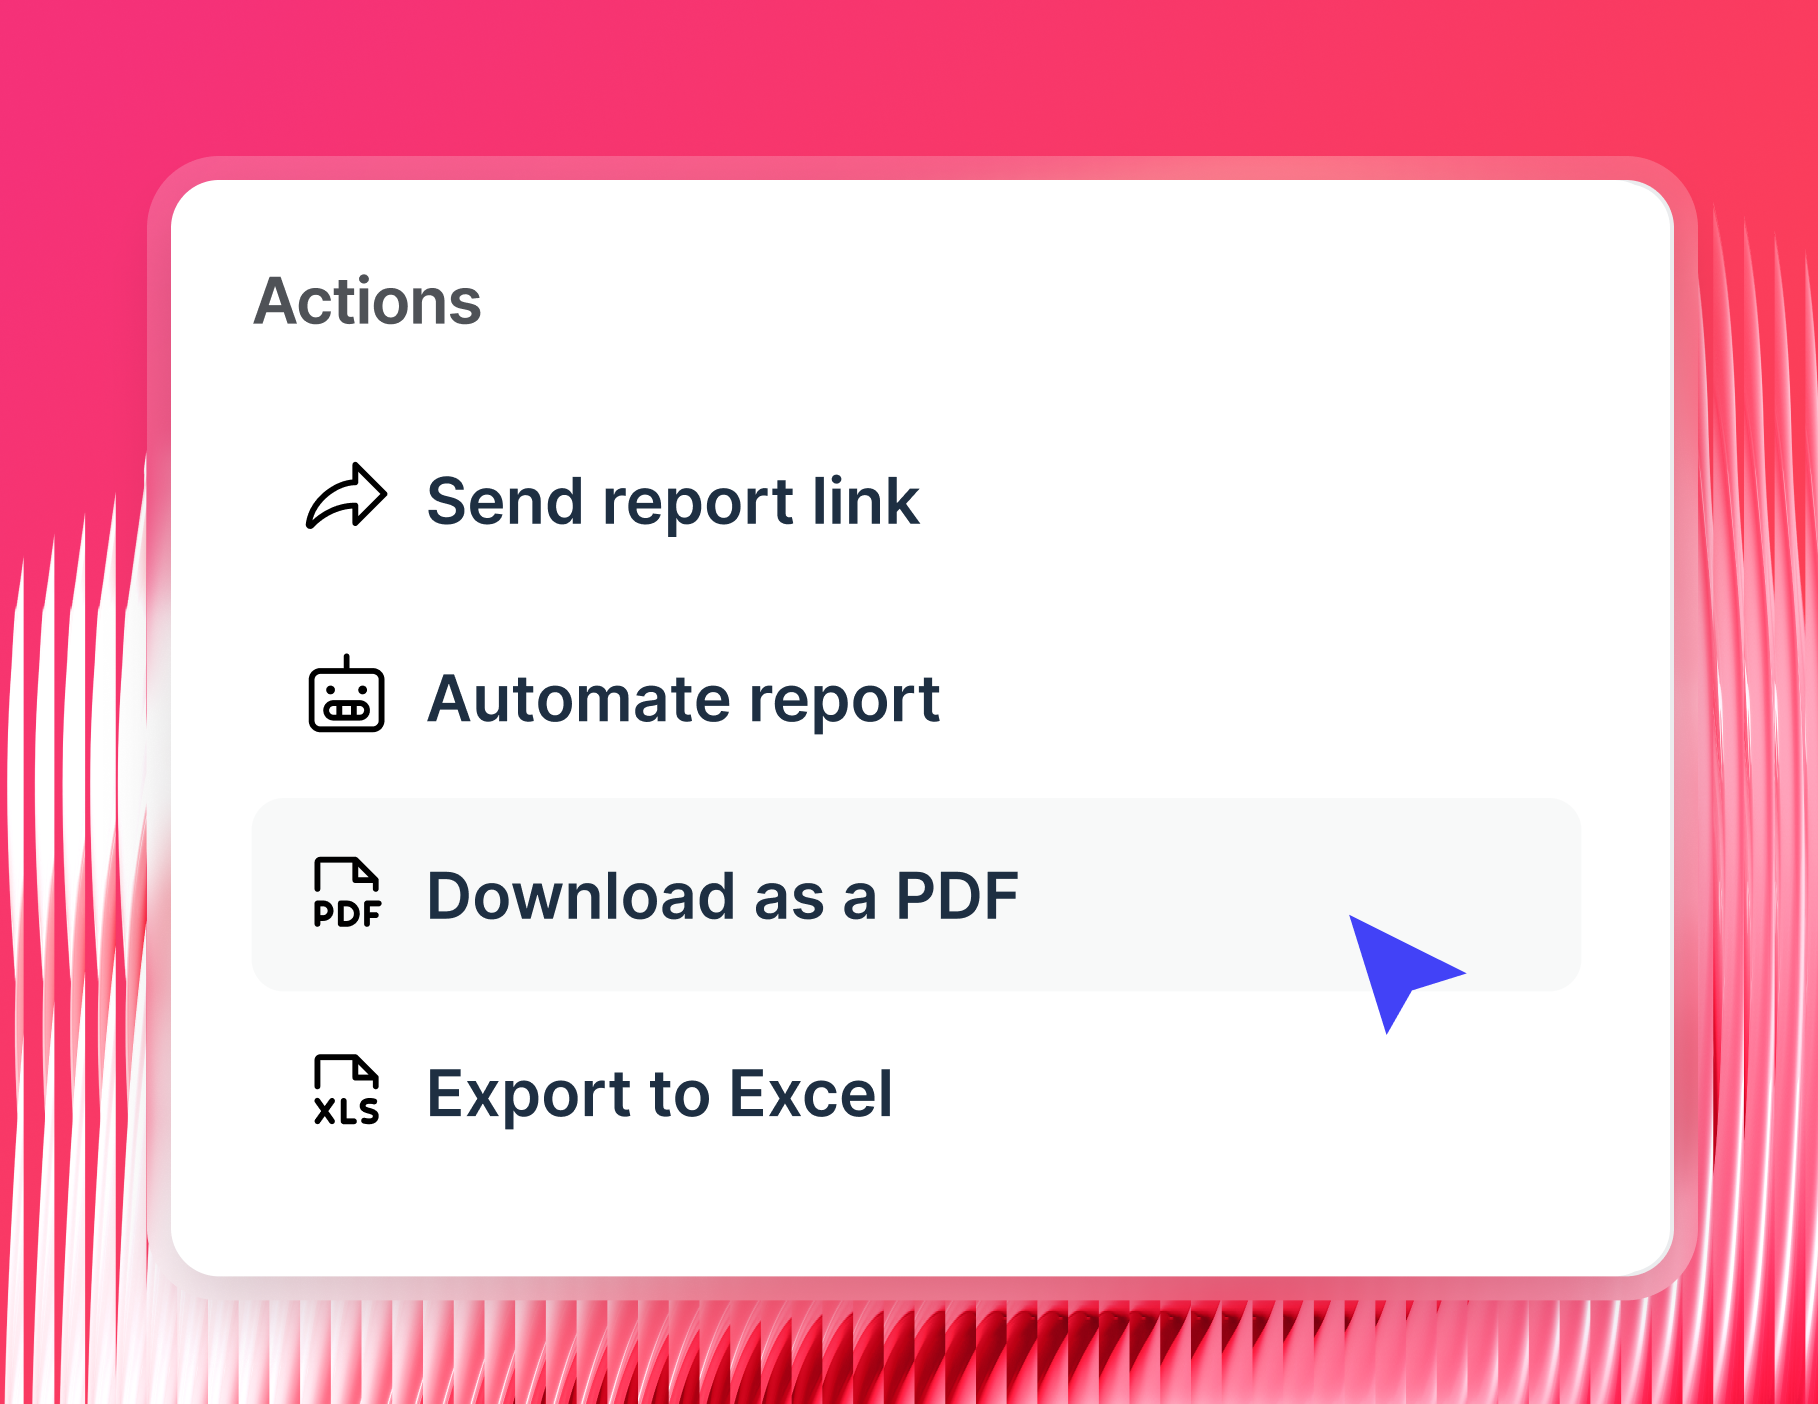
6. Share reports your way
Once the report is ready, Whatagraph gives you several ways to get it to the right people:
- Automated emails: Set the send date, time, and frequency once - and reports land in your client's inbox on schedule, every time.
- Live links: Give clients a link to a real-time dashboard they can open, filter by date, and explore on their own. No login needed.
- PDF and CSV exports: Download a static version for clients who prefer a file they can store or share internally.
- White-label delivery: Send reports from your own domain, with your own subject line and sender details