Challenges
The Need to Rebrand and Scale Up
As a testament to the exceptional results they delivered for clients, Dtch. Digitals grew rapidly in 2023, expanding to over 50 employees and 250 clients.
However, with this growth also came the realization that their identity and operations needed to evolve.
Previously, the agency was known as “Team Nijhuis,” which no longer fit their scale.
As Stef Oosterik, Quality Manager at Dtch. Digitals, explained jokingly, “When you’re 20 to 30 people, the word ‘Team’ makes sense, but when we became bigger, it sounded like a volleyball club.”
To attract larger clients and talent, the agency rebranded to “Dtch. Digitals” and embraced a more modern, digital, and professional identity.
But the rebranding wasn't just cosmetic. They also realized they needed to level up their reporting tech stack to meet the demands of growing team and clients.
“We wanted to make reporting more professional for our clients and ensure it aligned with our rebranding,” Stef shared.
Outgrowing a Static Reporting Tool
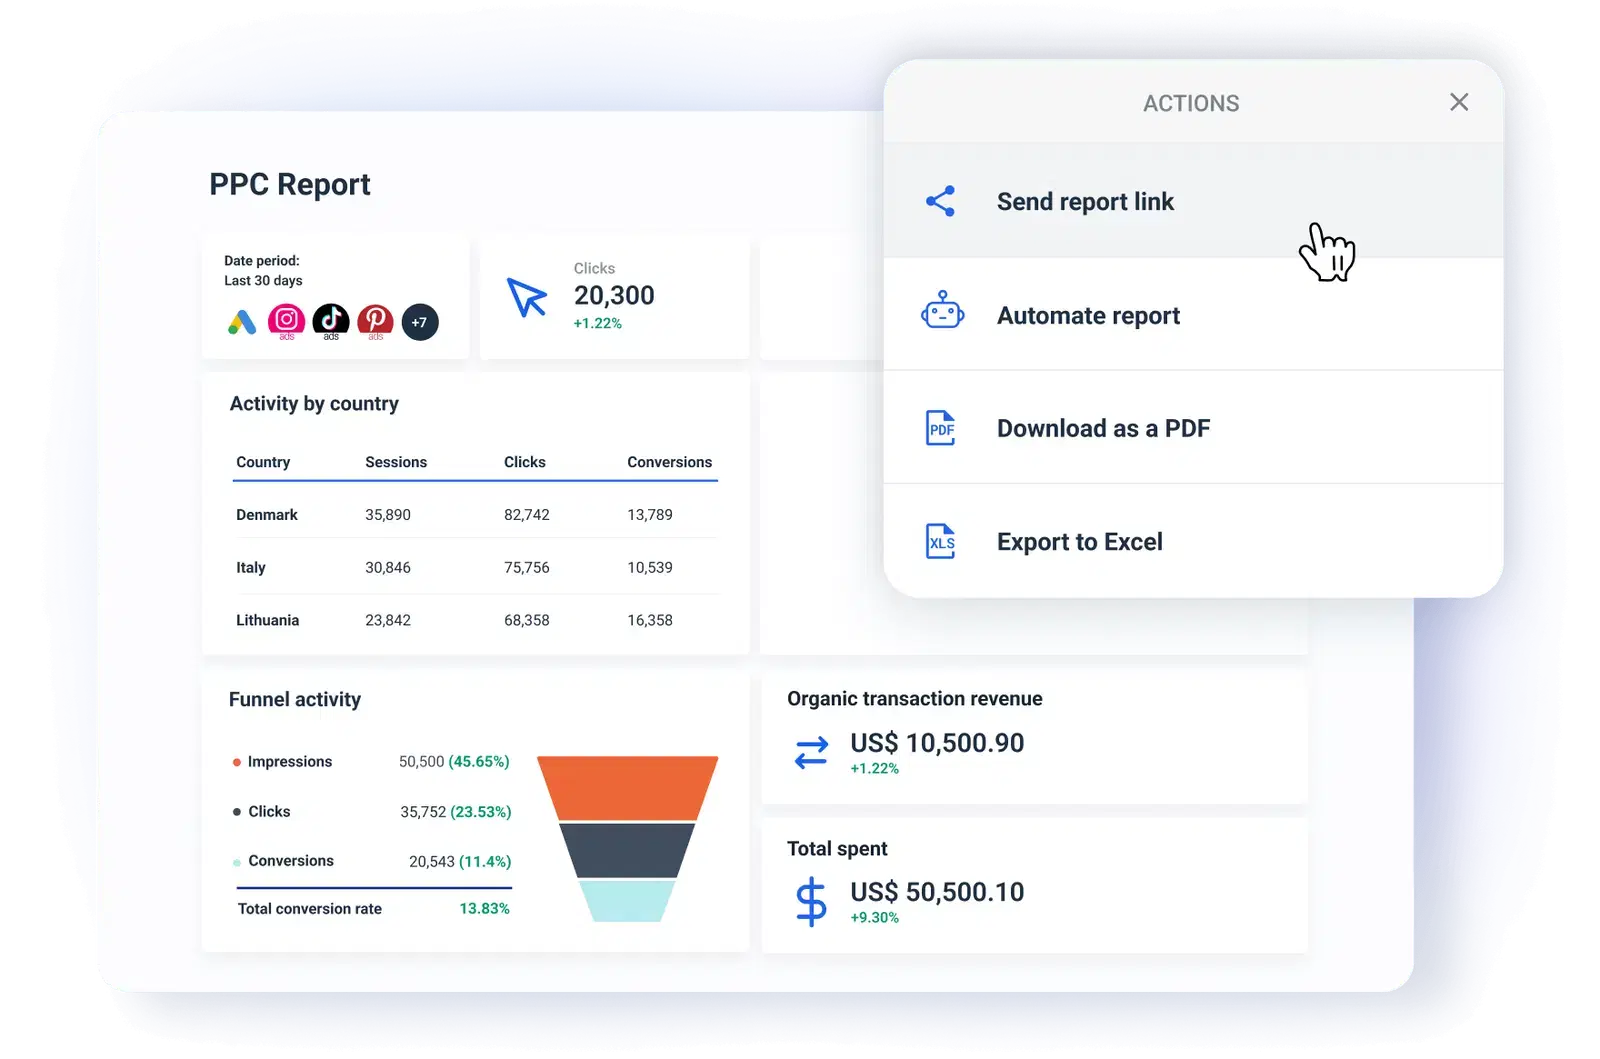
The agency’s legacy reporting tool, which generated static PDF reports, became a bottleneck as they scaled.
The reports only included tables with numbers, lacking clarity and failing to engage clients. This could potentially lead to churn issues in the future.
“Clients get bored if the reports are just a bunch of numbers,” Stef explained. “And they’re more likely to move to other agencies if they think the results aren’t good.”
The reports were also not very customizable. Team members were copying basic templates, connecting the clients’ data sources, but not adjusting the KPIs of each client.
Clients were also expecting more frequent updates—weekly or even real-time—but the tool wasn’t built for live reporting. To fill the gap, internal teams started creating their own dashboards, leading to inconsistent client experiences.
The tool also lacked integrations with the channels the agency needed, resulting in disparate reports.
“The reporting process became a mess, and we really needed to clean it up,” Stef shared.
As the team grew, the lack of standardization in reporting became a bigger problem, particularly when onboarding new employees.
“I was convinced that if we kept using the old tool, we wouldn’t be able to scale up,” Stef said. “We needed to make sure everybody was onboard with the tool and that new team members would work the way we do now.”
Despite efforts to make the old system work, the internal team struggled to adopt the tool consistently. “Our old partner tried to help, but it didn’t make a difference,” Stef said. “We couldn’t get people to move towards it.”
To standardize reporting for both clients and teams, Dtch. Digitals knew it was time to replace their legacy tool with a completely new reporting platform.
We wanted to make reporting more professional for our clients and ensure it aligned with our rebranding.
Solution
Easy-to-use, Customizable, and Real-Time Reporting Tool
The goal was clear to Dtch. Digitals: implement a scalable, visually appealing, live dashboard system.
Initially, the agency tried Looker Studio but quickly realized it created more problems than it solved.
“We needed to use Looker Studio with Supermetrics to connect all the data sources, and the setup took too much time,” Stef shared. “Using it the way we wanted became more and more complex.”
Whatagraph entered the picture at exactly the right moment, offering a solution that caught the interest of Dtch. Digitals’ Board of Directors. “We started testing Whatagraph, and that helped us make the decision to move forward,” Stef said.
Phase 1: Proof of Concept and Onboarding
During the Proof of Concept period, two things stood out to Stef: the flexibility of the Whatagraph team and the platform’s ease of use.
“We were in the middle of the rebranding and there was a lot going on, but Whatagraph was patient with us,” Stef explained. “They gave us enough time to fully onboard and make the right decision.”
Stef also appreciated how intuitive the platform was. “Most things are plug and play,” Stef said. “Our specialists just started experimenting. When they needed help, they’d ask colleagues or use the live chat. It’s very easy to use.”
Within one month, Dtch. Digitals onboarded over 250 clients onto Whatagraph, a feat made possible by the platform’s intuitive design and the team’s collaborative approach.
Phase 2: Implementation
Today, Dtch. Digitals uses Whatagraph across 300+ clients to keep them informed and engaged while standardizing the reporting process for their team.
Clients not only get a monthly report but also a link to a live dashboard. This meant that the team at Dtch. Digitals didn’t need to create weekly reports from scratch—clients could simply log in and see fresh data themselves.
 Both the dashboards and reports are fully white-labeled to reflect Dtch. Digitals’ new branding, with custom colors, images, and even email domains. In contrast, with the previous tool, Stef could only upload a logo.
“The look and feel of the reports is way more professional compared to before,” he noted.
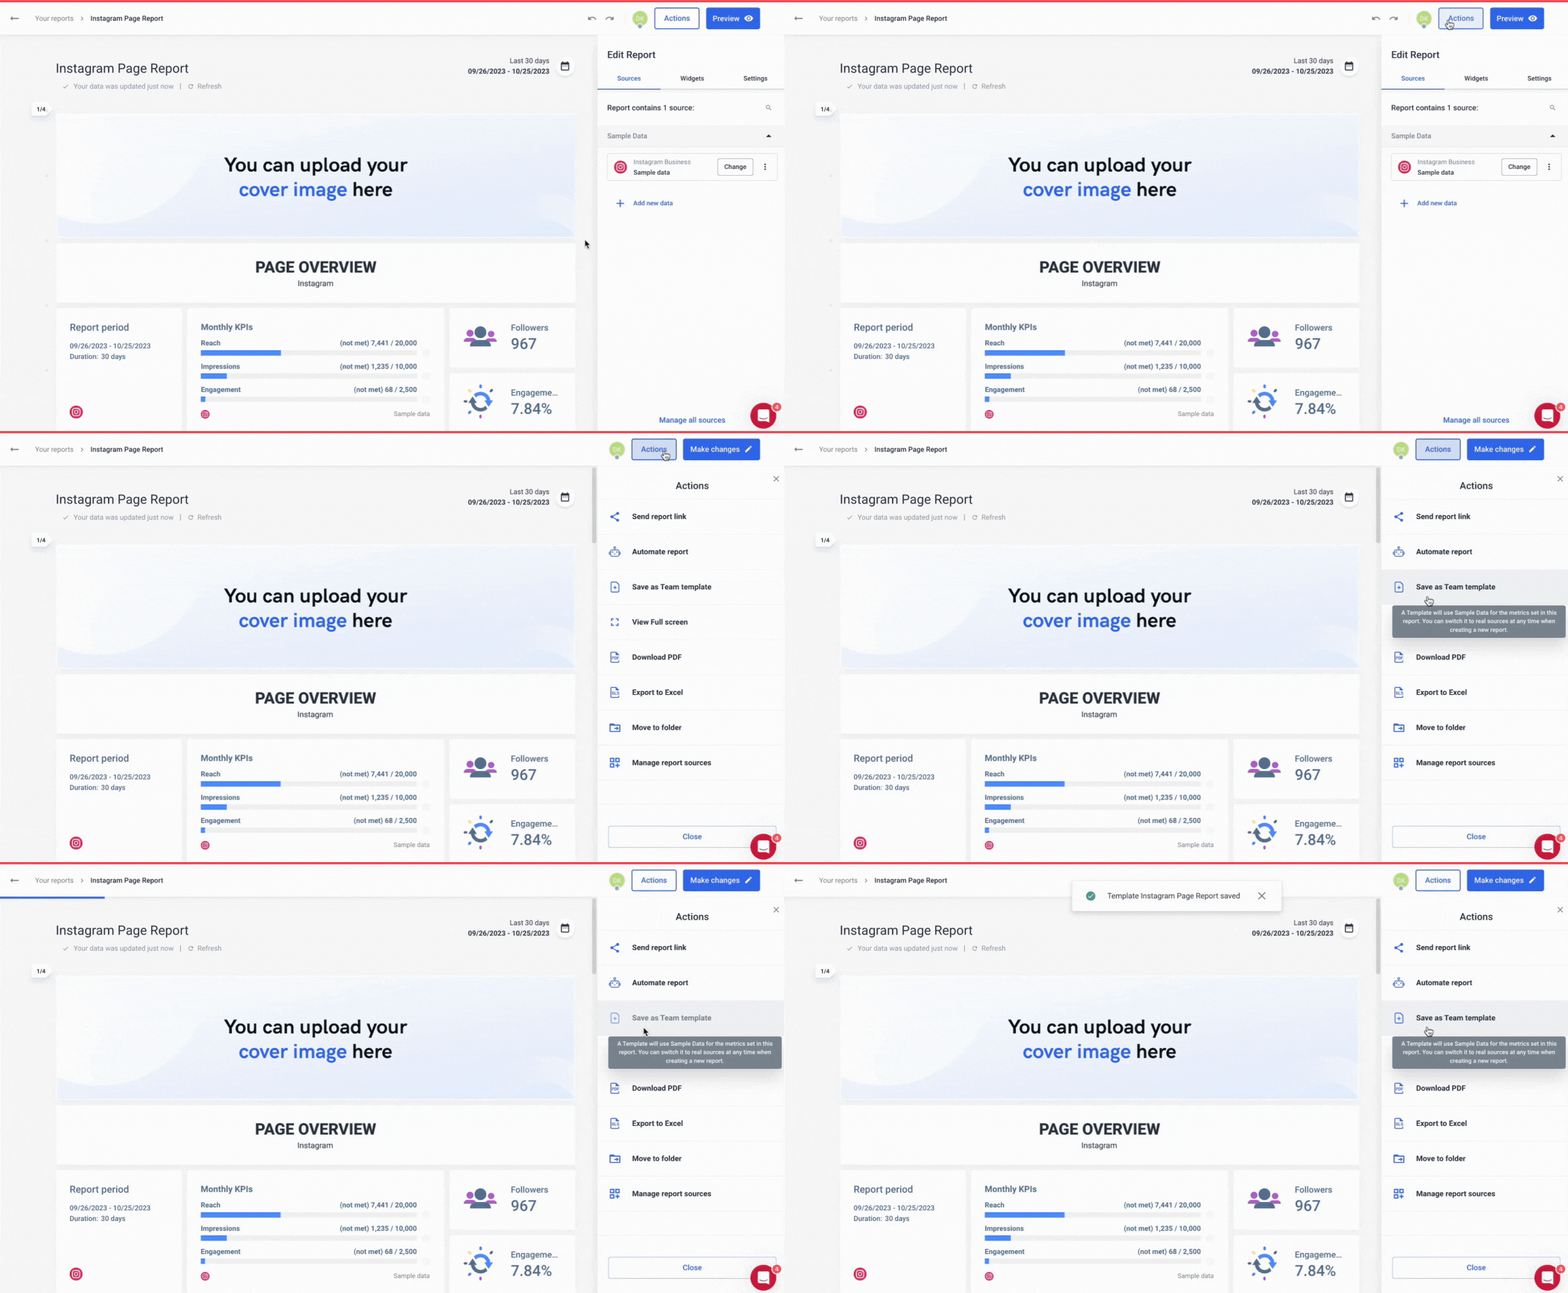
![]() To further standardize reporting, the team created four reporting templates tailored to their main client segments:
To further standardize reporting, the team created four reporting templates tailored to their main client segments:
- E-commerce B2C
- E-commerce B2B
- Lead generation B2C
- Lead generation B2B
These templates not only ensured consistency, but also made it easier and faster to onboard new employees and clients. For instance, a new team member could easily use one of these templates to create a polished, on-brand report for a client in minutes.
In fact, Stef said, “The basic report takes only about half an hour, but adding client-specific KPIs can take one to two hours, depending on complexity.”
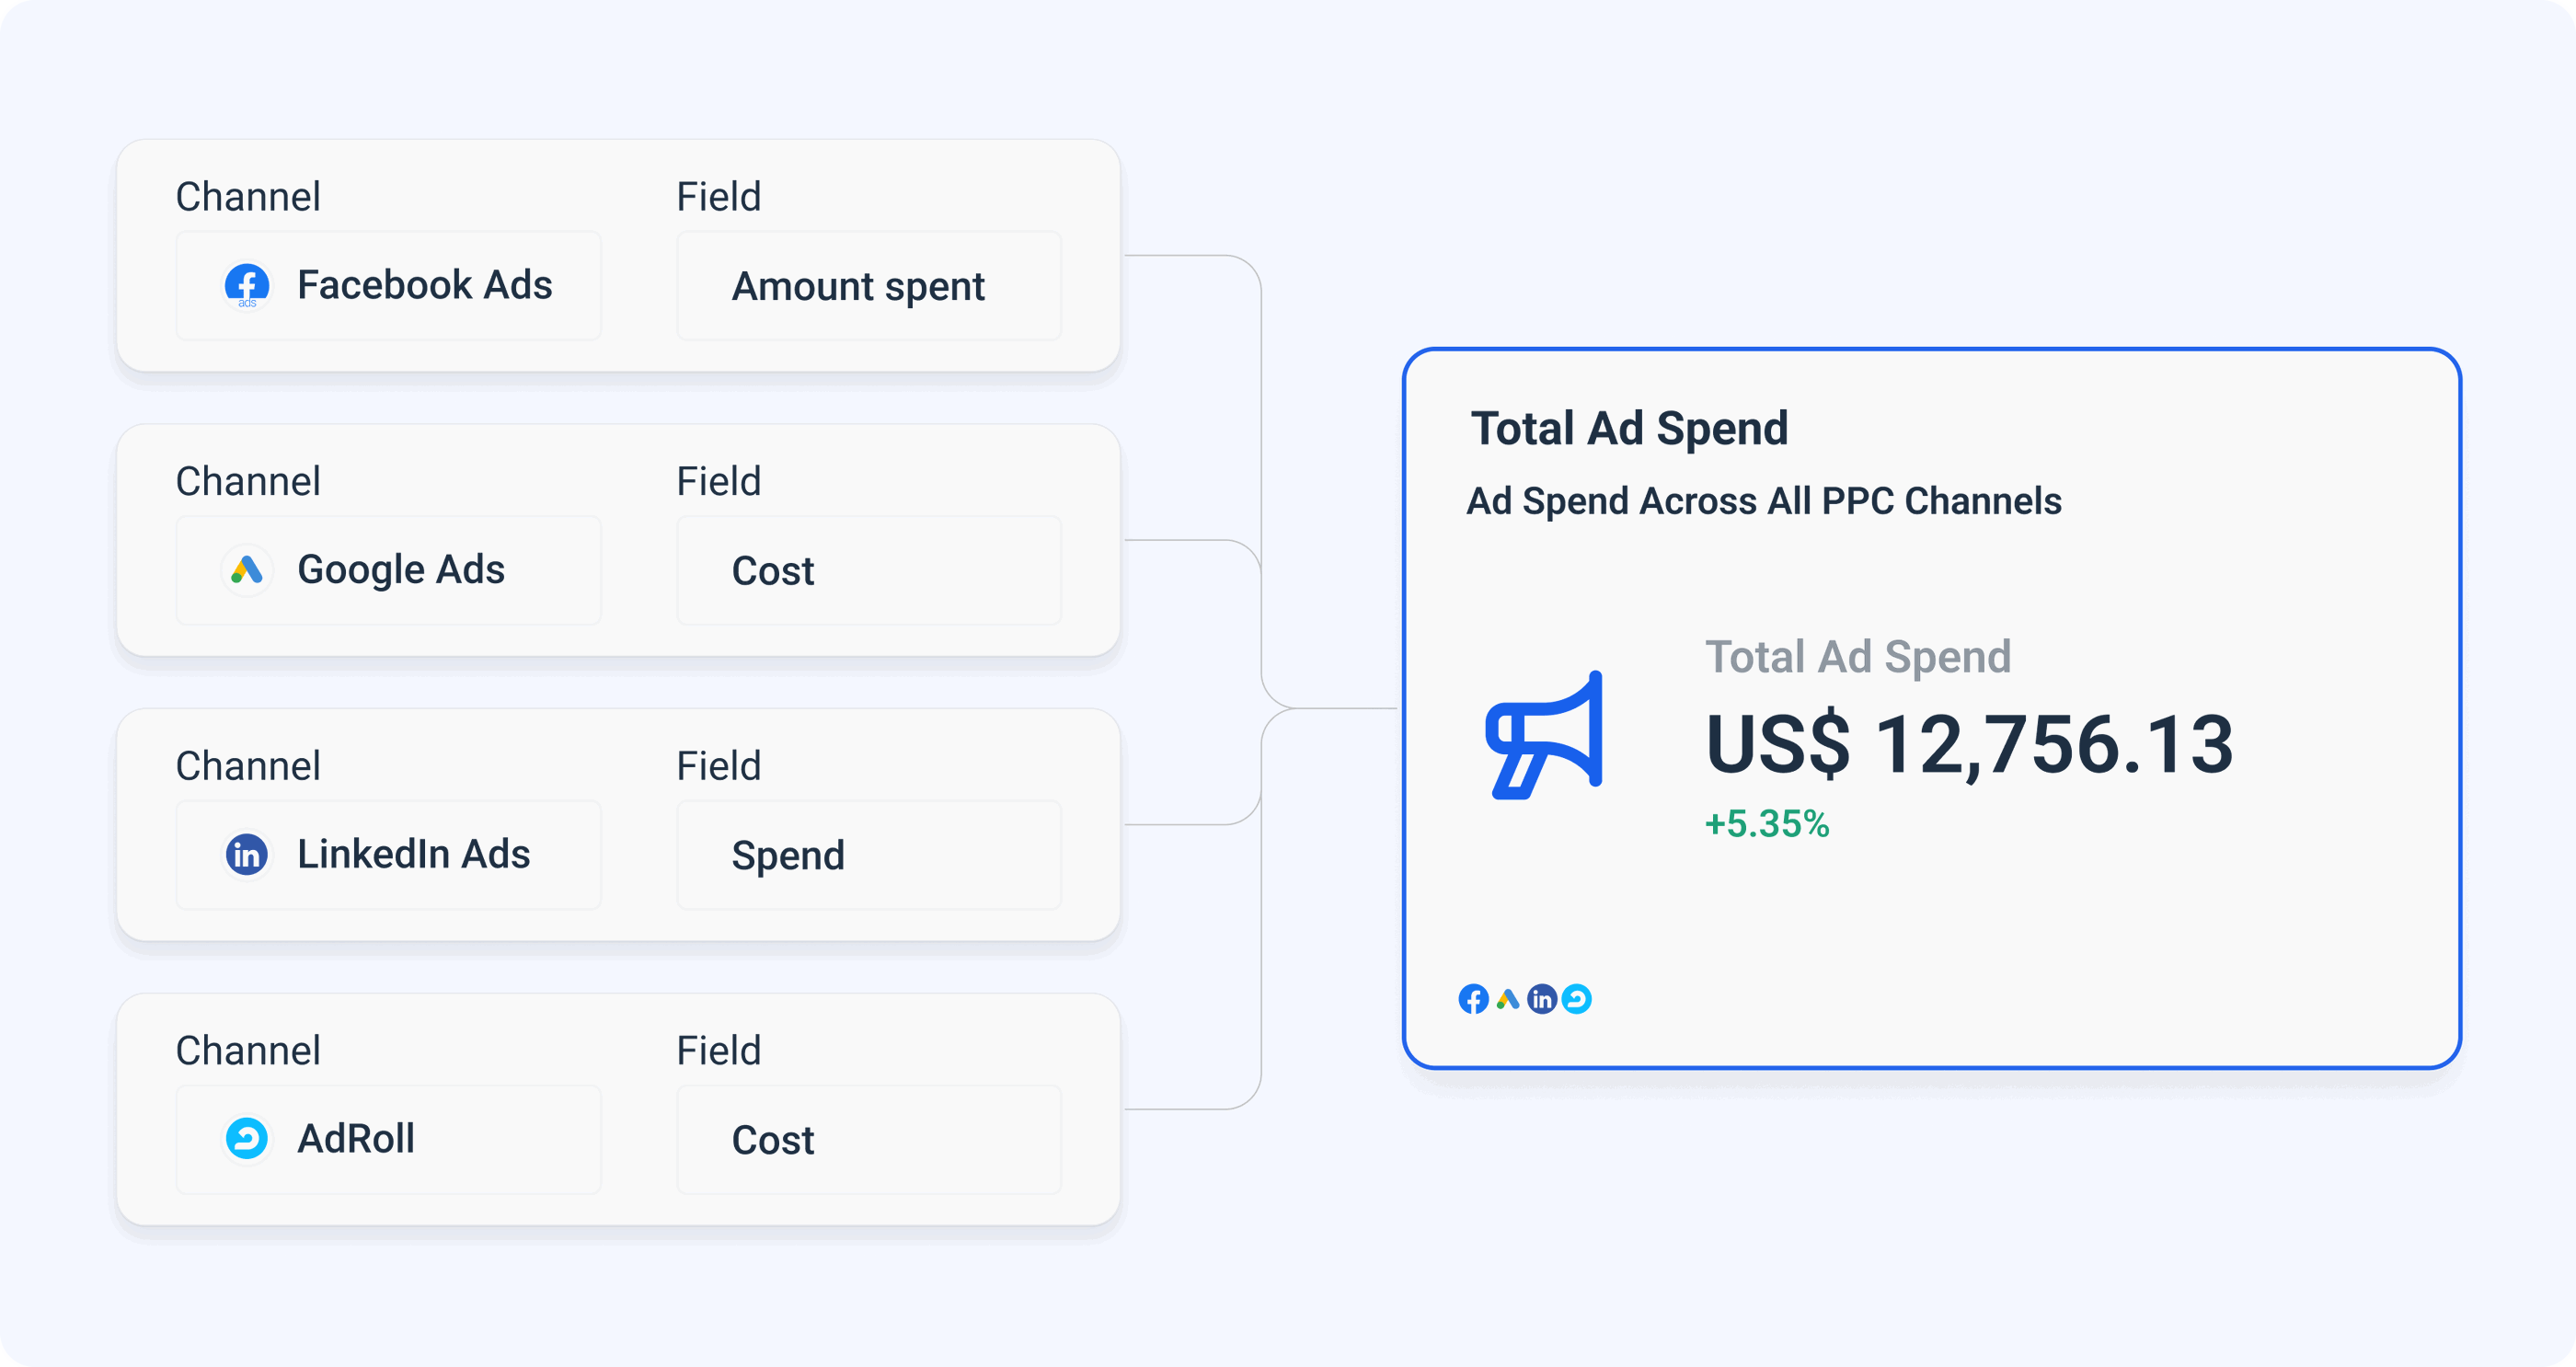
 The team also uses the Organize feature to combine data from different sources and channels and show the total results in one widget. This meant Marketing Specialists no longer needed to create disparate reports—everything is neatly visualized in one key report.
“Clients can see the total results in one place, without jumping between different sheets or reports,” Stef said. “This avoids confusion, especially for those who might not fully understand online marketing.”
 Phase 3: Adoption
Internally, all of Dtch. Digitals’ Marketing Specialists now relies on Whatagraph for reporting.
The team uses the dashboards to monitor metrics before client meetings and ensure the data is accurate. “We make sure the figures in the dashboard are always paired with an explanation from our specialists,” Stef shared.
If they run into issues or just have questions, they could easily reach out to Whatagraph’s live chat support, which responds within one minute.
“The support team is very responsive,” Stef said. “This makes it easy for us to give feedback, think of solutions, and get the right data visible for clients quickly.”
Issues get resolved promptly, with daily follow-ups for more complex ones.
“9 out of 10 cases, the issue gets resolved,” Stef estimated. “Most are fixed within a day.”
Apart from the live chat, Stef also appreciates how receptive Whatagraph is to product feedback. If there is a feature or an integration Stef needs, he simply puts in a feature request.
“I’d say 80 to 90% of the necessary features we’ve requested have been implemented,” Stef shared.
Clients are also happy with the dashboards. “Clients are more satisfied with the reports and dashboards now,” Stef said. “They tell us this is the way forward for us.”
Over a year after adopting Whatagraph, Dtch. Digitals now relies on the platform to standardize reporting and deliver professional, fresh insights to their growing client base.
The look and feel of the reports is way more professional compared to before. Clients can see the total results in one place, without jumping between different sheets or reports.
Results
Professional Reports, 50% Decrease in Churn, and Breaking Even
The most significant impact Dtch. Digitals has seen with Whatagraph is the improvement in visuals and overall professionalism.
While with the old reporting tool, the visuals were static and old-fashioned, with Whatagraph, the agency now has sleek, professional reports that align with their new identity.
These reports also made it easier for the Dtch. Digitals team to highlight and discuss the results of their marketing campaigns with clients.
“Whatagraph’s reports are now our foundation for discussing results with clients,” Stef shared. “And thanks to attractive visuals, clients can see the professionality behind our agency.”
In fact, since adopting Whatagraph, Dtch. Digitals have seen a 50% decrease in churn.
“Whatagraph really helps us to get clients on board, but also to keep our clients within the agency. Our churn rate is very, very low,” Stef pointed out.
Digitals have also broken-even on the cost of Whatagraph by introducing report licensing fees for clients. Previously, the agency covered the full cost of their reporting tool, which became unsustainable as they grew.
“We don’t want to make money from the licensing fee, but it helps us cover costs and avoid financial problems in the future,” Stef shared. “This is a big improvement compared to when we paid the full cost ourselves.”
The switch to Whatagraph has also reduced dashboard costs by approximately 10%, further supporting the agency’s financial health.
Data accuracy is another critical area for Dtch. Digitals, and Whatagraph delivers on that front.
“Google and Meta data are always correct,” Stef noted. “We’ve had some issues with Ahrefs due to its API, but that’s more on their side than yours.”
In terms of report performance, Whatagraph has proven to be much faster and more stable than their first choice—Looker Studio.
“Compared to Looker Studio, it’s a huge difference. Looker Studio is way, way slower,” Stef shared.
When asked if he would recommend Whatagraph to other agencies, Stef didn’t hesitate.
“Yes, I would,” he said. “It’s easy to use, visually attractive, and much smoother compared to tools like Looker Studio.”
Whatagraph not only helps us to get clients on board, but also to keep them within the agency. Our churn rate is very, very low.

