Google Display and Video 360 Dashboard and Reporting Software

Monitor and report your client’s reservation and programmatic ads performance with our Google Display and Video 360 dashboard and reporting software. Get all your KPIs in one place and transform them into actionable insights. Easily track and analyze your PPC metrics, such as impressions, video starts, fullscreen views, and completions, with our DV360 dashboard. Connect your Google Display & Video 360 account to build engaging paid advertising reports in minutes. Automate report sharing through scheduled emails or live links.

Google Display and Video 360 Dashboard and Reporting Software

All-in-one Google Display and Video 360 dashboard to monitor and share all your PPC performance

Powerful DV360 analytics with clear data insights

Turn engagement and conversion metrics from your DV360 account into actionable insights to help you reach goals, drive growth, and retain your clients. Our DV360 reports come pre-loaded with the essential widgets to track your clients’ impressions, clicks, total media cost, and revenue from programmatic ads, plus 40 more graphs, tables, and other widgets to choose from. Dive deep into paid ads attribution analysis while reporting simple and straightforward metrics to clients. Whatever side of the dashboard you are sitting on, everything is presented in a clean and intuitive interface.

Powerful DV360 analytics report with clear data insights

DV360 reporting software for agencies

Our all-in-one platform for performance monitoring and reporting is ideal for large marketing agencies. Save time each day by automatically reporting relevant DV360 metrics to every client alongside all of your other programmatic and social media PPC channels. Share all insights in an intuitive DV360 dashboard with stunning visualizations and save 40+ hours each month on tracking performance and reporting to clients. Whatagraph is an end-to-end solution for reporting marketing performance at scale.

DV360 reporting software for agencies

Save time and automate DV360 reporting

Streamline your client report process with our Google Display and Video 360 reporting software. Pull data directly from your DV360 account to our dashboard. Customize each PPC report in seconds via a drag-and-drop interface, then schedule them to send daily, weekly, monthly, or quarterly. Add a review step before the automated send out. Edit up to hundreds of reports at once using a master template. Save any widget or new report page as a new template.

Save time and automate DV360 reporting

Build a custom Google Display and Video 360 dashboard in minutes

Pick from over 100 Google Display & Video 360 metrics and create standalone DV 360 dashboards or easily combine data from different integrations and build cross-channel dashboards in Whatagraph.

More than just DV360 insights

Easily combine your Google Display & Video data with metrics from over 50 marketing platforms to get a big picture of the client campaigns you are running. Include audience behavior data from GA4, the high-converting keywords from Semrush, engagement, and local traffic from Google My Business. A holistic view of each client’s online presence helps you identify issues and optimize their ad messaging. But why stop at paid advertising? Connect analytics data from social media, e-commerce, email marketing, and CRM sources for a complete picture for every client.

More than just DV360 insights

White-label DV360 reporting

Present each DV360 report or dashboard with your agency’s branding. Add your logo, color, scheme, URL, and even your own domain for the client login screen and emailing reports. Show your clients your agency’s branding instead of ours. Client’s prefer their own branding for internal use companywide? Easily adapt our white-label DV360 dashboard to include different logos and themes for every client.

White-label DV360 reporting

Share reports and dashboards in a few clicks

Your clients rarely read reports? Our DV360 reporting software has everything you need to make your reports actionable and engaging to clients. Add notes, explanations, media widgets, and comments to every report or dashboard you create. Explain engagement and conversion metrics to clients and demonstrate value by highlighting your agency’s achievements across each marketing and SEO channel. Share any programmatic ads dashboard via a live link so your clients can directly check the results of your hard work whenever they want.

Share reports and dashboards in a few clicks

All dashboard features your agency needs

50+ data sources

Create a true cross-channel digital marketing dashboard in Whatagraph. Over 50 integrations for your cross-channel marketing campaigns.

Live dashboards

Securely share interactive access to your dashboard at any time from anywhere.

Cross-channel insights

Include data from different sources into the same widgets or dashboards with a few clicks. Provide a full picture of your campaigns’ success.

White-label dashboards

Customize colors and logos in each dashboard to align it with your agency’s or clients’ branding and style.

What is a Google Display and Video 360 dashboard?

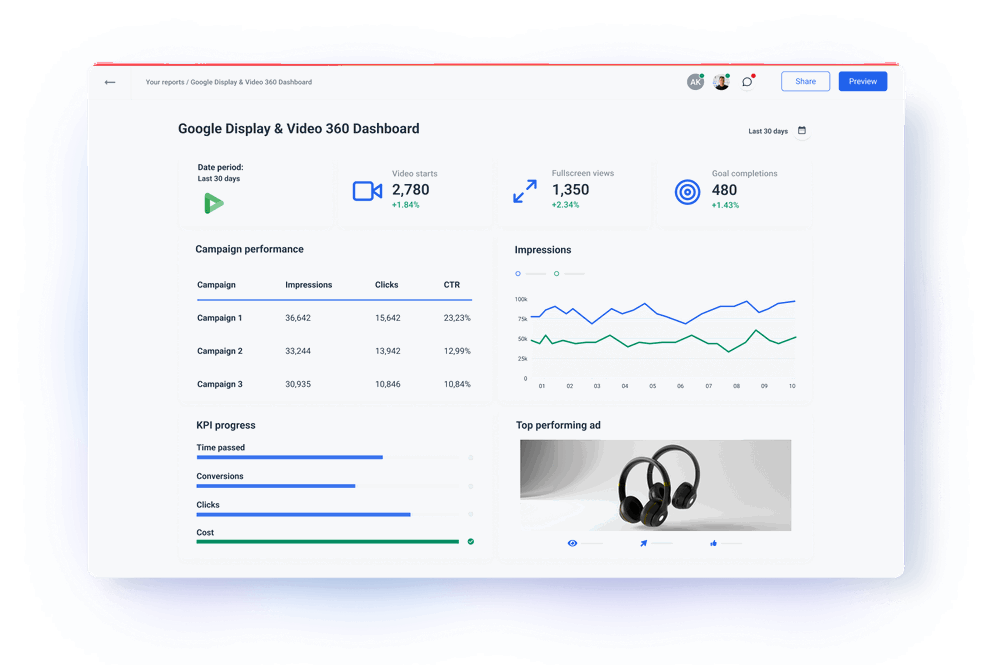
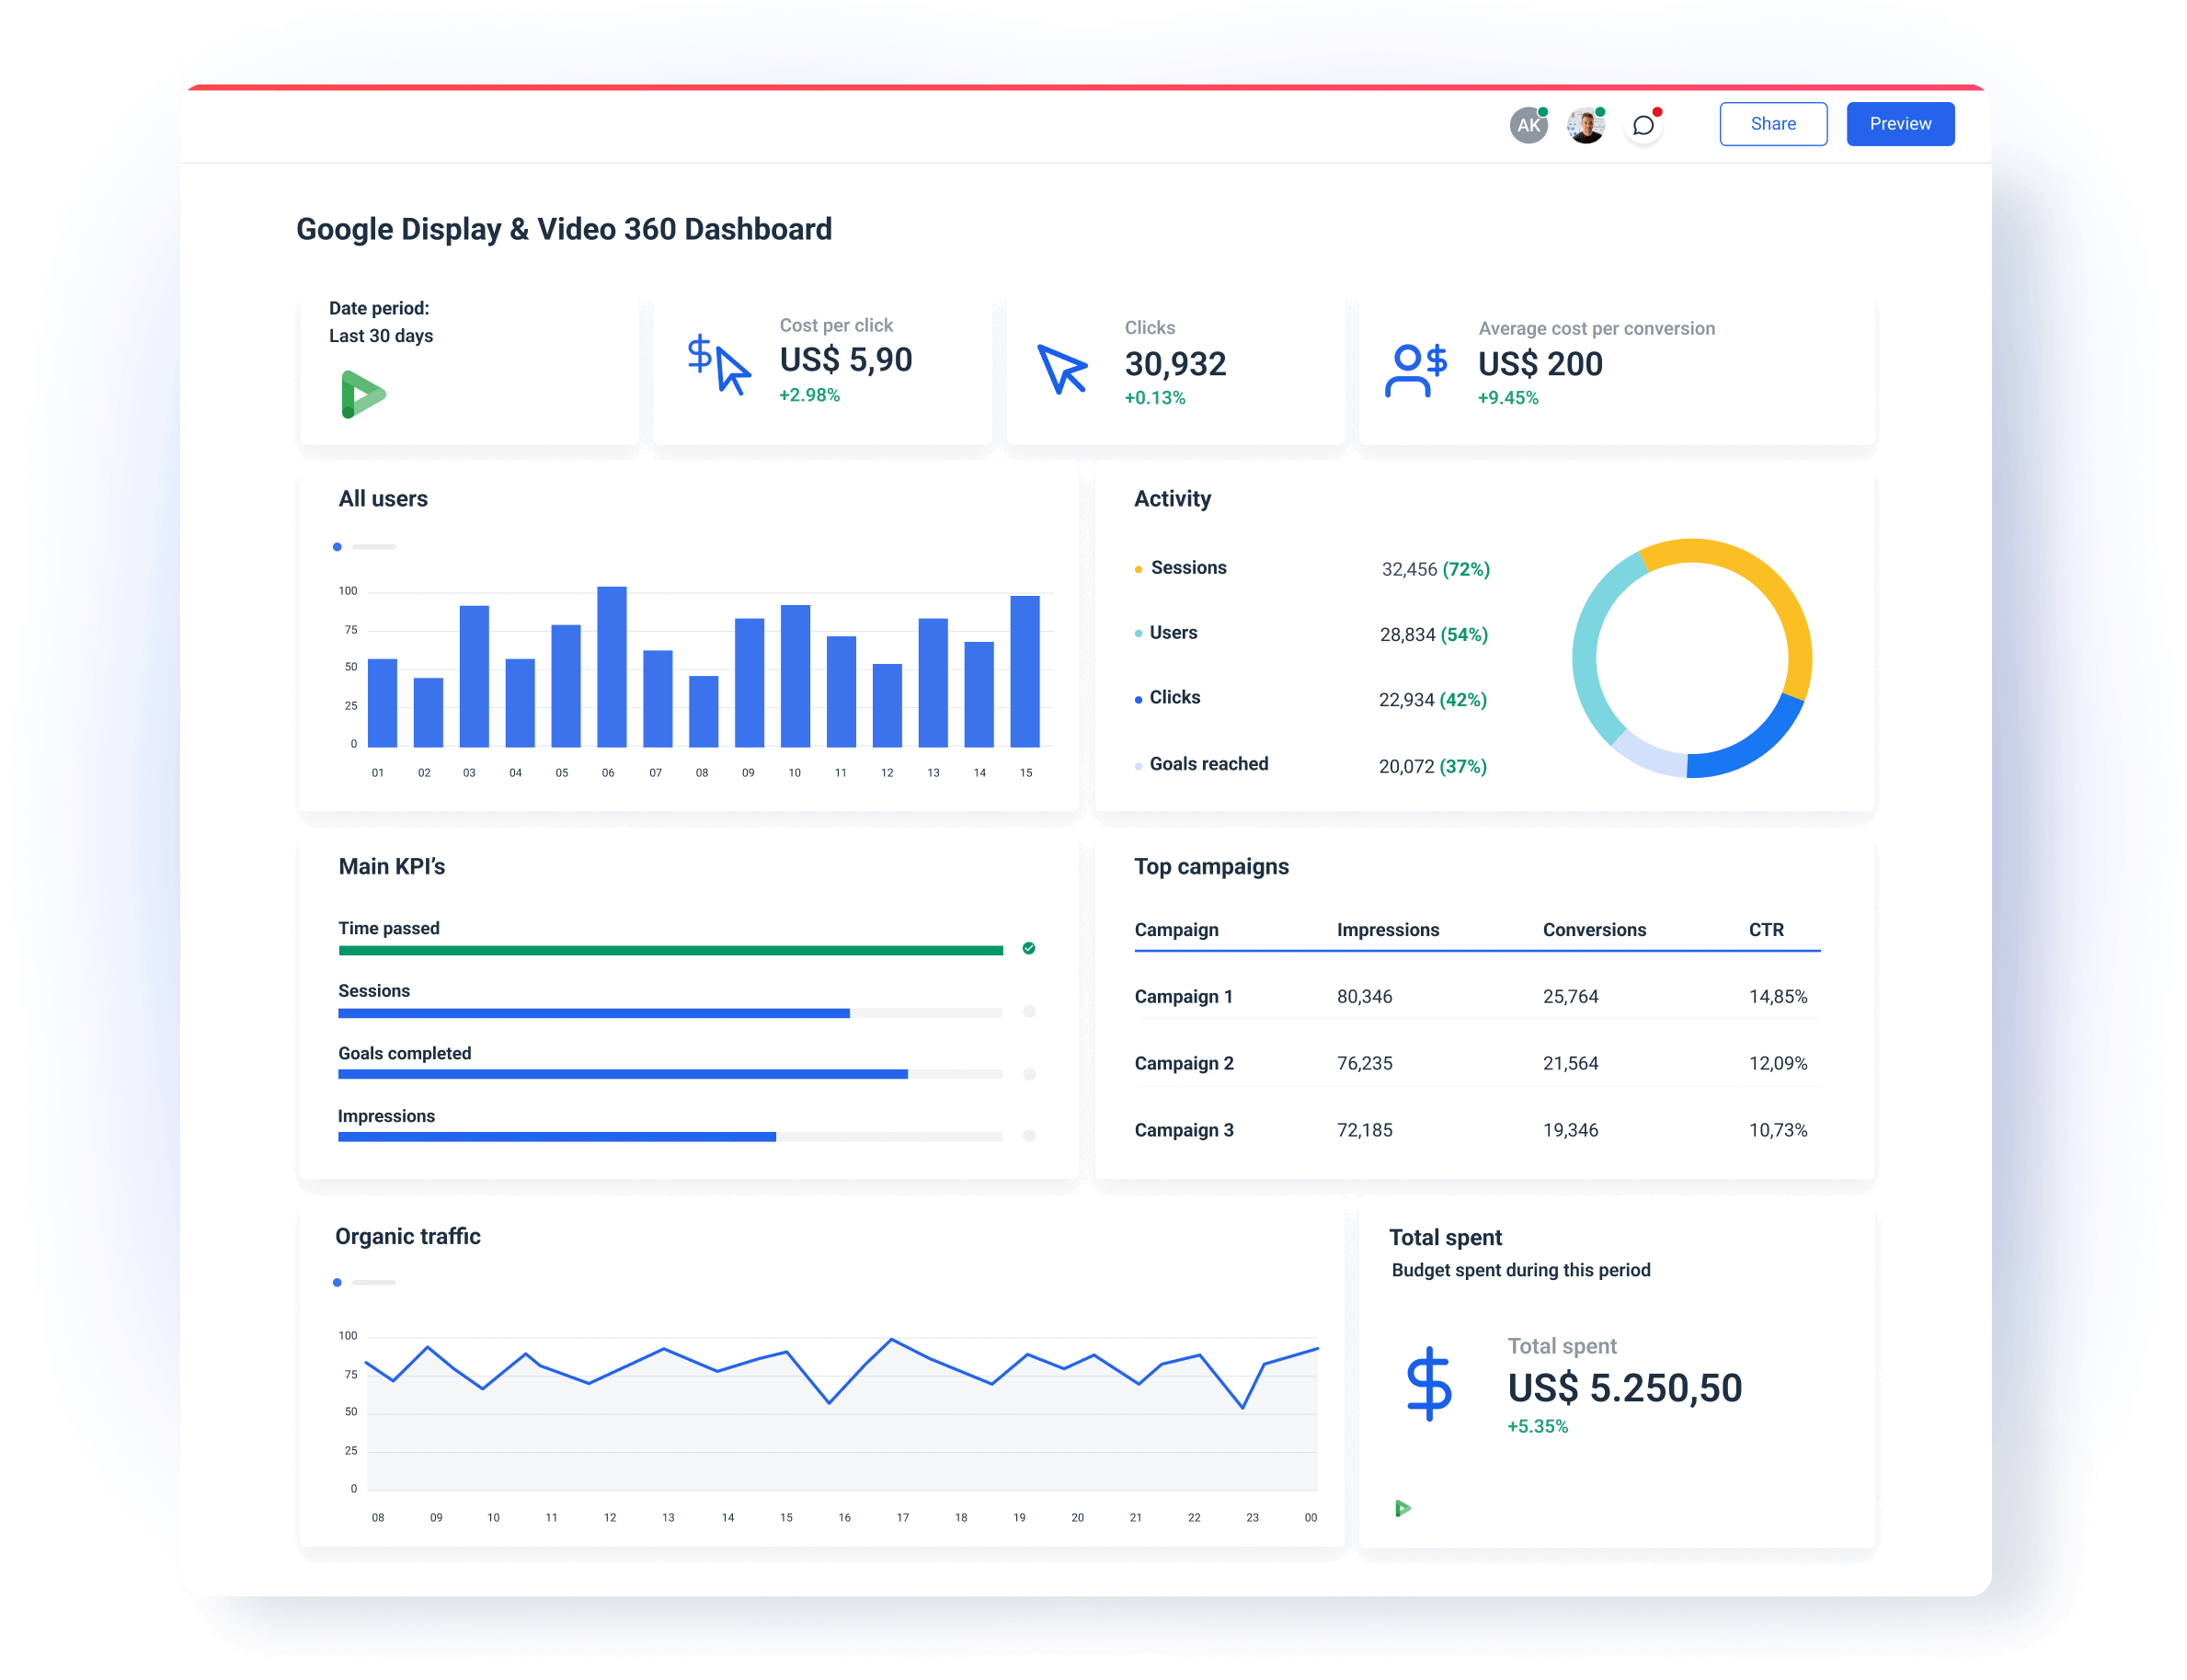
A Google Display and Video 360 dashboard is a dynamic display with all the essential audience targeting KPIs that marketers need to make informed decisions on improving their clients’ visibility and reach in programmatic advertisements.

DV360 dashboard in Whatagraph

What are the benefits of having all advertising metrics in one DV360 dashboard?

A consolidated dashboard that displays your Google Display & Video 360 data together with metrics from other advertising and other marketing platforms helps you:

  1. See the whole picture of the marketing campaigns you are running for your clients.
  2. Share simple yet accurate data-driven insights with your clients.

A single dashboard that gives a unified view of all this data is important for making sound decisions but also has other benefits:

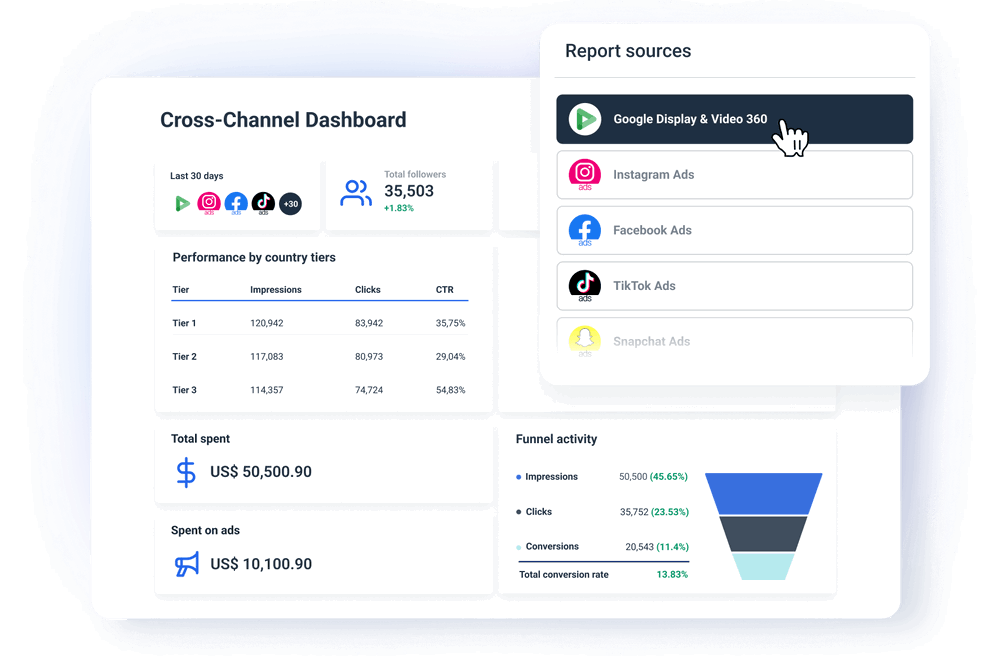
All your marketing data visualized in one place

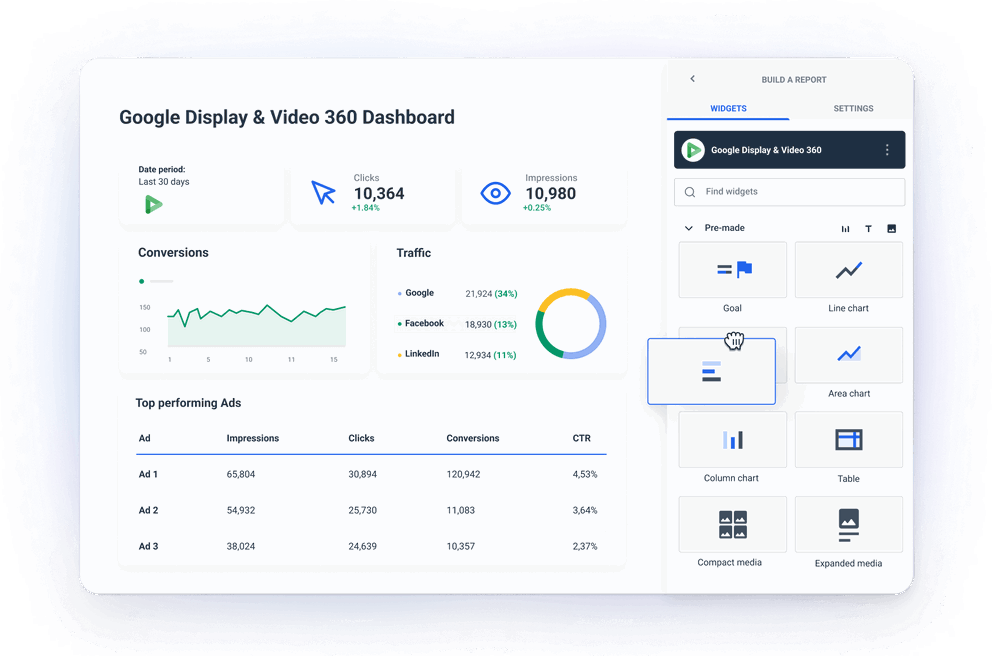
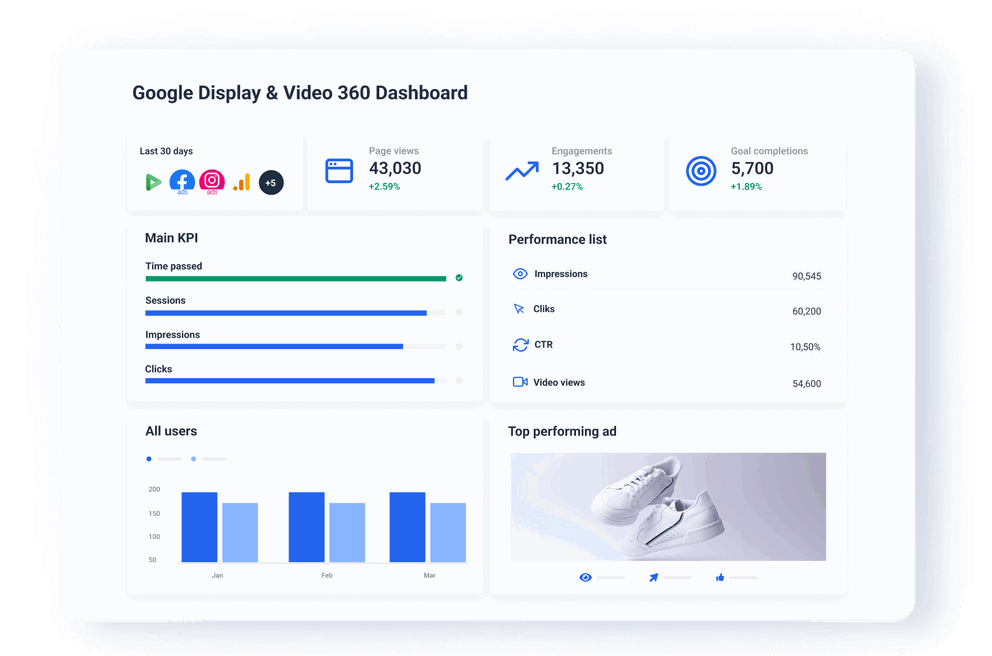
Our DV360 dashboard centralizes data from all your marketing platforms. Instead of manually pulling and stitching data from different ad accounts, social media, and email communications, you can quickly access all the data you need for decision-making in one place. This allows you to always stay on top of your programmatic campaigns.

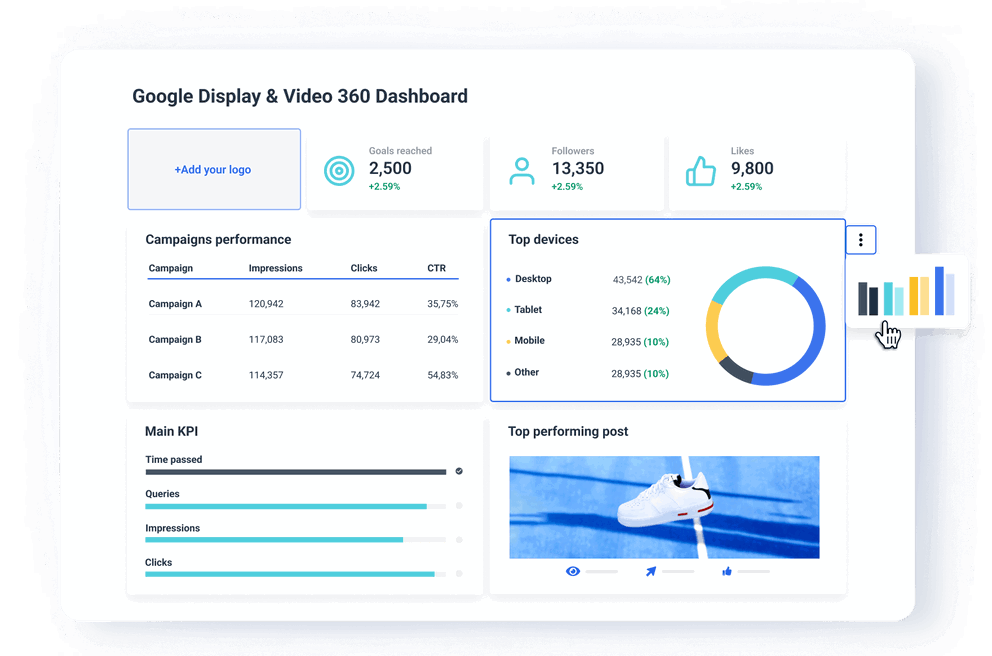
Accurate and fresh data at any time

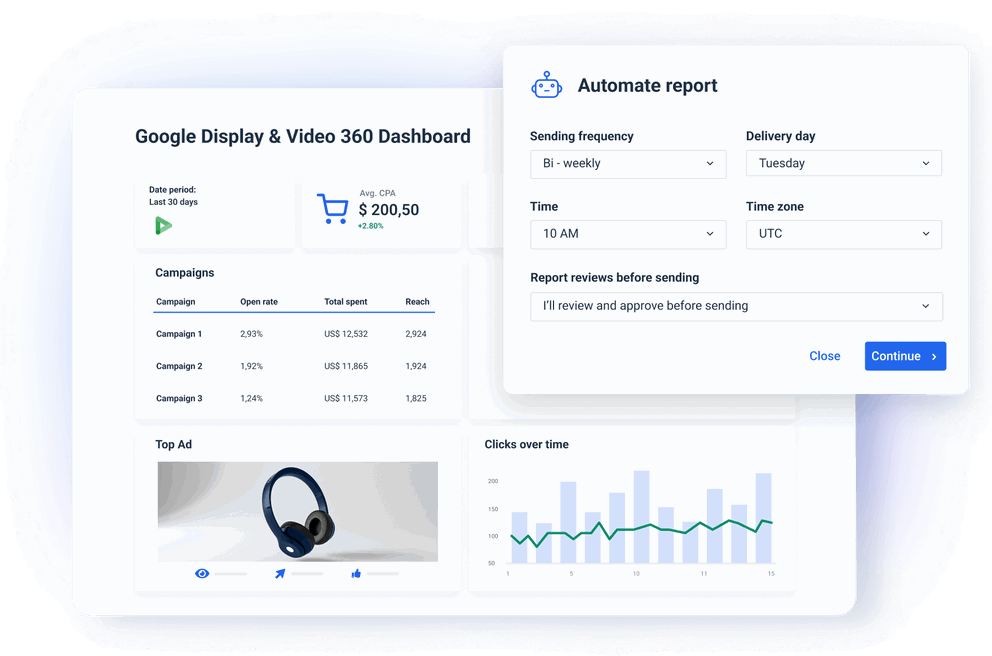
Whatagraph’s DV360 dashboards automatically refresh data every 30 minutes, providing you with the most recent insights into your marketing efforts. This eliminates the need to manually update data in your performance dashboards each time you need to analyze changes in your campaign performance. An automated dashboard saves time and increases the accuracy of the metrics you are tracking.

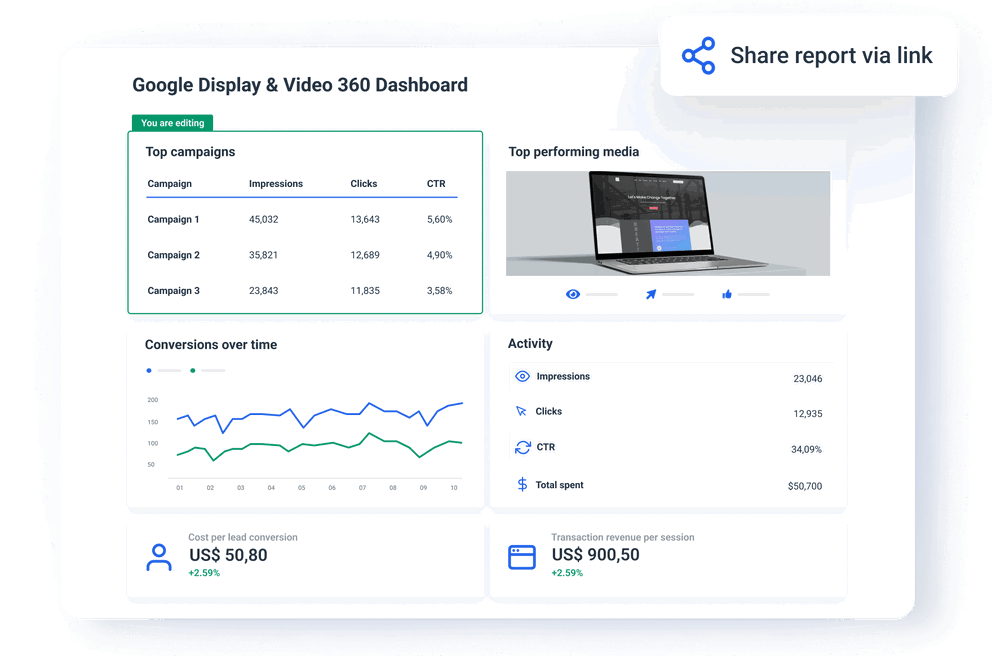
Transparent results at all stages of the funnel

A display ads dashboard that includes cross-platform data can reveal what happens when a lead goes from one stage of the funnel to the next. This improves cross-department alignment in multiple ways: Marketers can standardize the ad messaging and the lead qualification process, while the Sales can get more context on the lead so they can adjust their deck based on the channel, campaign, or message that brought the lead on a discovery call.

Standardized marketing metrics

Standardizing metrics and dimension names can be a hassle for marketers in large agencies or enterprise companies collecting data from different sources. Same metrics might share the same name on Google Marketing Platform, but be called differently on Meta, X, or other programmatic or demand-side platforms. As clients’ data is scattered across different ad accounts. Such and similar problems make it difficult to understand all marketing efforts clearly. Whatagraph has a user-friendly data transformation workflow that helps you standardize the naming across metrics and dimensions, aggregate, and blend data from different sources by your own rules.

It’s good to be loved! Our clients are not shy about expressing it.

I made a switch from GDS and Sheets for reporting to Whatagraph, and I am saving literal hours each week on performance report creation. Our small firm actually managed to onboard 2 new clients as a result of all the time we saved on managing data and reporting. The customer service is also really helpful and easy to reach.

Mindaugas S., Marketing Consultant Capterra logo for Whatagraph review

Capterra verified review by

Mindaugas S., Marketing Consultant

Having active customer support to help fix any issues was a big contributor, but we also really liked the ability to save templates and connect sources to multiple charts/widgets at once without having to edit them individually. And having the grid layout is much easier to stay consistent with than the free form setup that Data Studio has.

Nico T., Media Planner Capterra logo for Whatagraph review

Capterra verified review by

Nico T., Media Planner

The system has standard templates that are easy and fast to use. Also you can build your own report with lightning speed. It is very easy to use, has a lot of integration, and let get started very fast.

Rasmus Bernt K., External Senior Management Consultant Capterra logo for Whatagraph review

Capterra verified review by

Rasmus Bernt K., External Senior Management Consultant

We love Whatagraph - we would definitely recommend and our account manager is great! I love how easy this tool is to use, everyone on the team finds it much more user-friendly than other dashboards. Integration was easy, we sent some example reports to the team who duplicated these for us. We literally had to log in and send it to our clients!

Stephanie S., Digital Director Capterra logo for Whatagraph review

Capterra verified review by

Stephanie S., Digital Director

We are showing our clients the work that we're doing for them and this is incredibly important for our clients ROI. They want to see results and having a tool like Whatagraph that can show data from virtually every source we use is hugely important.

John S., SEO Strategist Capterra logo for Whatagraph review

Capterra verified review by

John S., SEO Strategist

The tool is easy to use; you do not need to have development resources. Even my junior project managers are capable of making campaign reports in minutes. There are a lot of pre-made templates you can use as well as many pre-made widgets.

Erman E., Marketing Specialist Capterra logo for Whatagraph review

Capterra verified review by

Erman E., Marketing Specialist

Really easy to connect data sources within the tool. The library of report templates has been helpful. The customer support team has been responsive to all of our needs. Our team enjoys the simplicity of setting up the reports and how the data is presented.

Brent N., Director of Operations Capterra logo for Whatagraph review

Capterra verified review by

Brent N., Director of Operations

Easy to create really beautiful graphs and reports which can help other team members to understand the most important takeaways. I especially like the automated report function, so I don't have to check on the same thing repeatedly.

Orsolya S., Online Marketing Manager Capterra logo for Whatagraph review

Capterra verified review by

Orsolya S., Online Marketing Manager

FAQs

All your questions answered. And if you can’t find it here, chat to our friendly team.

How to generate a report in DV360?

You can generate native reports in DV360 by following these steps:


1. From Report builder, click New reportInstant reporting (Campaign Manager 360). From ReportsInstant & offline > Instant reporting click New instant report (Display & Video 360).


2. Click Save to add your report to your report list.


You can edit the name of your report by clicking the edit icon. To name and save your report, click Save as. To clear the name and all dimensions and metrics, click Reset. To download all of the rows in your report, click the download icon.


This way of reporting is suitable for internal use, for example if you manage programmatic ads in a startup. However, for marketing agencies that report programmatic alongside other types of paid ads, plus the email campaigns, social media, and organic marketing channels, you need an advanced DV360 reporting tool that lets you add data from other sources, has an organize functionality and can automate most of the process.

Is DV360 better than Google Ads?

DV360 is a more capable demand-side platform that gives you more internet reach and the ability to narrow down your target demographic by placing ads more precisely than Google Ads. DV360 has far more campaign settings and controls to manipulate and agency-specific features such as budget, bid, and ad settings.

What other marketing channels can I connect with Whatagraph?

Apart from DV360, you can connect other tools from Google Marketing Platform, such as Google Analytics 4, Search Ads 360, Campaign Manager 360, and Google Ad Manager, SEO tools like Ahrefs, Semrush, and GSC, social media such as LinkedIn, Instagram, and Twitter, e-commerce platforms like Shopify and WooCommerce, email marketing tools like Klaviyo and Mailchimp, and CRMs like HubSpot and Salesforce.


If you can’t find the integration for your marketing data source, connect it via a Custom API or export it to Google Sheets docs or BigQuery data warehouse and add it as a source.

Need more help with getting started?

An image of the Whatagraph dashboard, with a custom reporting template

We can set up your report campaign for you!

If you need help with setting up Whatagraph - our team can create your campaign reports!

Ready for insights?

It's time to focus your time on the tasks that really matter, and let us worry about your marketing analytics. Start your free 7-day trial.

  • Free for 7 days
  • No credit card required
  • Live chat support
  • Cancel anytime
Start Reporting For Free

No credit card required

Cross channel reporting template with Whatagraph