


What can you do with a Google Sheets reporting tool?
Google Sheets reporting tools help you collect, connect, and present marketing data in a way that's actually useful - for your team and your clients.
Without one, Google Sheets reporting is a manual process:
❌ Export CSVs from each platform
❌ Paste them into the right tabs
❌ Fix broken formulas and reformat charts
❌ Repeat the whole thing next month
For agencies managing multiple clients across multiple channels, that cycle adds up fast. HubSpot found that agencies spend around four to five hours per client each month on reporting alone.
A dedicated reporting tool cuts that time down significantly. And the results speak for themselves. YourFellow, a performance marketing agency in the Netherlands, was spending one full day every week just building and maintaining dashboards in Funnel and Looker Studio. After switching to Whatagraph, they cut their reporting time in half and saved up to 65% on costs.
A good Google Sheets reporting tool lets you:
✅ Pull your Google Sheets data - budgets, offline conversions, CRM exports, custom KPIs - into branded client reports
✅ Build full reports in seconds, complete with charts, widgets, and the metrics that matter to each client
✅ Blend Google Sheets data with live sources like Google Ads, Meta, and GA4 in a single unified view
✅ Automate report delivery so clients get their updates on schedule, without anyone on your team lifting a finger
✅ White-label every report so it looks like it came from your agency, not a third-party tool
With Whatagraph IQ, the process gets even faster. Rather than configuring reports from scratch, you can:
- Describe the report you need and let AI build the full structure for you - tabs, widgets, charts, and all
- Apply branding in seconds by uploading your client's brand book or typing a quick prompt
- Generate written performance summaries that pull directly from your dataset, so you're not writing commentary from scratch each month
- Ask IQ Chat plain-language questions about your data and get instant answers, without opening a single spreadsheet
Whatagraph has also launched an MCP that lets you connect your data to Claude or ChatGPT and analyze your data there.
YourFellow even used Whatagraph to push their marketing data back into Google Sheets via BigQuery. This helped to keep their existing workflow fully working while still getting all the reporting benefits of Whatagraph.
I would recommend using Whatagraph, because it's just easy, and almost anything is possible - like custom calculations, niche connectors, and exporting to Google Sheets with BigQuery in between. - Linda van Baal, Online Marketing Consultant at YourFellow
What is the best Google Sheets reporting tool?
There are plenty of tools that claim to work with Google Sheets data - but most either treat it as an afterthought integration or leave you doing half the work manually anyway.
If you're looking for a Google Sheets reporting tool that genuinely saves time and delivers reports clients actually want to read, here are the three best options:
1. Whatagraph - Best Google Sheets reporting tool for agencies
Whatagraph is built for performance marketers who need to move fast, not data engineers who live in SQL.
Rather than stitching together a reporting stack from connectors, spreadsheets, and dashboards, you get one platform that connects your Google Sheets data alongside 60+ other marketing sources - and turns all of it into polished, client-ready reports.
Here's what makes it stand out for Google Sheets reporting:
- Google Sheets as a data source: Pull in budgets, CRM exports, offline conversion data, custom KPIs, or any spreadsheet data you've built - and combine it with live channel data from Google Ads, Meta, GA4, and more
- 60+ native integrations: Connect all your marketing channels in a few clicks - no third-party connectors, no middleware, no broken links
- Cross-channel Google Sheets reporting dashboard: Blend data from multiple sources into one unified view, with custom metrics and dimensions you define
- Google Sheets as a destination: Push your marketing data back into Google Sheets via BigQuery for deeper analysis, product feed management, or any workflow that lives in spreadsheets
- Whatagraph IQ: A full suite of AI features built directly into the platform
With Whatagraph IQ, building custom reports stops being a task:
- Generate full reports from a prompt: Describe what you need, and IQ builds the entire report - tabs, widgets, charts, and all the right metrics pulled from your connected sources
- Brand reports in seconds: Upload a screenshot of your client's brandbook or type a quick description, and IQ applies colors, fonts, and styling across the whole report automatically
- AI-written performance summaries: IQ reads the actual data on your report and writes the commentary for you. Edit it, adjust the tone, or send it as-is. No hallucinations - it's working from your real numbers
- IQ Chat for instant answers: Ask things like "Which campaigns drove the most conversions from Google Sheets data last month?" and get an answer immediately - no pivot tables, no digging
The result? You go from connected data to a finished, branded client report in under 30 minutes.
The time savings are real. Maatwerk Online cut 100 hours of manual reporting per month after moving to Whatagraph.
The hours that we’re saving with Whatagraph are just pure profit. We now have time to focus on more strategic things that actually help both our agency and our clients grow. - Lars Maat, Co-Founder at Maatwerk Online
Start a free trial with Whatagraph today.
2. DashThis - Best lightweight solution for freelancers or small teams
DashThis is a lightweight reporting tool focused on getting basic marketing dashboards live quickly. It connects to common channels like Google Ads and Facebook Ads, and works well for teams with straightforward reporting needs and a smaller client roster.
Key features:
- Pre-built templates for common marketing channels
- Scheduled PDF and email report delivery
- Simple, clean dashboard design with minimal configuration
Keep in mind, though, if you rely on custom metrics, blended sources, or want to use Sheets as a live data input, you'll quickly hit DashThis’s ceiling.
3. AgencyAnalytics - Best for smaller agencies that want white-labeled reports
AgencyAnalytics covers SEO, PPC, and social reporting under one white-labeled roof. It's straightforward to get started with, and the white-labeling options make it easy to put your agency's brand on client reports.
Key features:
- White-label reports, dashboards, and client login areas
- Integrations with Google Ads, Facebook Ads, and other common channels
- Scheduled automated reporting via PDF or email
- Google Sheets integration for pulling in spreadsheet data
With AgencyAnalytics, data refresh rates can lag by two to three days - not ideal if your clients expect to see up-to-date numbers at any given time.
How do I automate Google Sheets reporting for clients?
Automating Google Sheets reporting for clients doesn't require a developer, a data engineer, or hours of setup.
With Whatagraph, the whole process - from connecting your data to sending branded reports on a schedule - takes less than 30 minutes. Here's how it works, step by step.
1. Prepare and connect your Google Sheets data
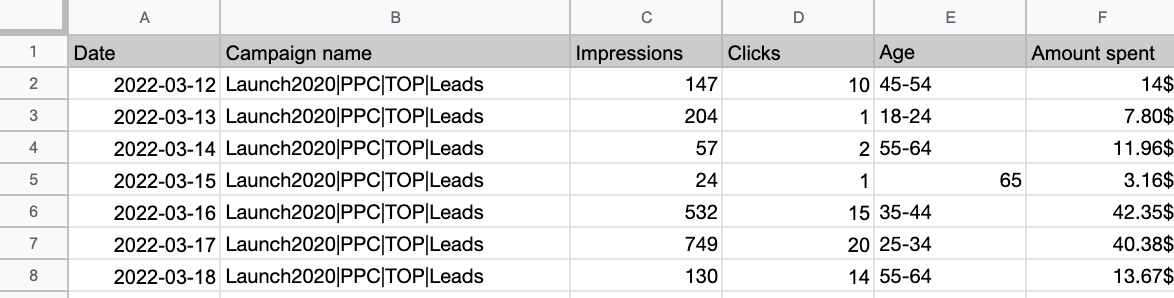
Before connecting, make sure your sheet is formatted correctly so Whatagraph can read it properly:
- Your sheet needs a date column formatted as YYYY-MM-DD - this is how Whatagraph maps data to the right time periods
- At least one column must contain only numeric values - these are recognised as metrics
- For percentage or currency values, use the FORMAT function in Google Sheets to set the number type before connecting
- If you plan to add new columns later, always add them at the end of the sheet - columns are mapped by position, so moving existing ones can break your widget setup
Need a head start? Download a sample Google Sheet template here to see exactly how your data should be structured.
Here’s an example of a successful formatting:
Once your sheet is ready, follow these steps:
1. Go to the Data space in Whatagraph
2. Select Sources and click Connect new source
3. Find the Google Sheets integration.
4. Authenticate, select your sheet, and you're connected. The whole thing takes a few minutes.
You can also combine your Google Sheets data with live sources - Google Ads, Meta, GA4, LinkedIn, and 60+ more - all in the same report. No manual exports, no copy-pasting between tabs.
2. Organize and clean your data
Raw data rarely comes in the shape you need for client reports. Before you build anything, take a few minutes to standardize what you're working with.
On Whatagraph, you can:
- Blend your Google Sheets data with live channel data into a single unified view
- Standardize metric and campaign names across sources so everything reads consistently
- Create custom metrics and dimensions without writing formulas or code
- Tag and organize sources by client, account manager, or region
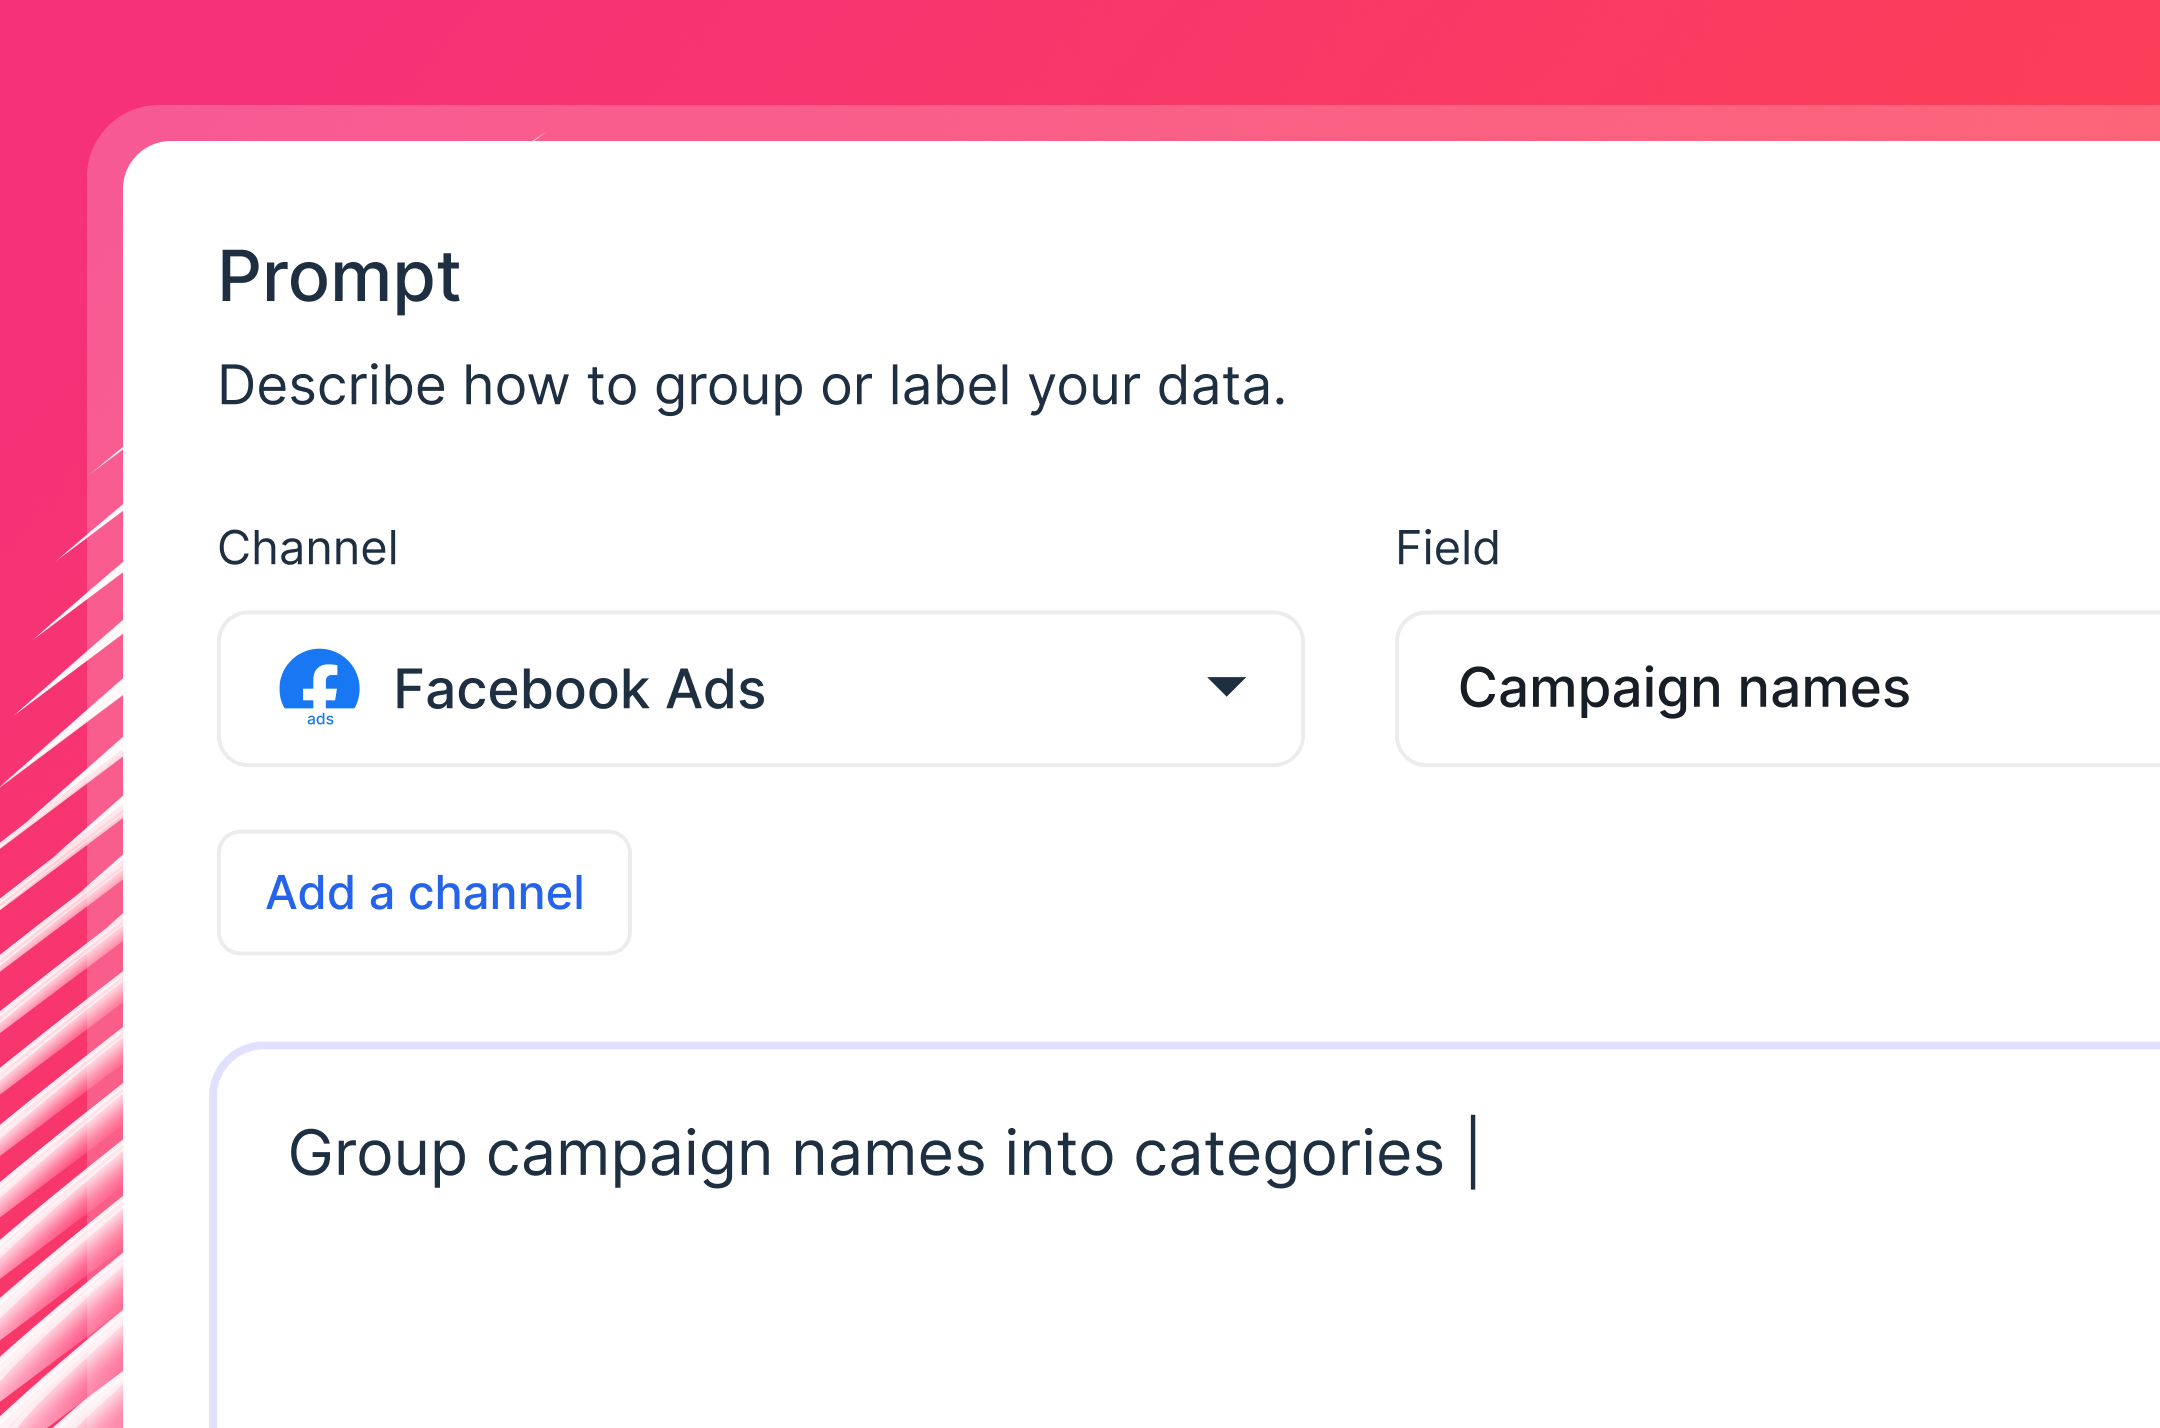
With Whatagraph IQ Dimensions, you can skip the manual work entirely.
Just describe what you need - "combine all spend from Meta, Google Ads, and my Sheets budget tracker into one total" - and IQ builds it for you.
The goal isn't to show everything - it's to show the right things. As Elizabeth Greene, Co-Founder at Junglr, puts it:
A dashboard with too many metrics is often unhelpful or confusing. What we've focused on instead is identifying the few core KPIs that help us quickly spot when something is going wrong in an account - because we want to catch negative trends as early as possible.
3. Build client reports with Whatagraph IQ
This is where Google Sheets automated reporting gets genuinely fast.
Instead of dragging and dropping widgets one by one, just describe the report you need, and Whatagraph IQ builds it for you - tabs, charts, KPIs, and layouts included.
Connect your Google Sheets source alongside any other channels, and IQ pulls the right data into the right places automatically.
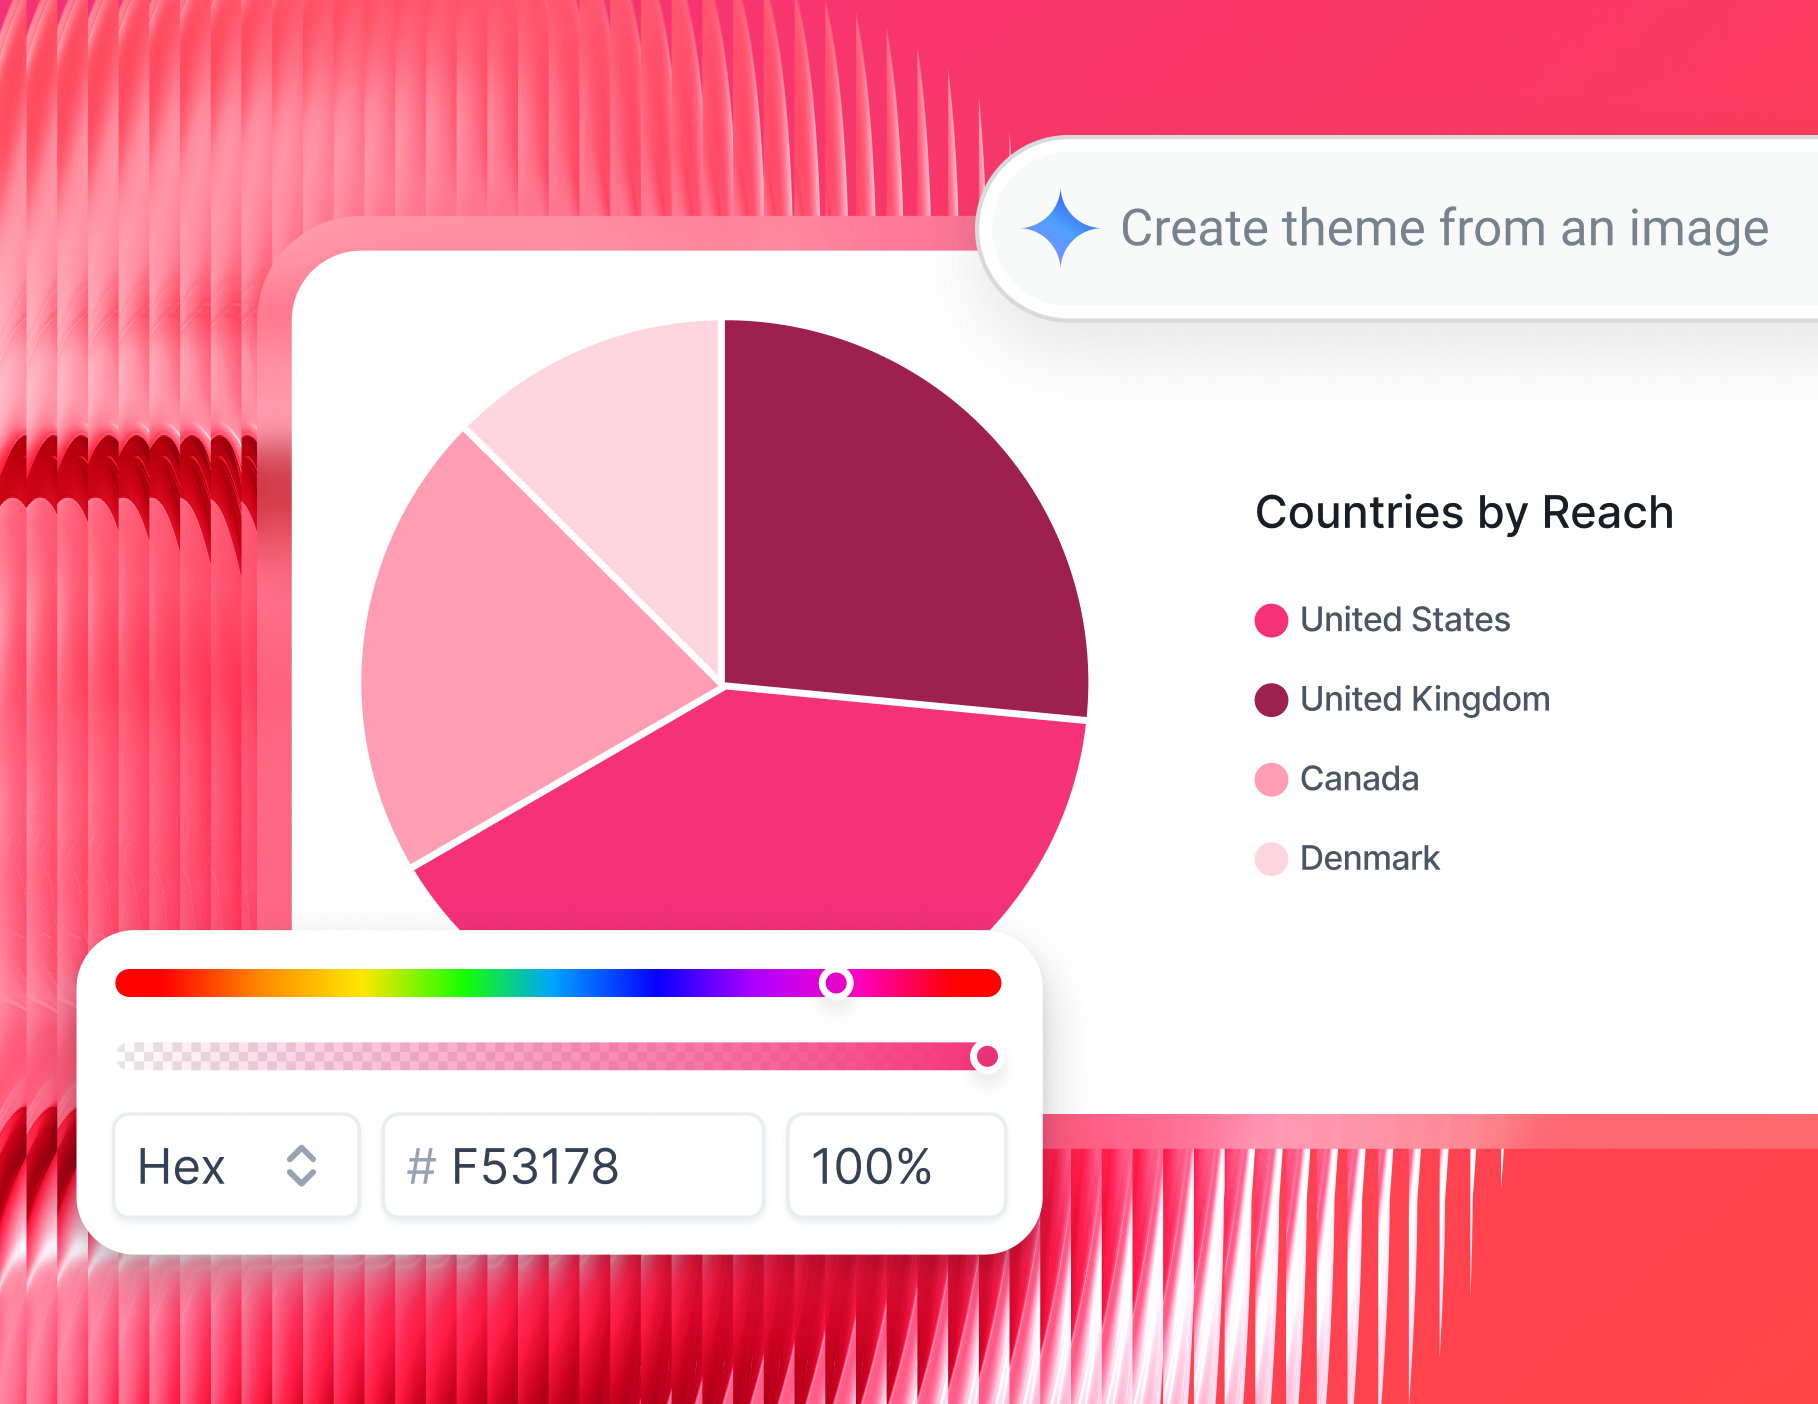
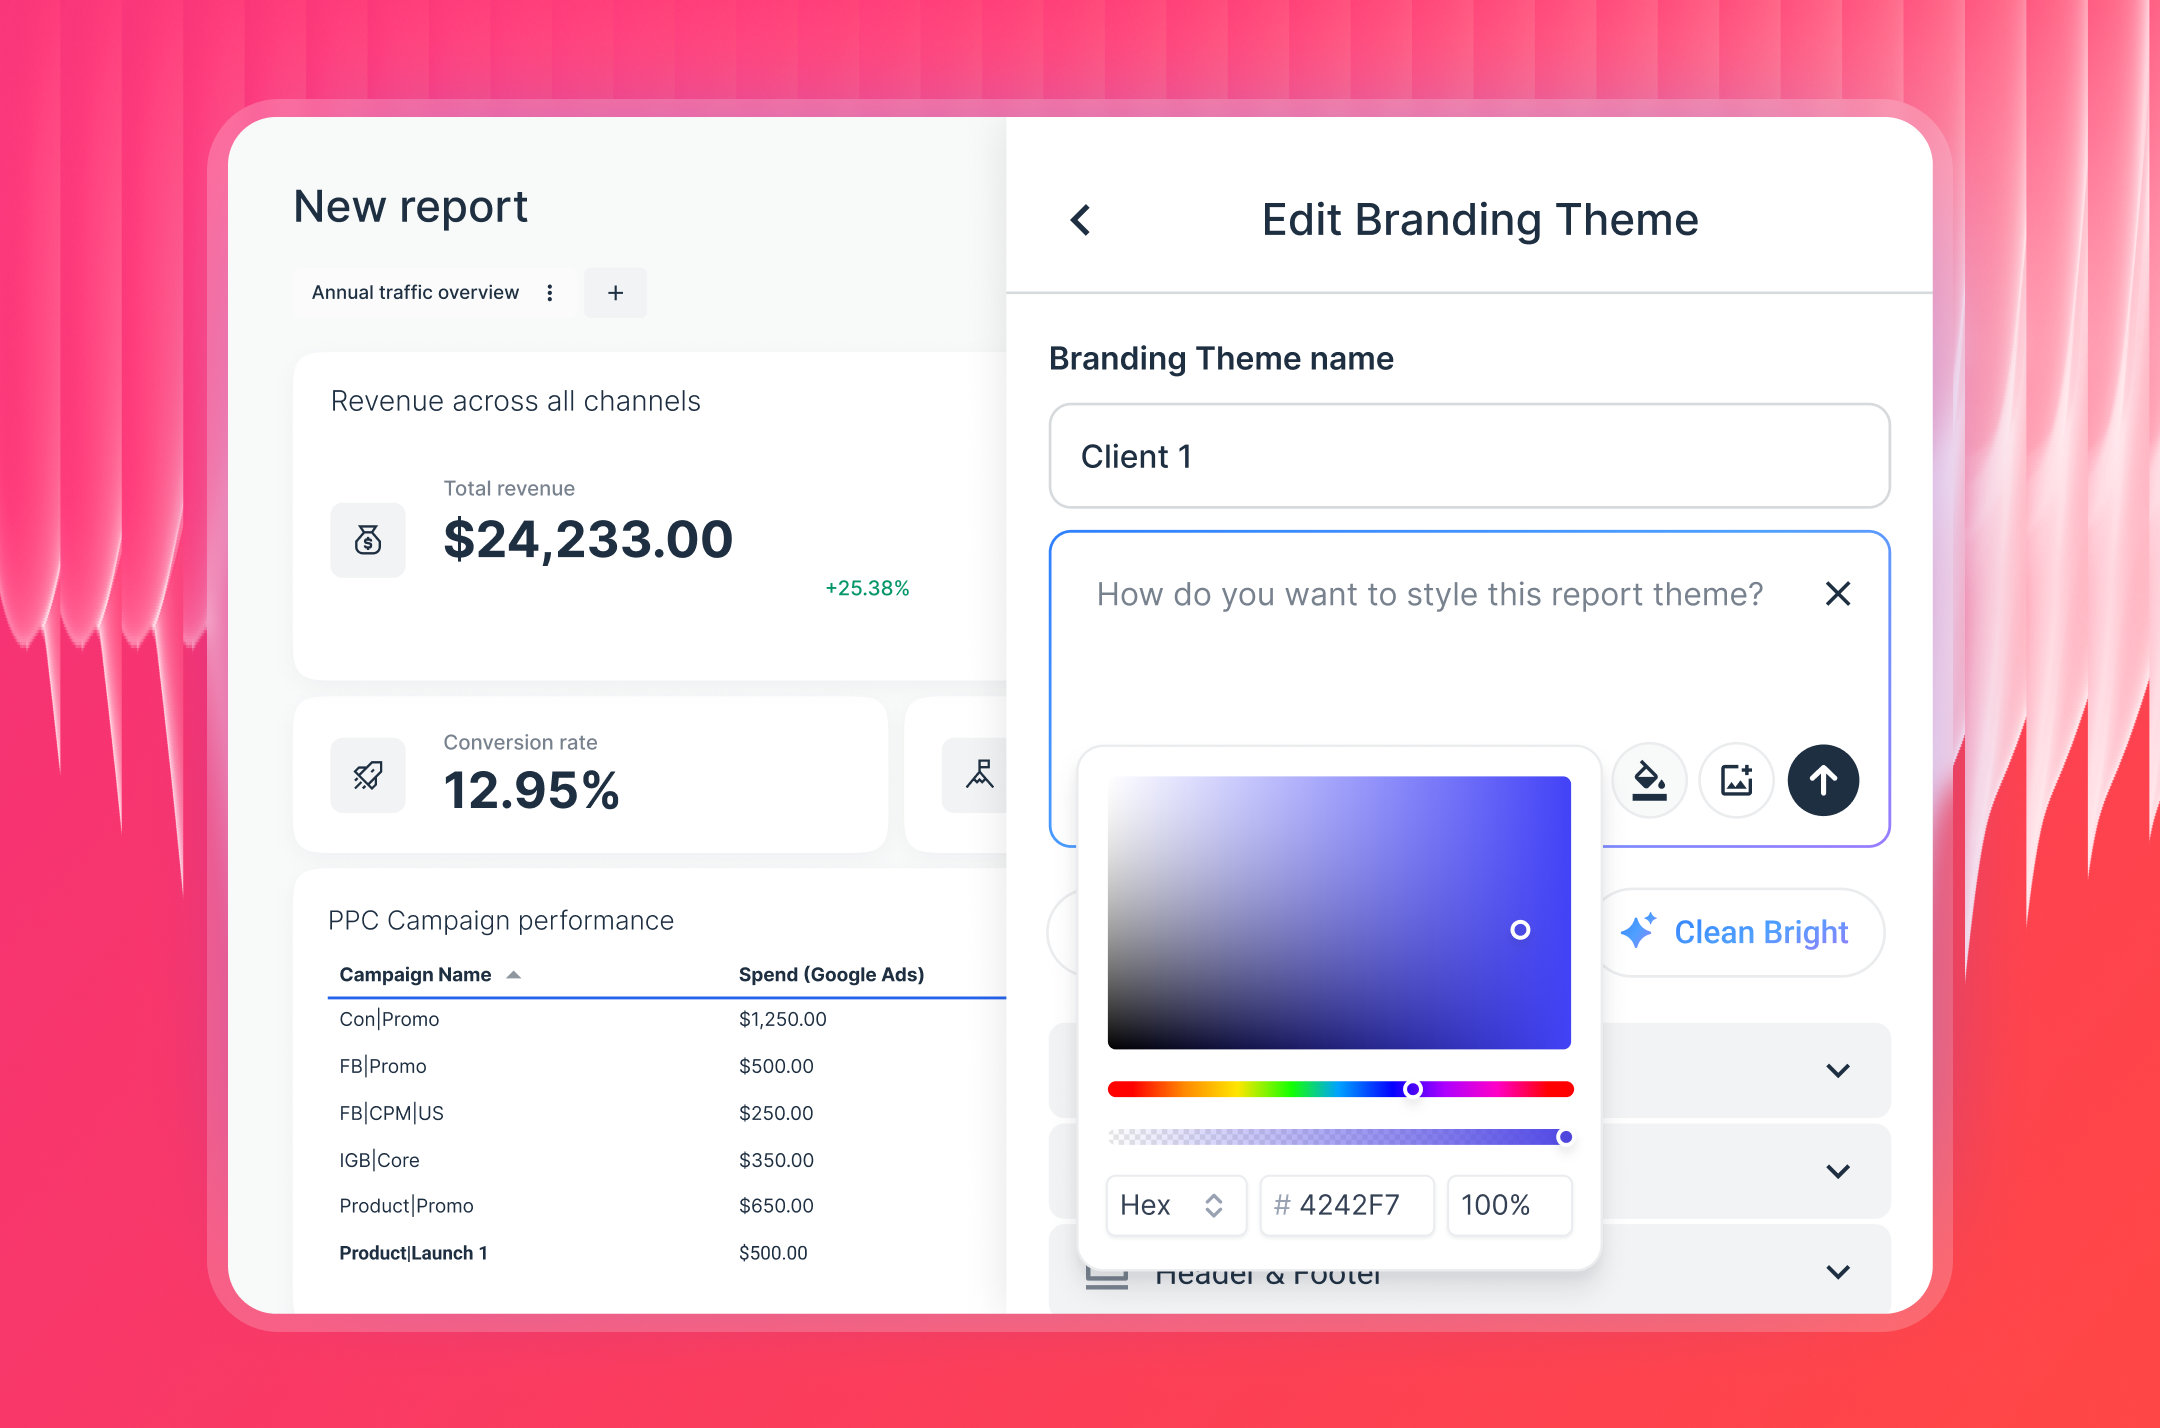
Want your report branded? Upload your client's logo or a screenshot of their brandbook, and IQ applies matching colors, fonts, and styling across the entire report in seconds.
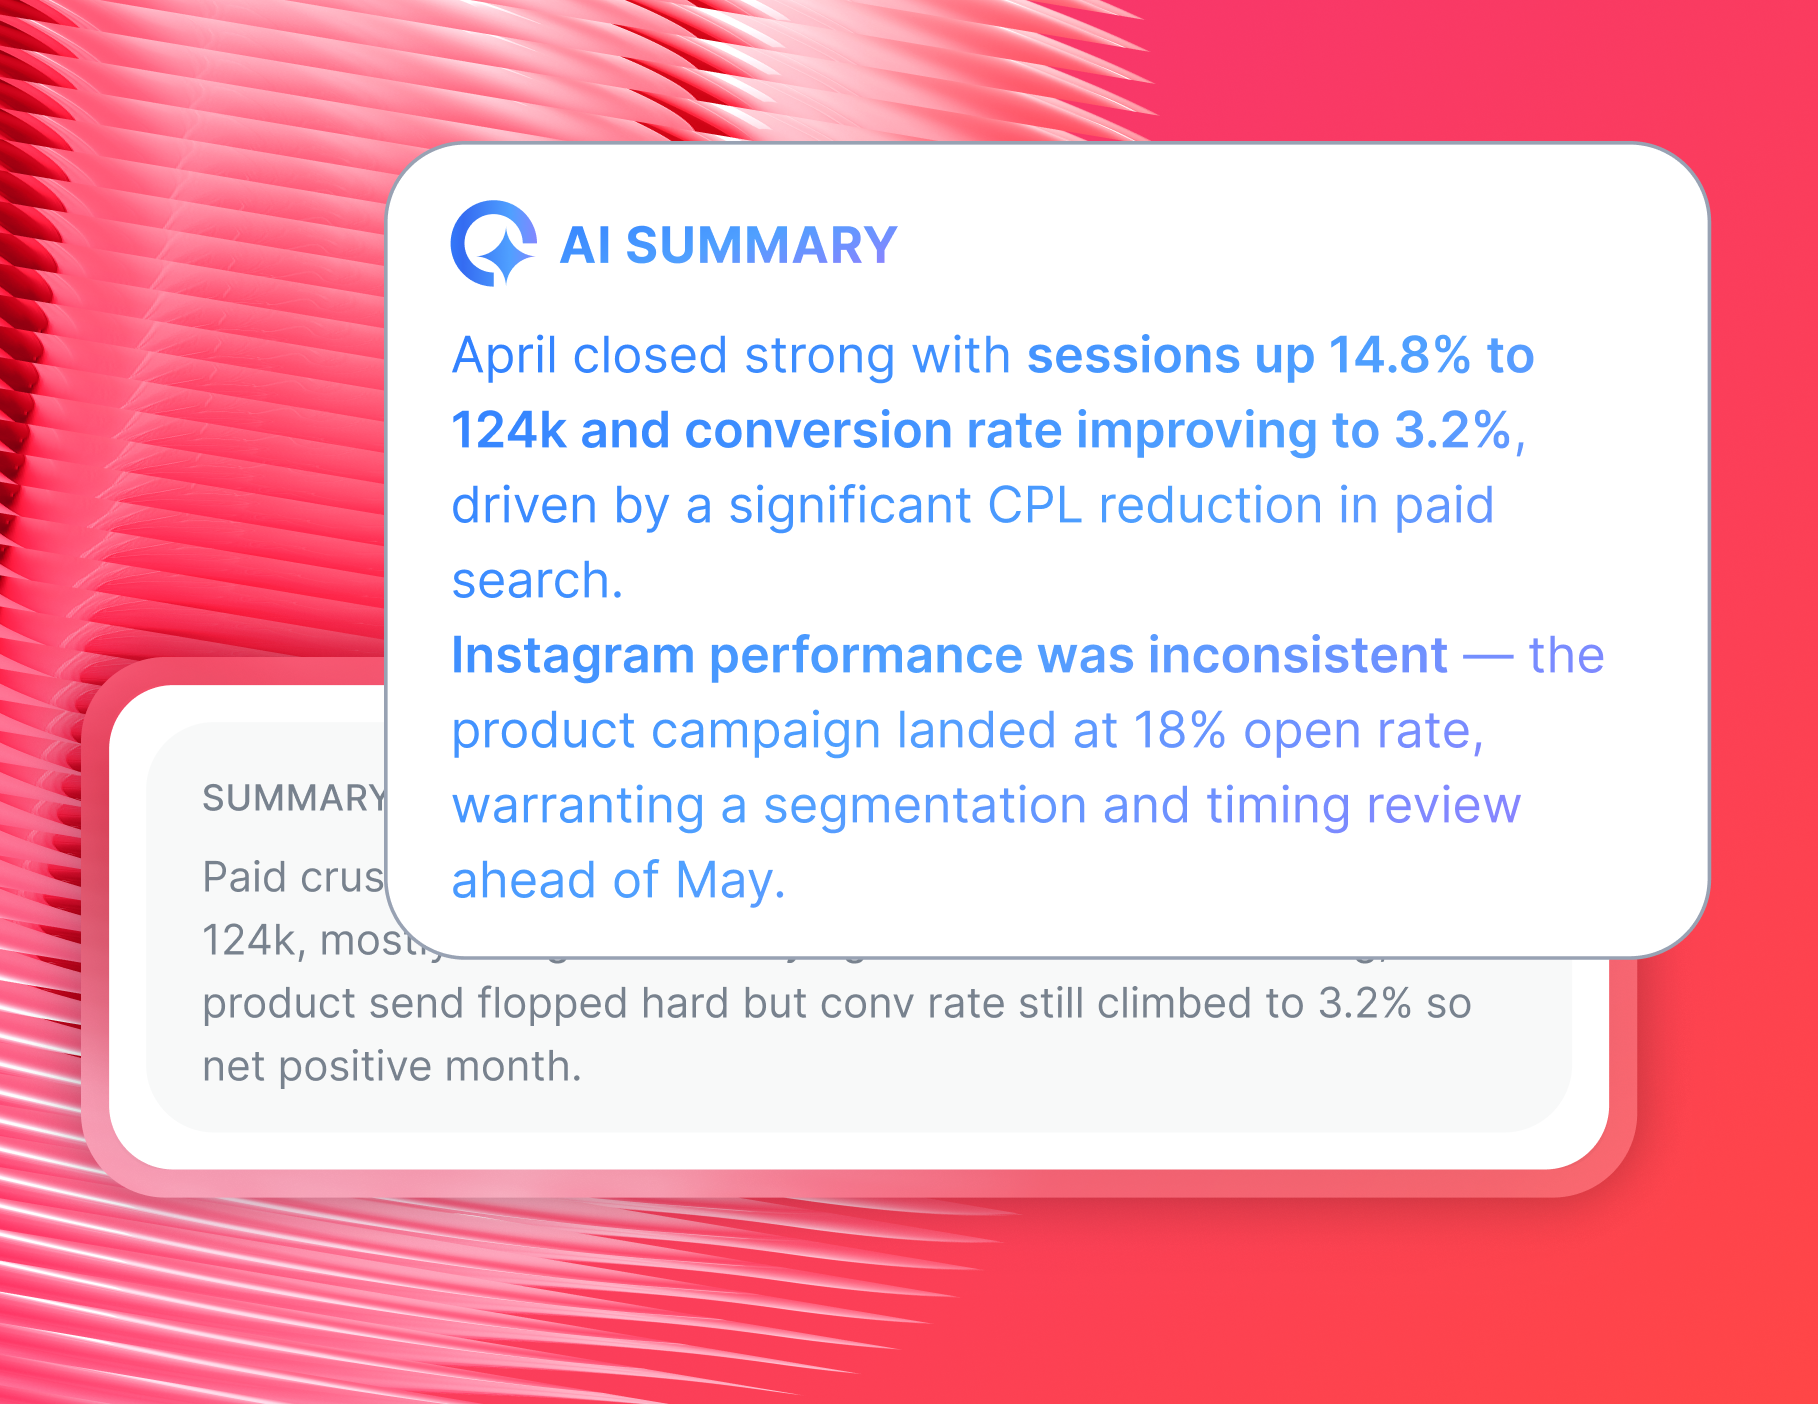
Then add performance commentary without writing a word yourself. IQ Summaries reads the actual data in your report and generates written insights you can edit, adjust the tone of, or send as-is.
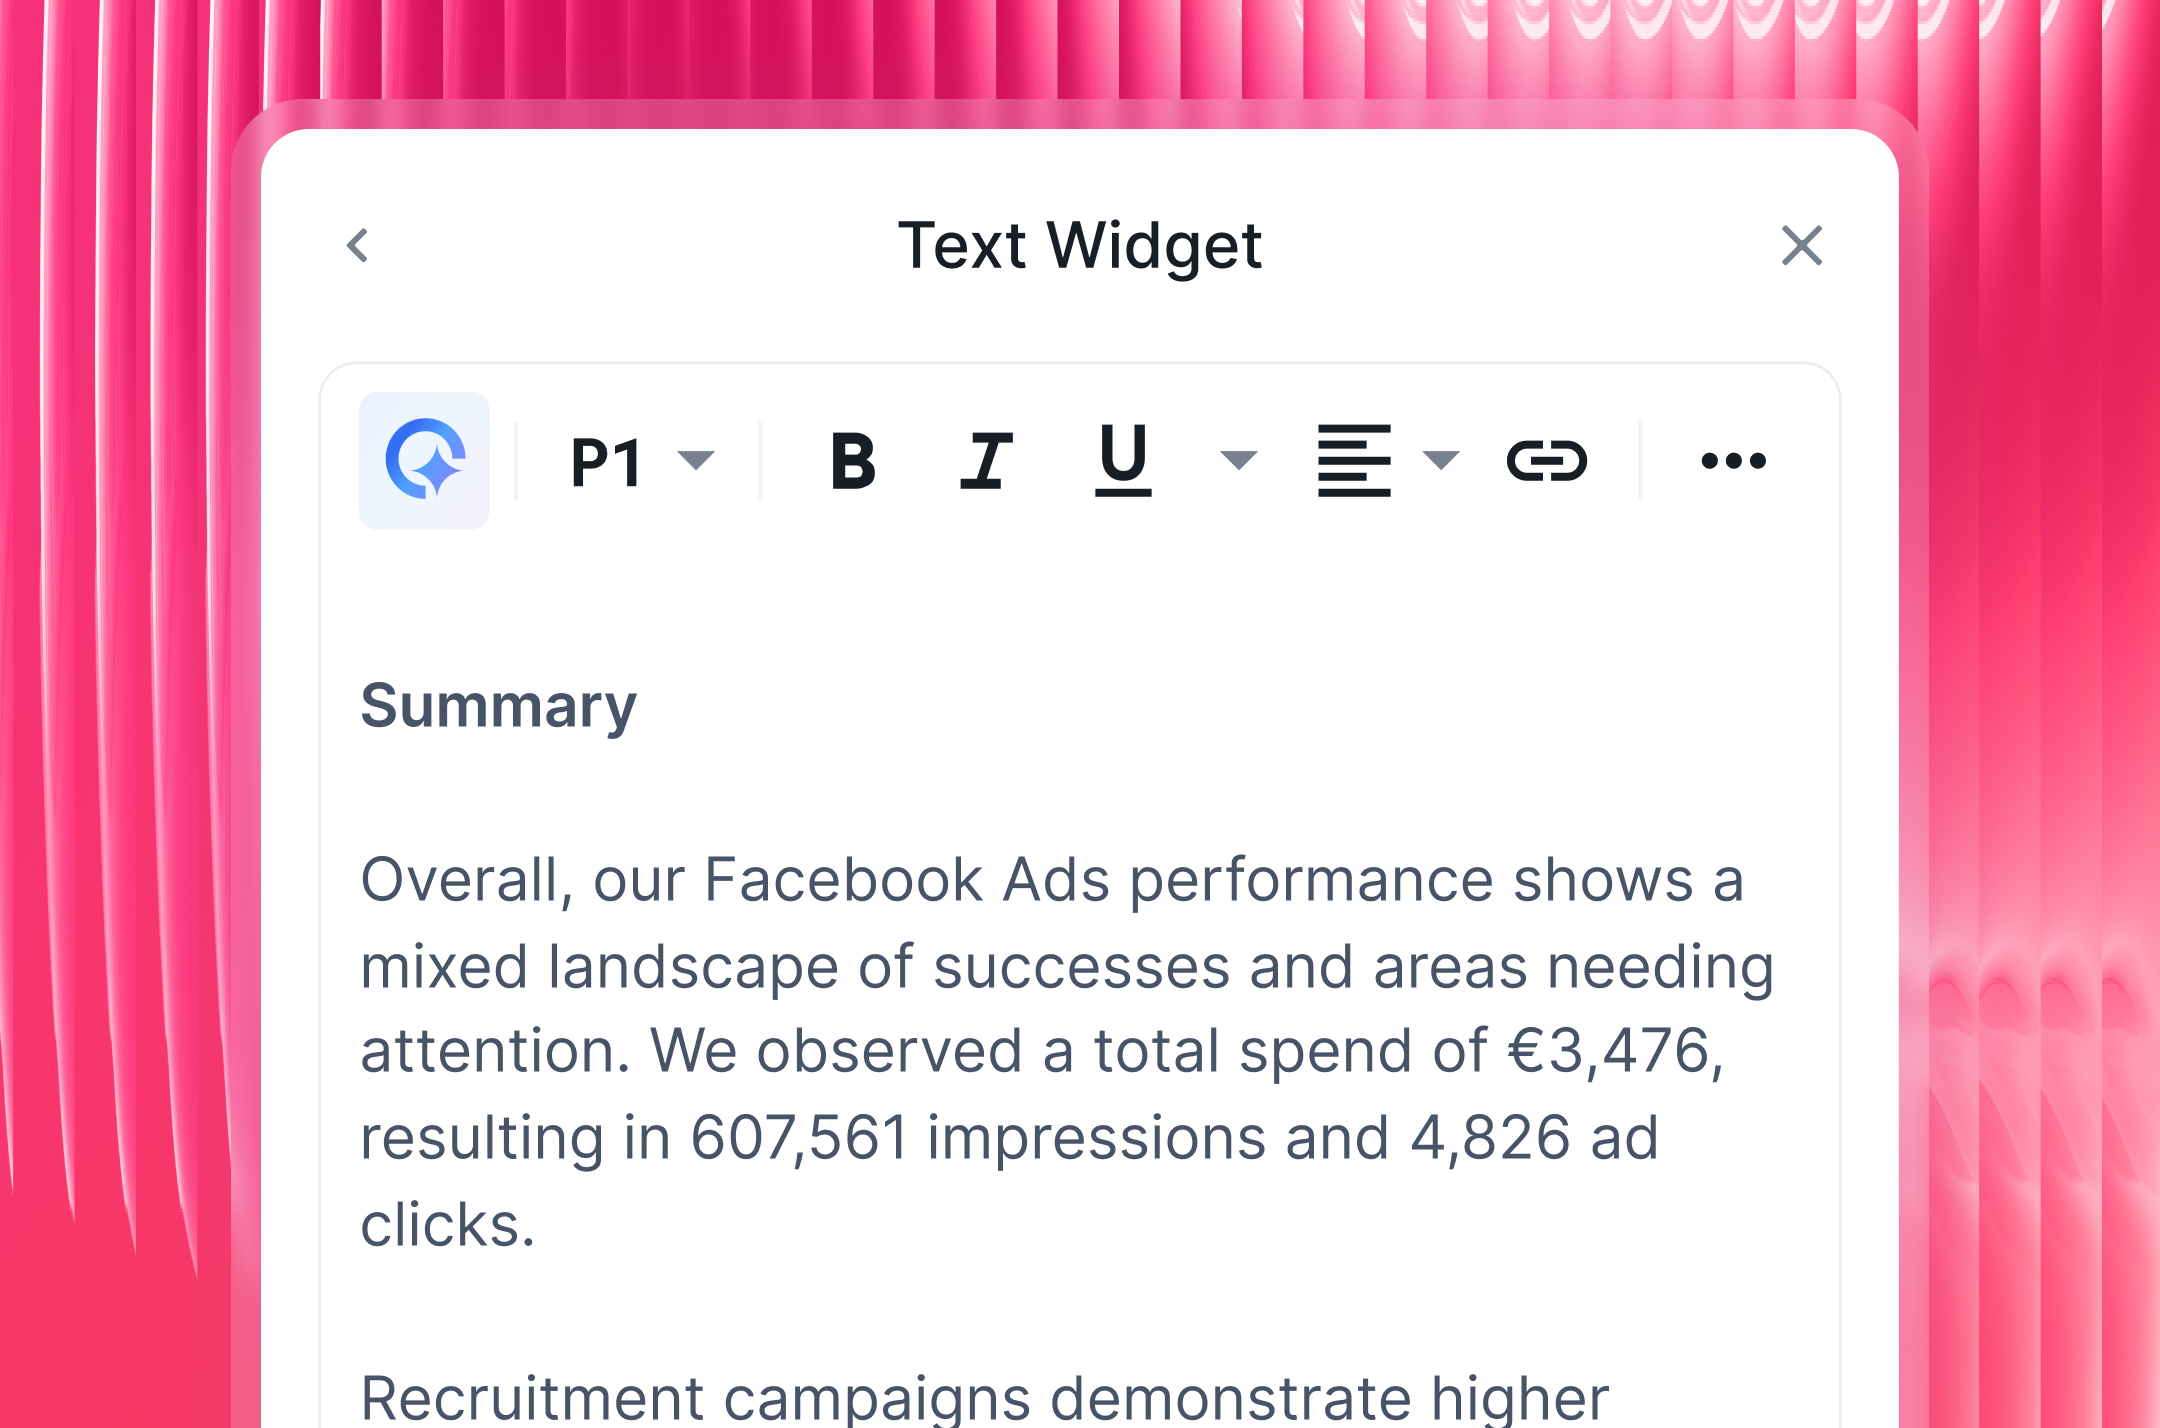
Automation handles the heavy lifting - but the human context is what makes clients actually read the report.
Martin Sandgaard, Co-Founder at AdsToGo, sums it up well:
Reporting with human input is 1000x more valuable than an auto-scheduled report. Context and action plans matter more than the numbers, and most clients don't open or understand reports without that context.
That's exactly why IQ Summaries exist - to give you the speed of automation without losing the human layer that makes reports actually useful to clients.
4. Build internal dashboards to monitor performance
Client-facing reports are one thing. But your team also needs a way to stay on top of performance across all accounts without opening every single report.
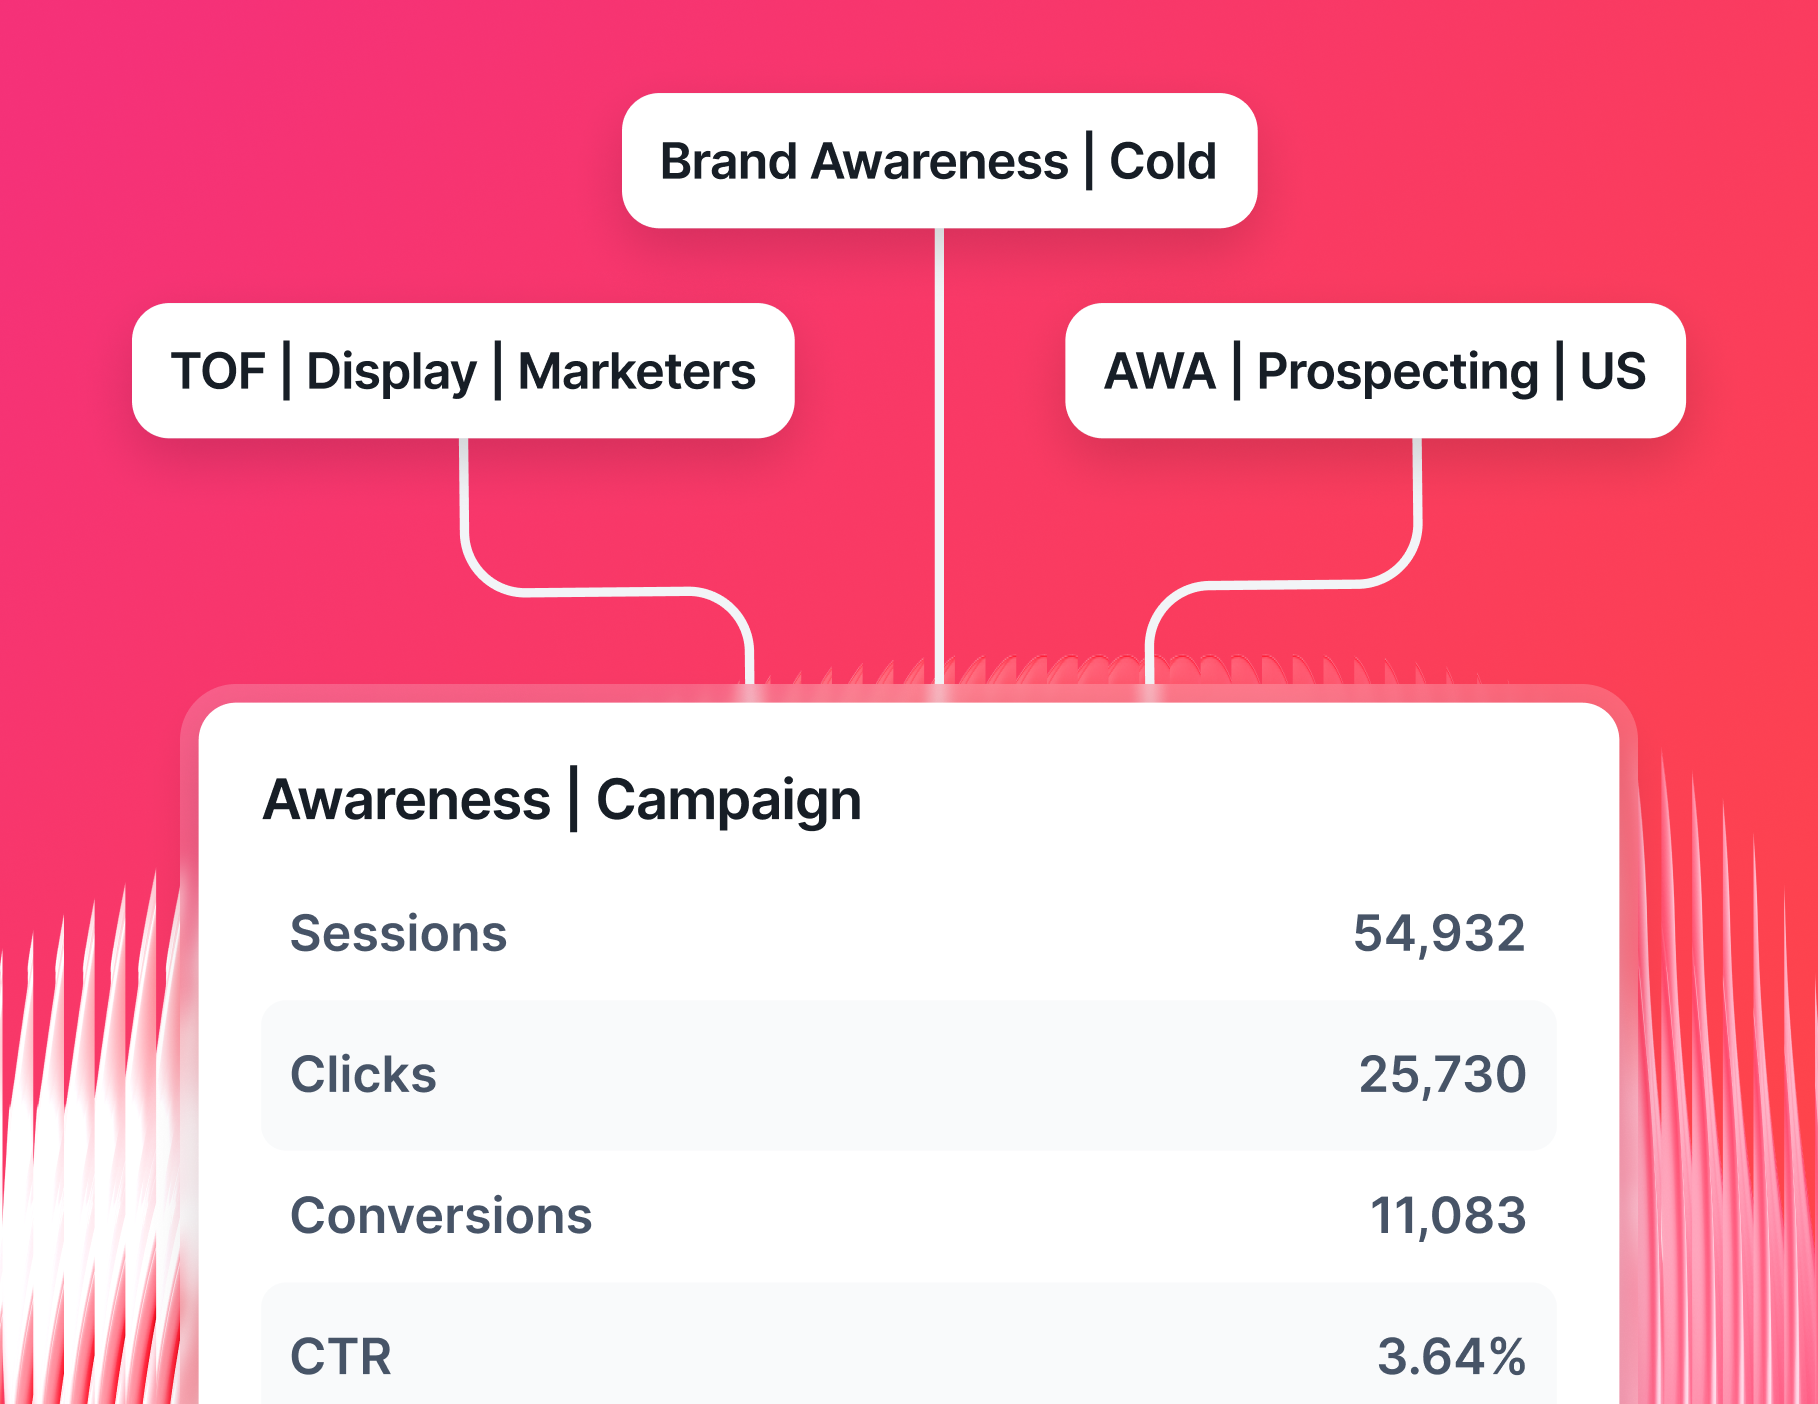
Whatagraph's Overviews give you an internal Google Sheets marketing dashboard view across all your clients and campaigns in one place. Use it to:
- Track KPIs across every client account at a glance
- Flag campaigns that are underperforming or hitting spend caps
- Monitor performance by account manager, region, or channel
- Set goals and get alerts when something goes off track
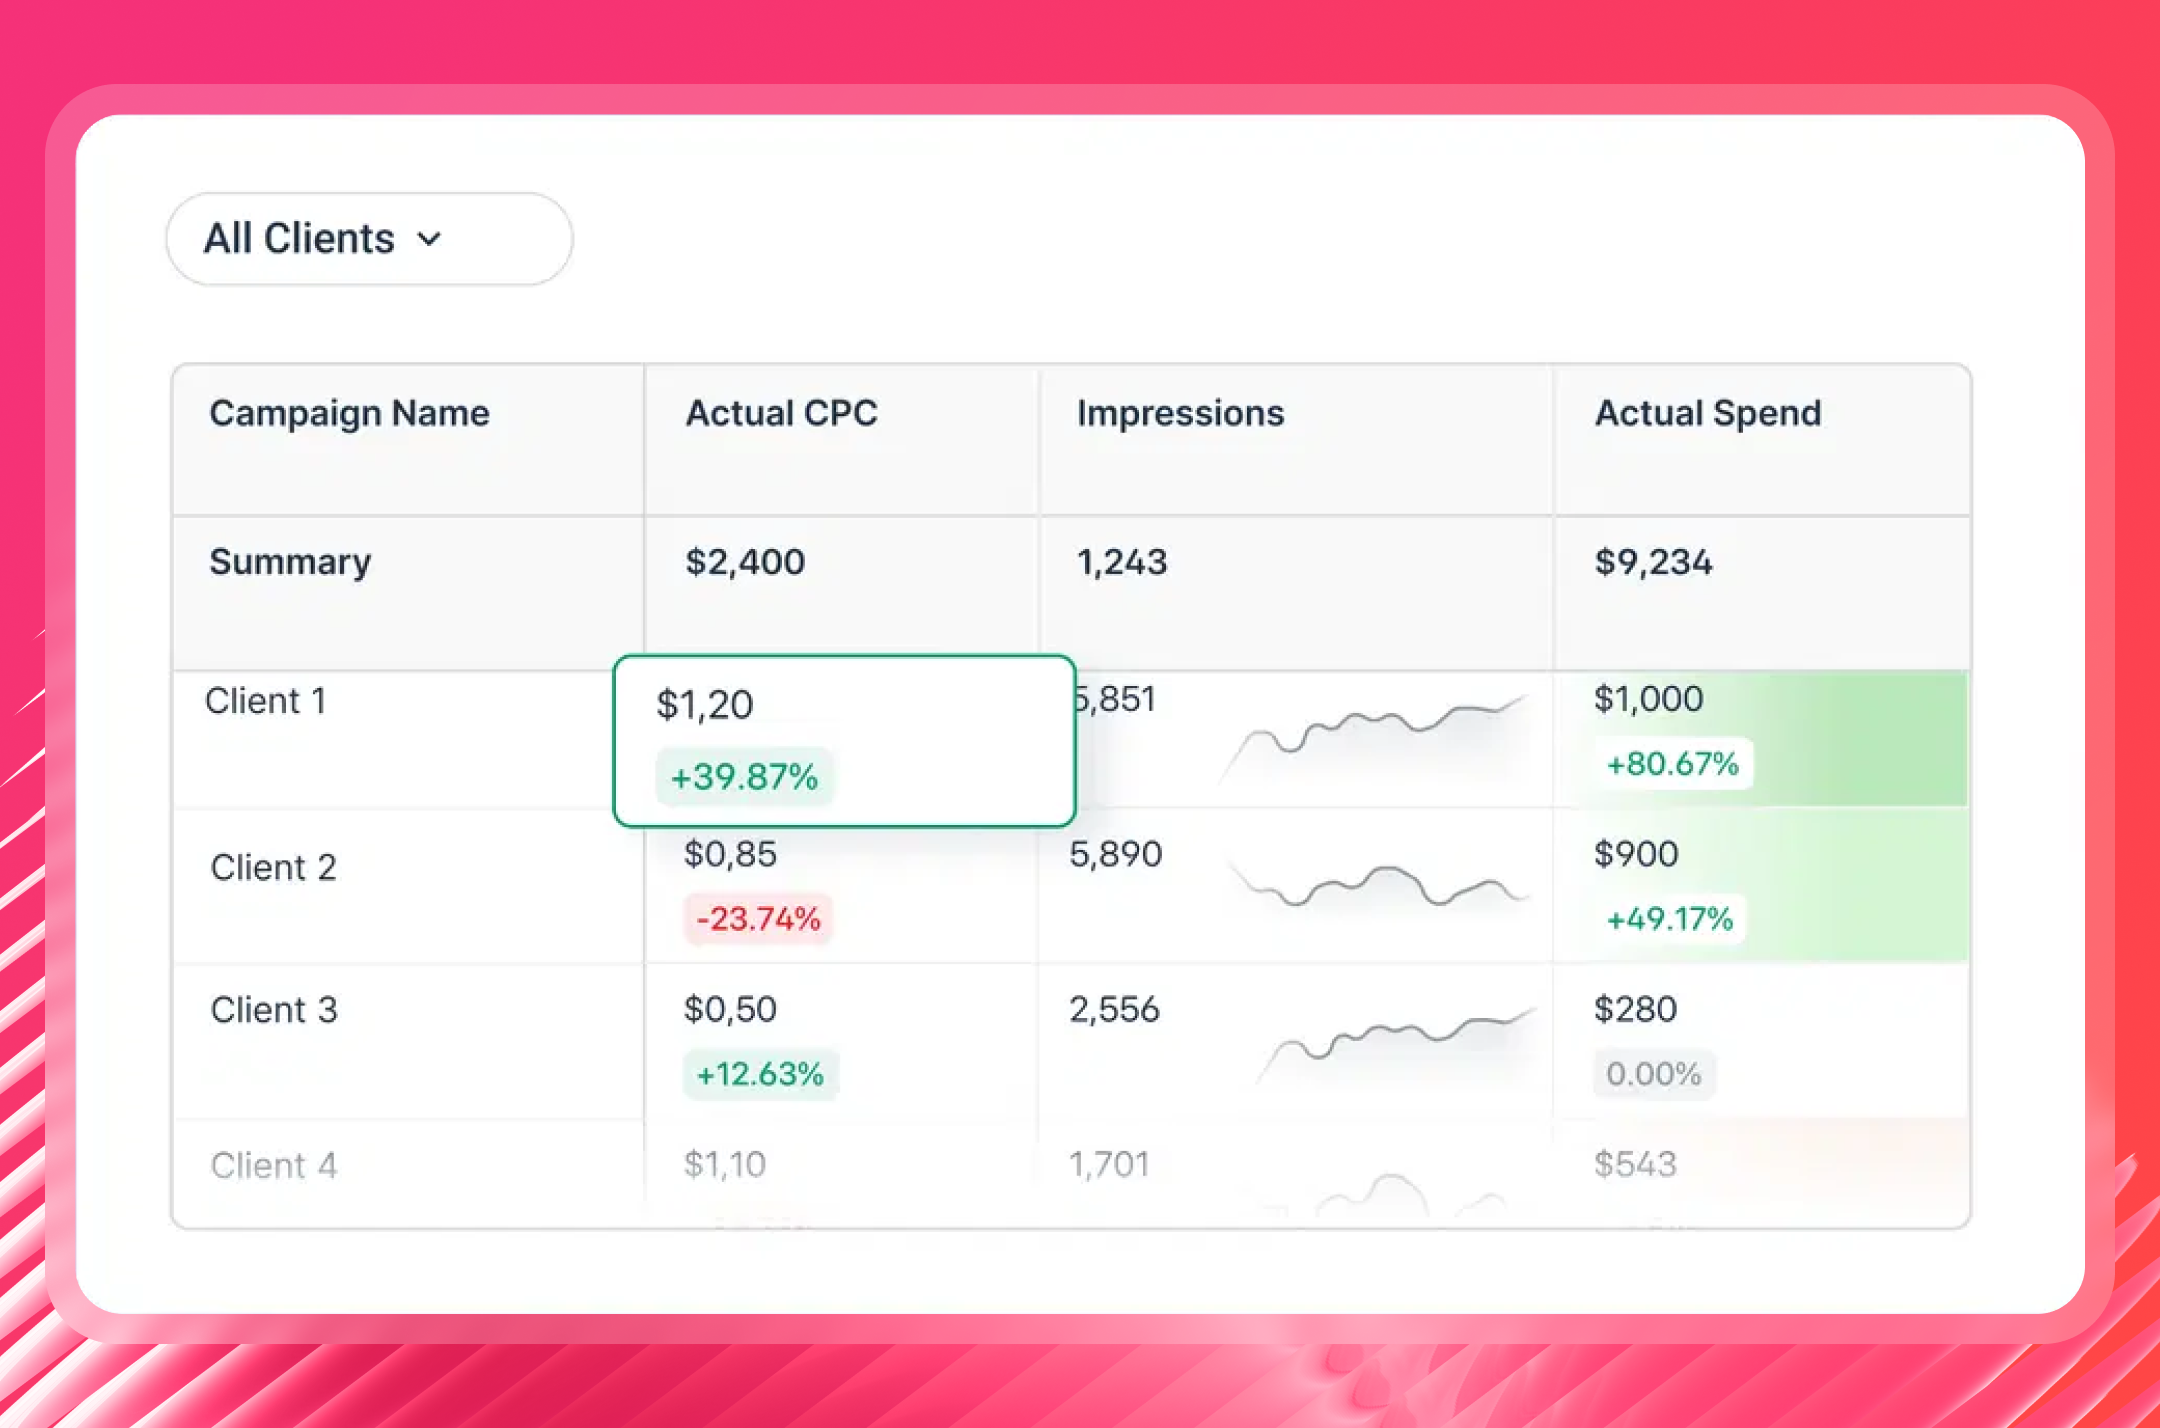
Overviews make sure your team knows what to act on before the client even asks.
5. Share reports automatically
Once your report is built, you don't have to touch it again. Set up automated delivery, and it runs on its own.
Your options for sharing:
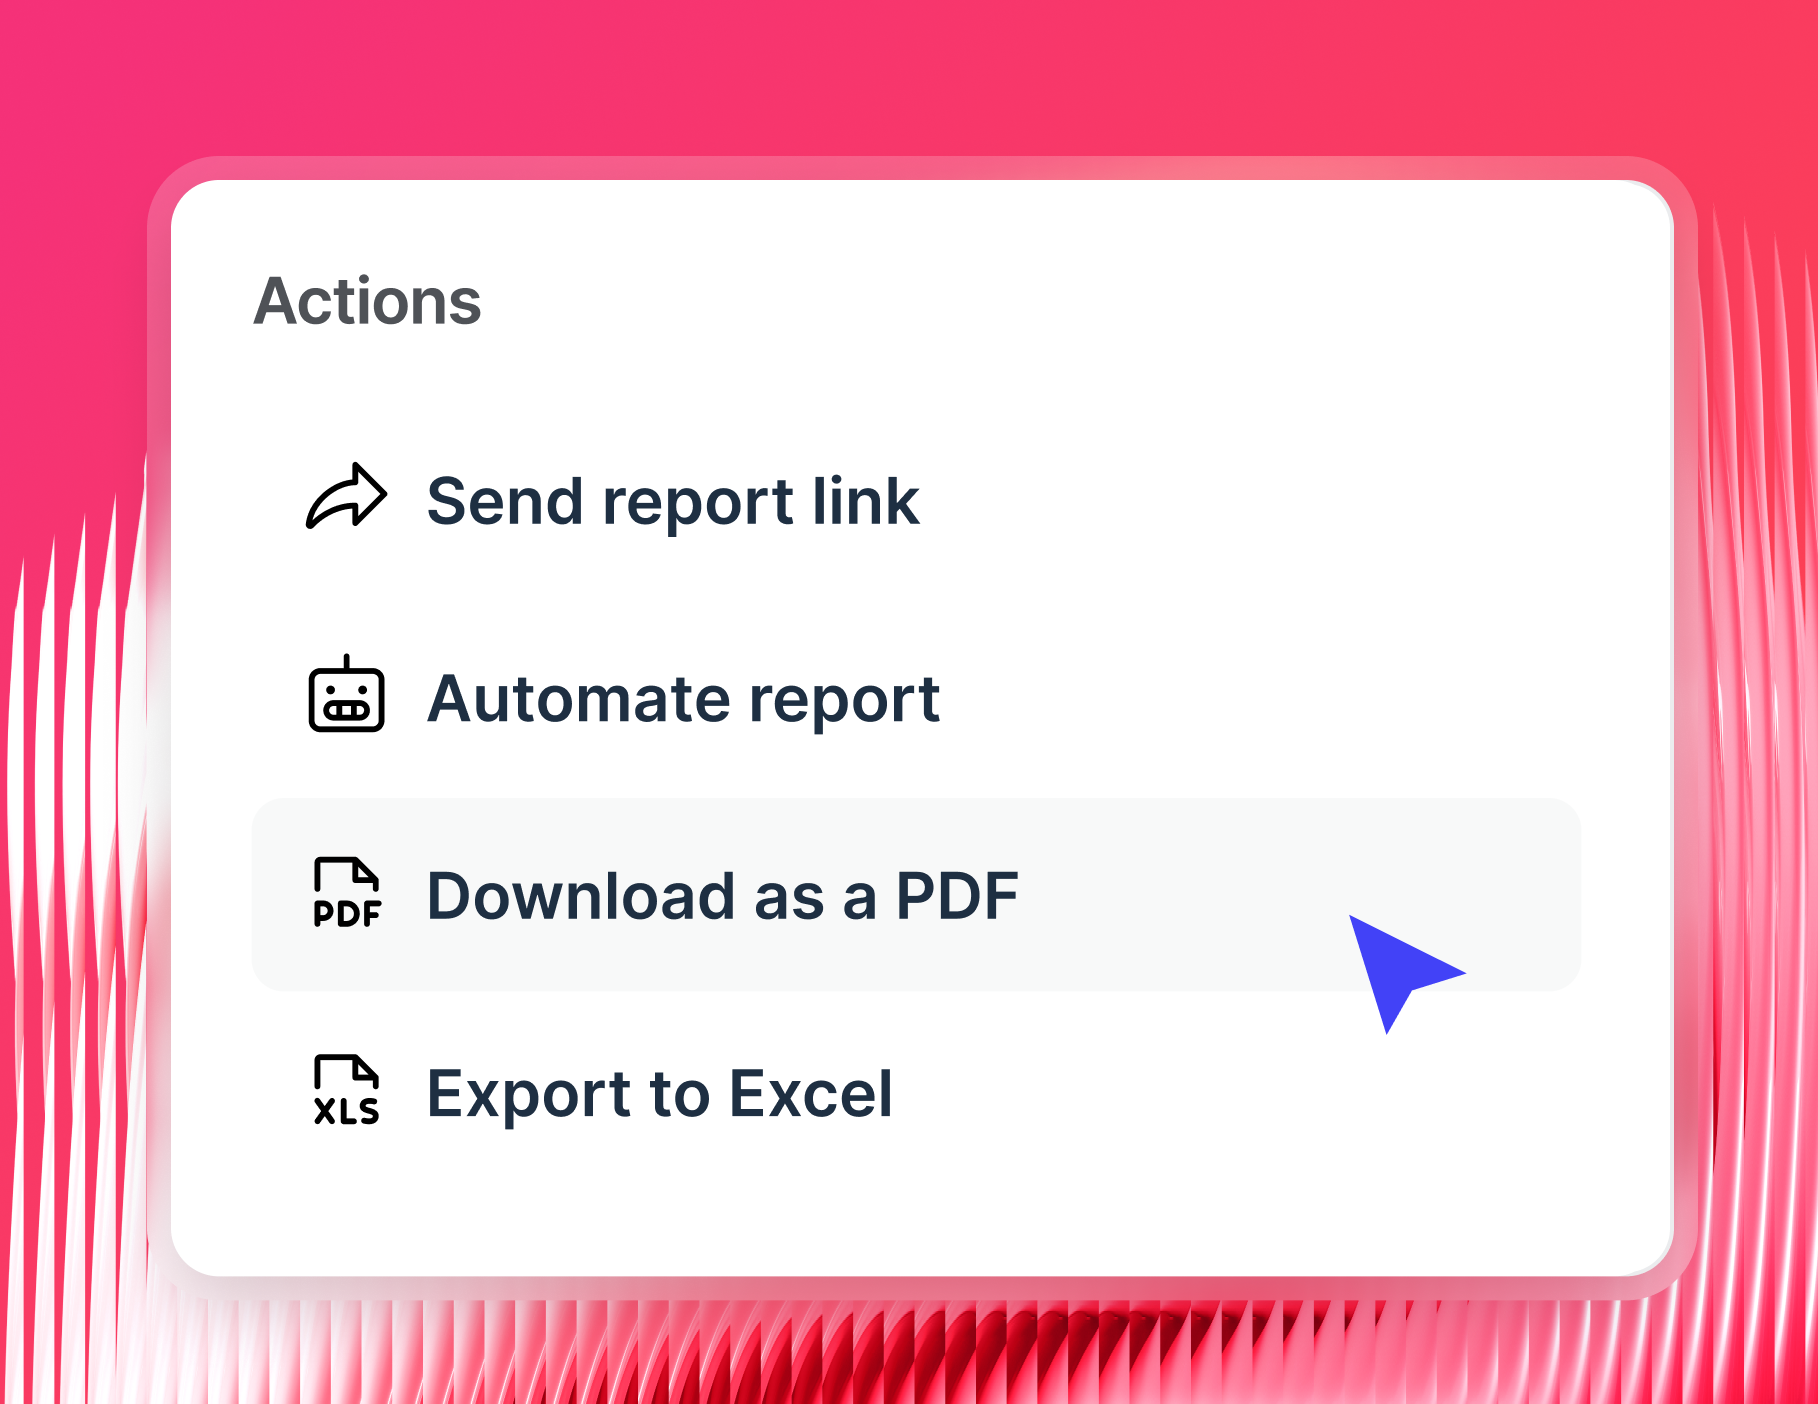
- Scheduled emails - set the exact date, time, and cadence, and reports go out automatically via Slack or email
- Live links - share a link that updates in real time, so clients always see current data without logging in
- PDF or CSV exports - for offline archives or stakeholders who prefer a static file
- BigQuery or Looker Studio - push your data onward for deeper analysis or custom visualizations
You can also enable IQ Chat on shared reports, so clients can ask plain-language questions about the data and get instant answers - without having to contact your team.
What are some Google Sheets reporting templates I can use right away?
If you're connecting Google Sheets data to Whatagraph, these four templates give you a ready-made starting point. Each one is pre-built with the right metrics and layout for its use case - just connect your data sources, and you're set.
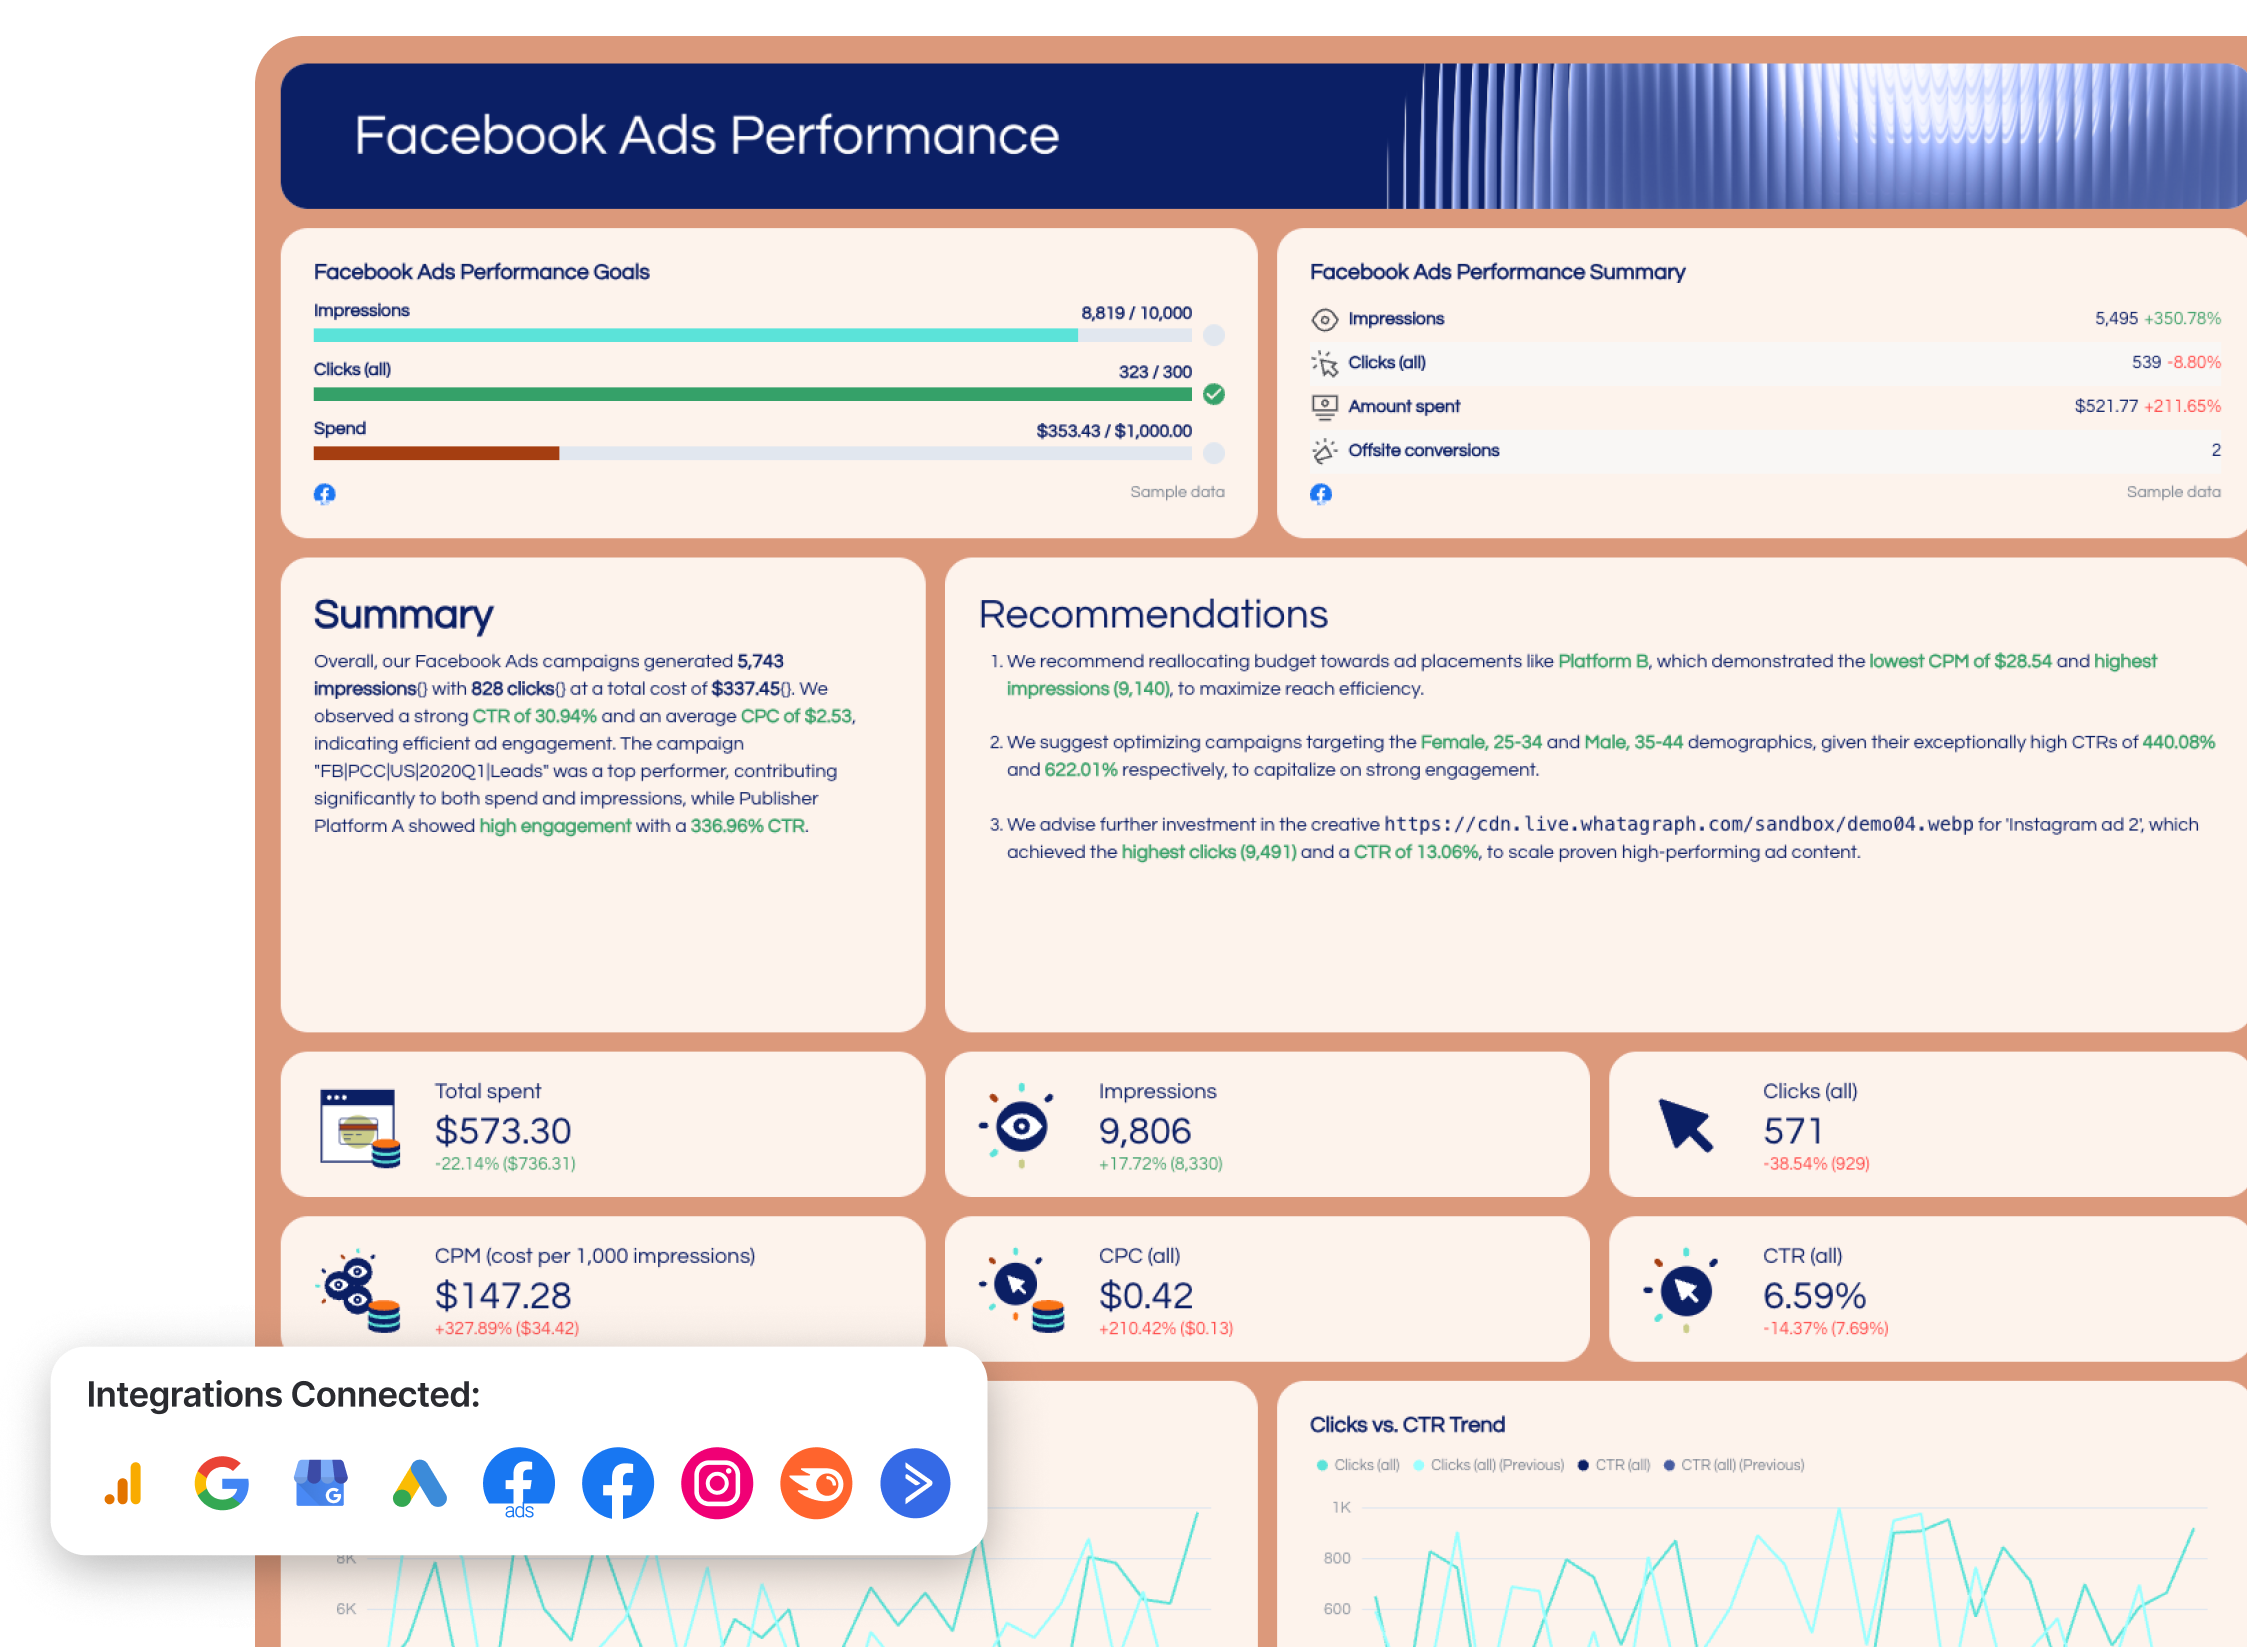
1. Facebook Ads report template Google Sheets
The Facebook Ads report template is built for performance marketers who need to show the full picture of their Facebook campaigns - from top-level results down to individual ad performance.
What's inside:
Performance summary
- Total spend, reach, impressions, and link clicks at a glance
- Summary and recommendations to show the next steps
- ROAS and conversions to show whether the budget is working
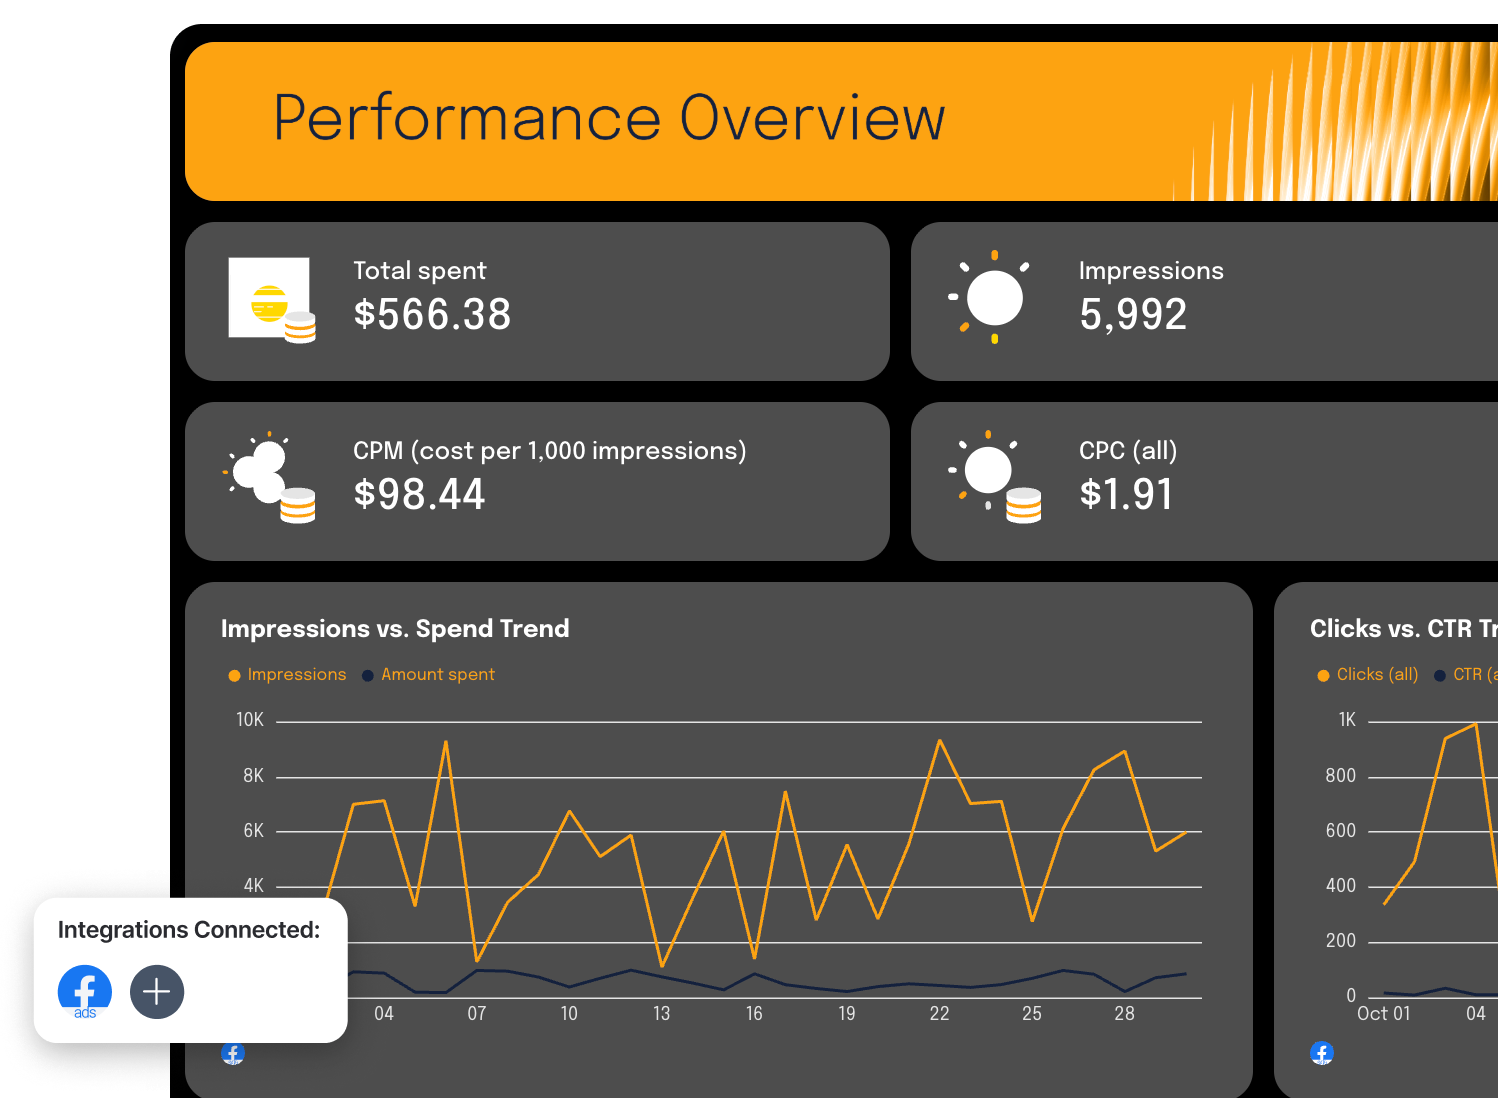
Performance overview
- CPM, CPC, and CTR as top-line performance indicators
- Impressions vs. spend trend and clicks vs. CTR trend over time, so you can spot patterns and flag drops early
Campaign and ad performance
- Ad placement performance breakdown by impressions, CPM, CTR, CPC, and page engagement
- Campaign-level table: spend, impressions, CPM, clicks, CPC, CTR, and page engagement by campaign name
- Ad-level view with the same metrics broken down by individual ad, plus a visual ad performance preview showing each creative alongside its results
Audience engagement
- Demographics table breaking down spend, impressions, CPM, clicks, CPC, CTR, and page engagement by age and gender
- Ad delivery impressions by age and by gender shown as pie charts
- Conversion funnel showing reach, clicks, and sales to visualize where people drop off
2. Social media report template Google Sheets

A cross-platform social media report template covering Instagram, Facebook, and YouTube in one report - ideal for agencies managing multi-channel social presence for clients.
What's inside:
Overview
- Follower counts across Instagram, Facebook, and YouTube at a glance
- AI-written summary and recommendations so clients see the story before the numbers
Instagram performance
- Reach, impressions, followers, engagement rate, and saves
- Audience demographics by geography and gender distribution
- Reel performance, story performance, and top-performing posts by reach and shares
- Follower trend over time and content engagement breakdown
Facebook performance
- Reach, impressions, page followers, and post engagements
- Post engagement trend and reach vs. follower growth over time
- Top-performing posts table and engagement breakdown by type
YouTube performance
- Views, watch time, average view duration, and subscriber counts
- Cumulative subscriber trend and video performance table
- Likes, comments, and shares per video
3. Google Sheets SEO report template
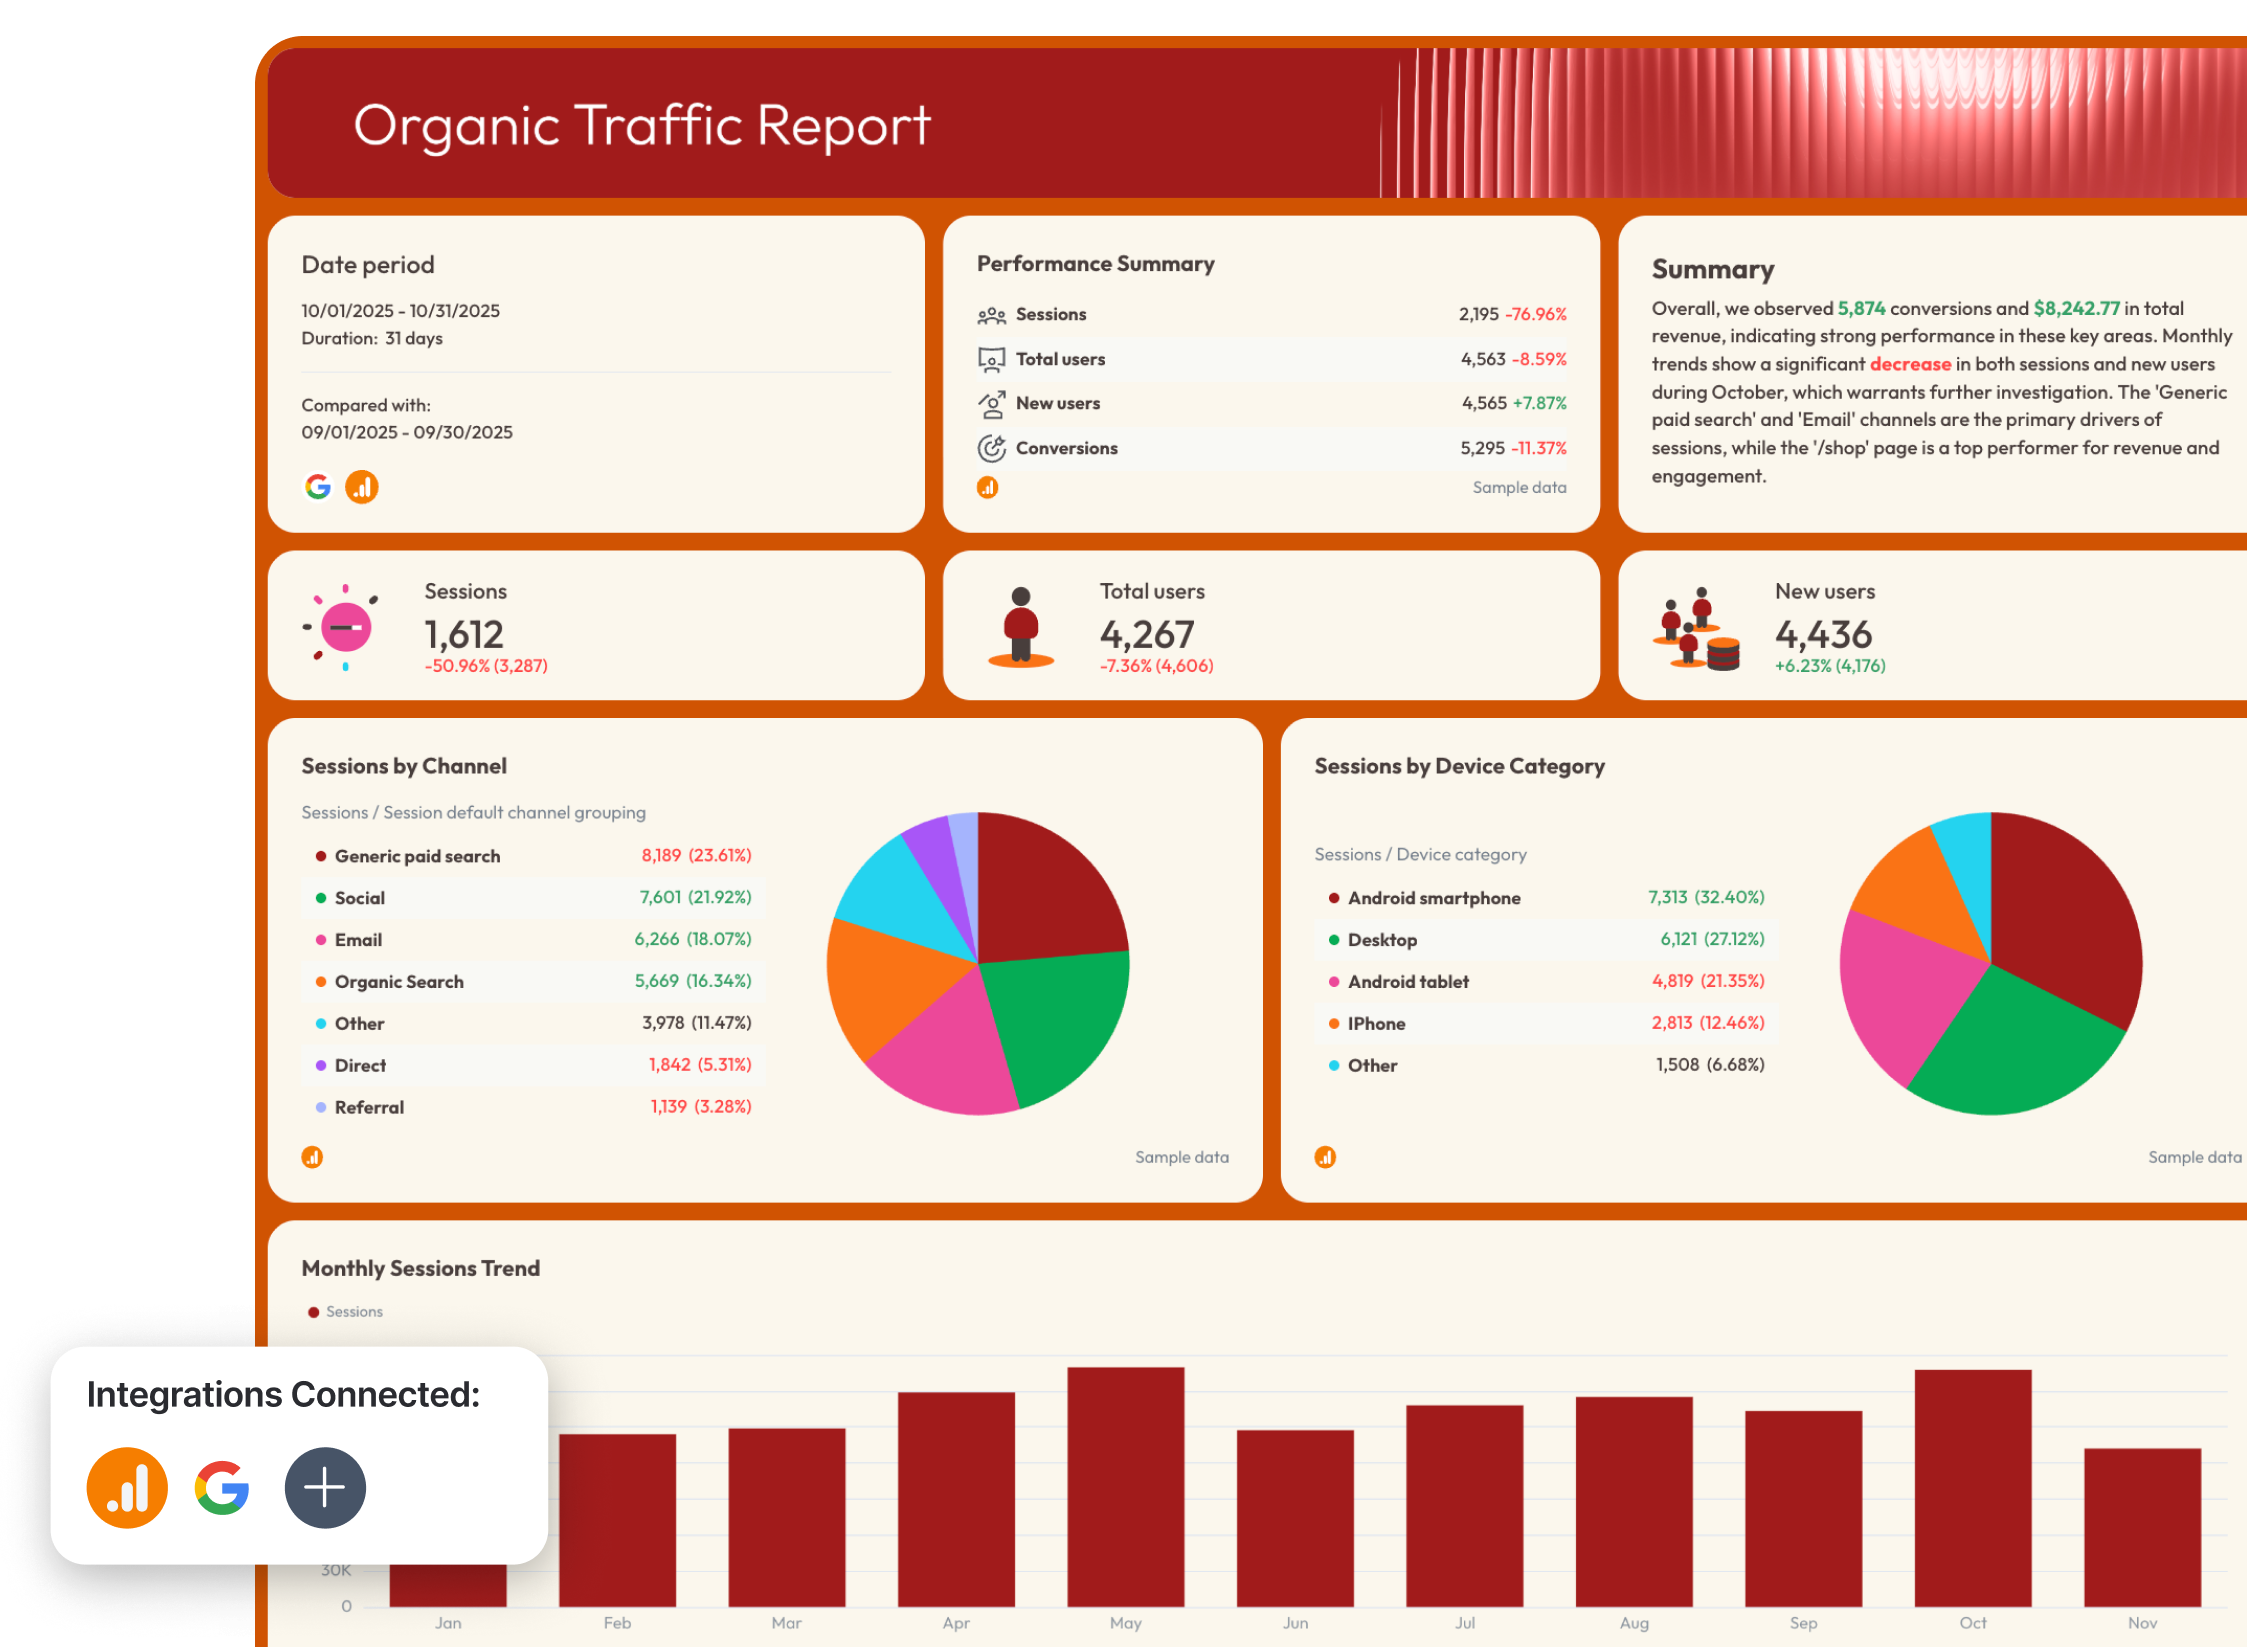
Google Sheets SEO report template involves a comprehensive SEO report across three tabs - Summary, Organic Traffic, and Organic Conversions - pulling from Google Search Console and GA4.
What's inside:
Performance summary
- AI-written summary with key highlights and recommendations at the top
- SEO KPIs progress tracker showing where you stand against goals for impressions, clicks, sessions, and conversions
Traffic and visibility metrics
- Total users, new users, and keywords ranking in positions 1-10
- Average organic search position to track visibility over time
Conversion metrics
- Total conversions, conversion rate, and total revenue
- Ecommerce purchases, average purchase revenue, and transactions for a clear bottom-line view
4. KPI report Google Sheets template
A multi-client, multi-channel KPI report template is built for agencies that need to show the full marketing picture in one place - from high-level summary down to granular ad spend by platform.
What's inside:
Marketing summary
- Top-line KPIs: sessions, conversions, and cost at a glance
- AI-written performance summary and recommendations
- Conversion trend over time and channel breakdown by sessions, conversions, cost, and conversion rate
Ad spend analysis
- Spend by platform (Google Ads, Meta, and more) broken down by campaign, with bar charts for easy visual comparison
- Separate spend charts per channel, showing spend trends over time
- Cost per conversion by campaign across all major channels