


What is a Magento reporting tool?
Magento reporting tools pull your store's e-commerce data - orders, revenue, product performance, customer behavior - and turn it into clear, actionable reports you can actually use.
Without one, Magento reporting means logging into your admin panel, exporting data manually, and piecing it together with your ad platform and analytics data in an Excel spreadsheet. Every month. For every client.
While active Magento store numbers have declined, Magento still powers around 8% of all e-commerce platforms. The stores running on it have real reporting needs - and Magento's built-in admin panel wasn't built to meet them.
The time savings of using a strong Magento reporting tool can be significant. Swash Labs, a creative advertising agency, was spending 40 hours a month pulling data from multiple sources into spreadsheets, with each report taking 2-3 hours just to make it presentable. After switching to Whatagraph, that dropped to 4 hours a month total - saving 36 hours they could put back into marketing strategy and client work.
A good Magento reporting tool does the heavy lifting:
- Connects directly to your Magento store with user-friendly dashboards and no plugins or developer setup
- Blends store data with your paid channels, analytics, and email tools in one report
- Visualizes revenue, orders, and product performance in a way clients can read at a glance
- Let's you brand and automate reports so they go out to clients on schedule
With Whatagraph IQ, you go a step further. Rather than building each Magento analytics report from scratch, you can:
- Type what you need and let AI generate the full report - tabs, charts, and all relevant metrics included
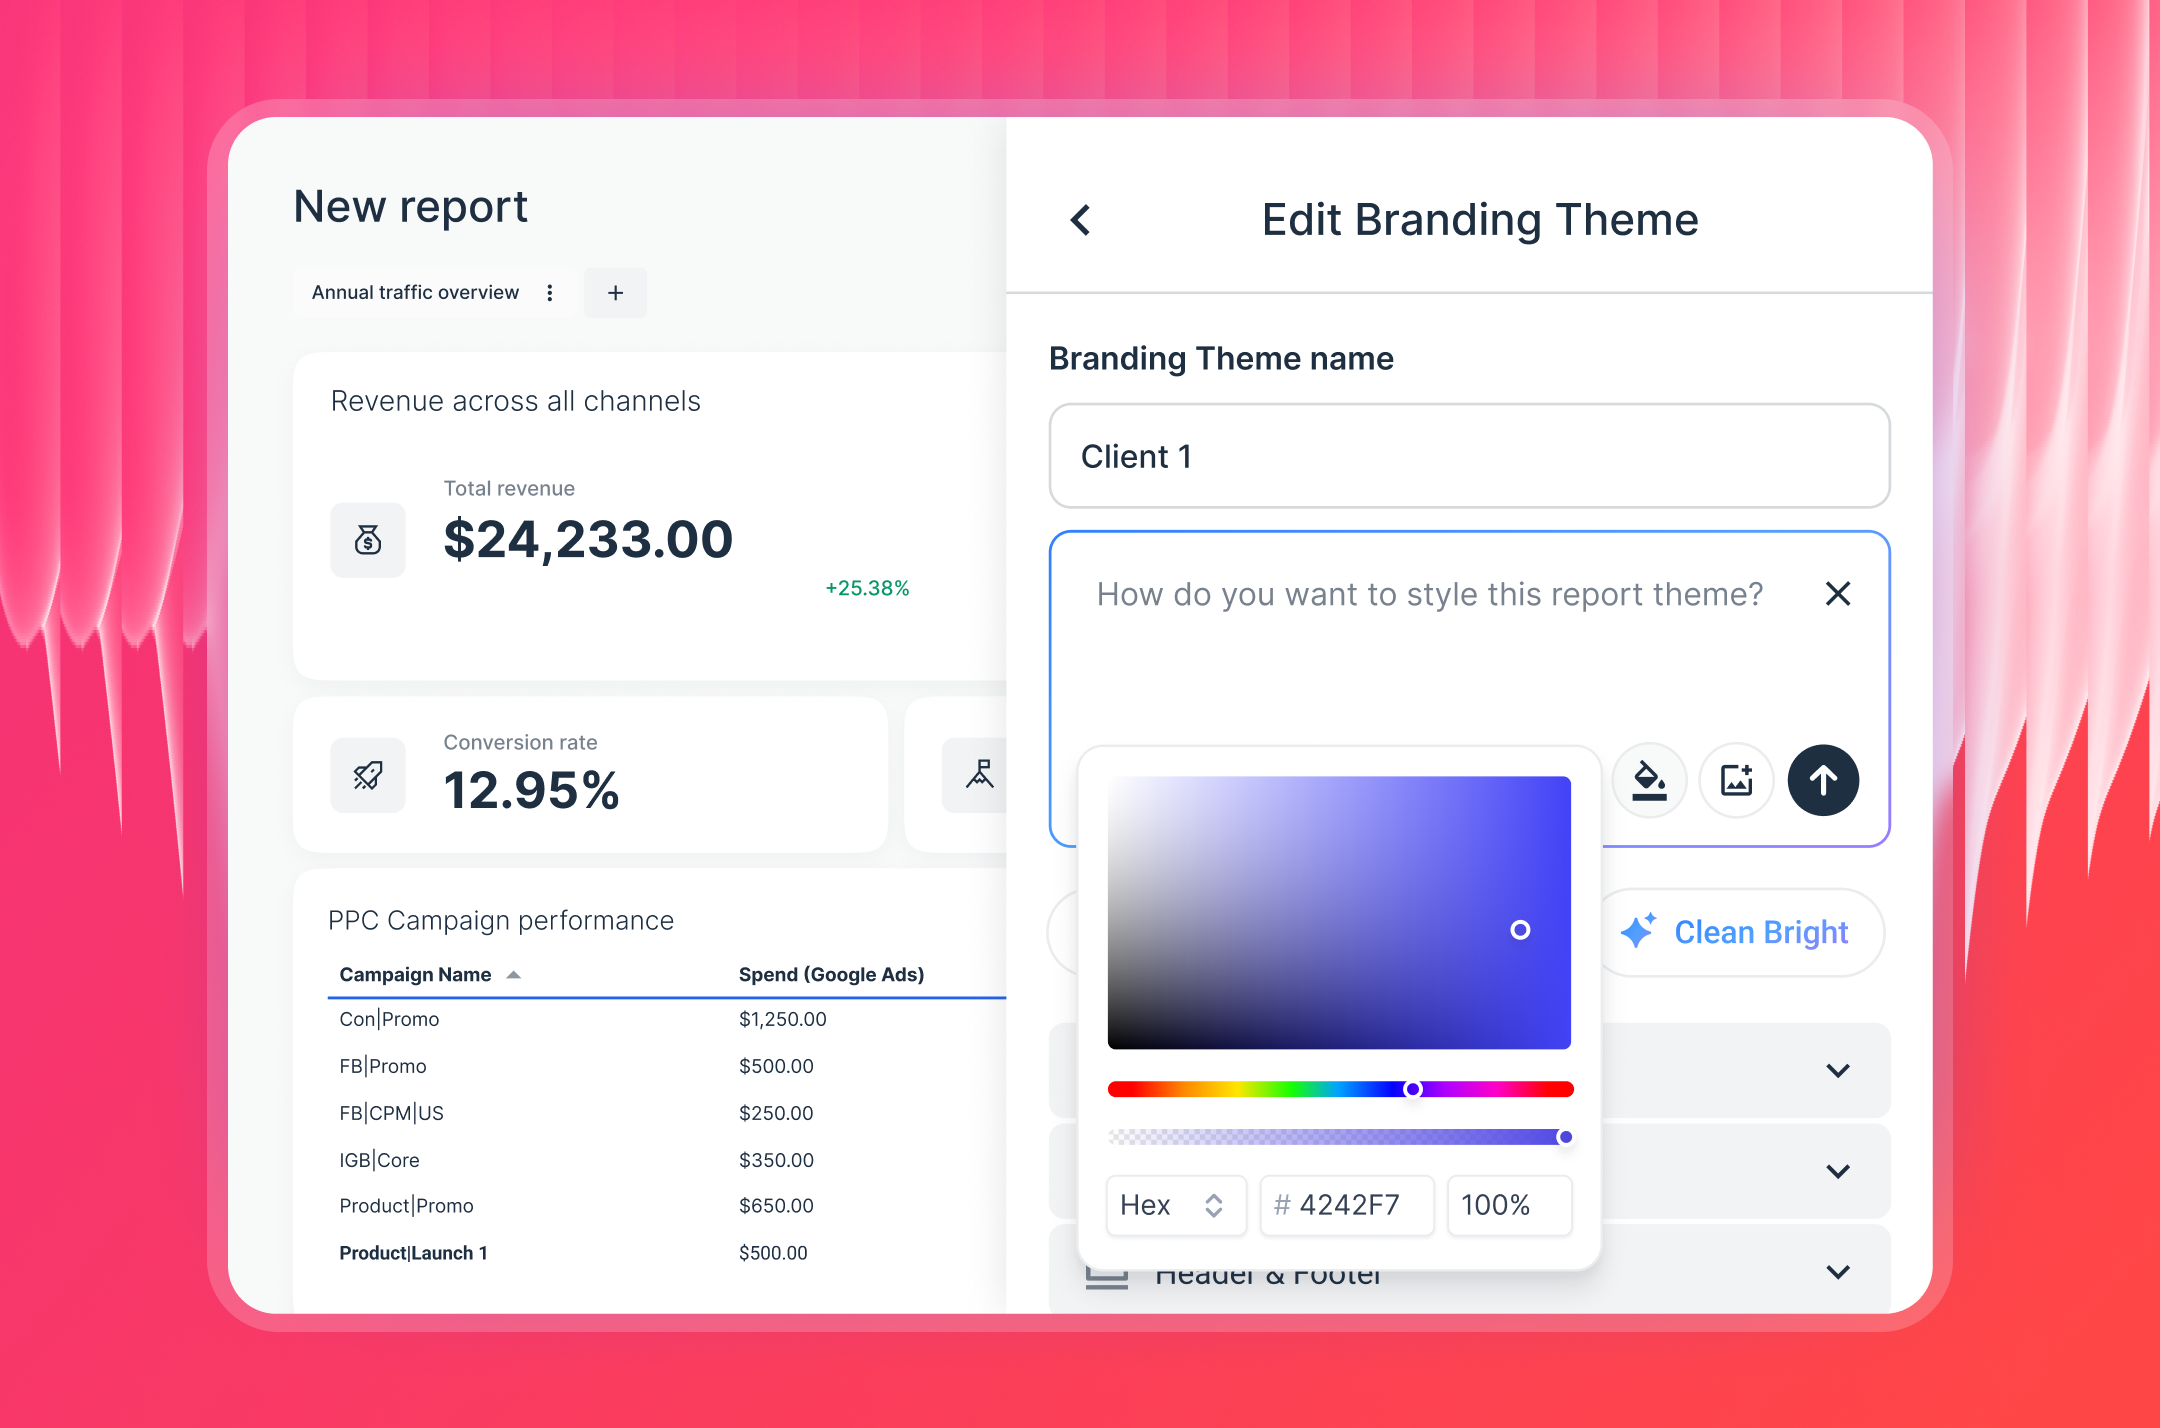
- Apply client branding in seconds using IQ Themes - just upload a logo or describe the look, and IQ handles the rest
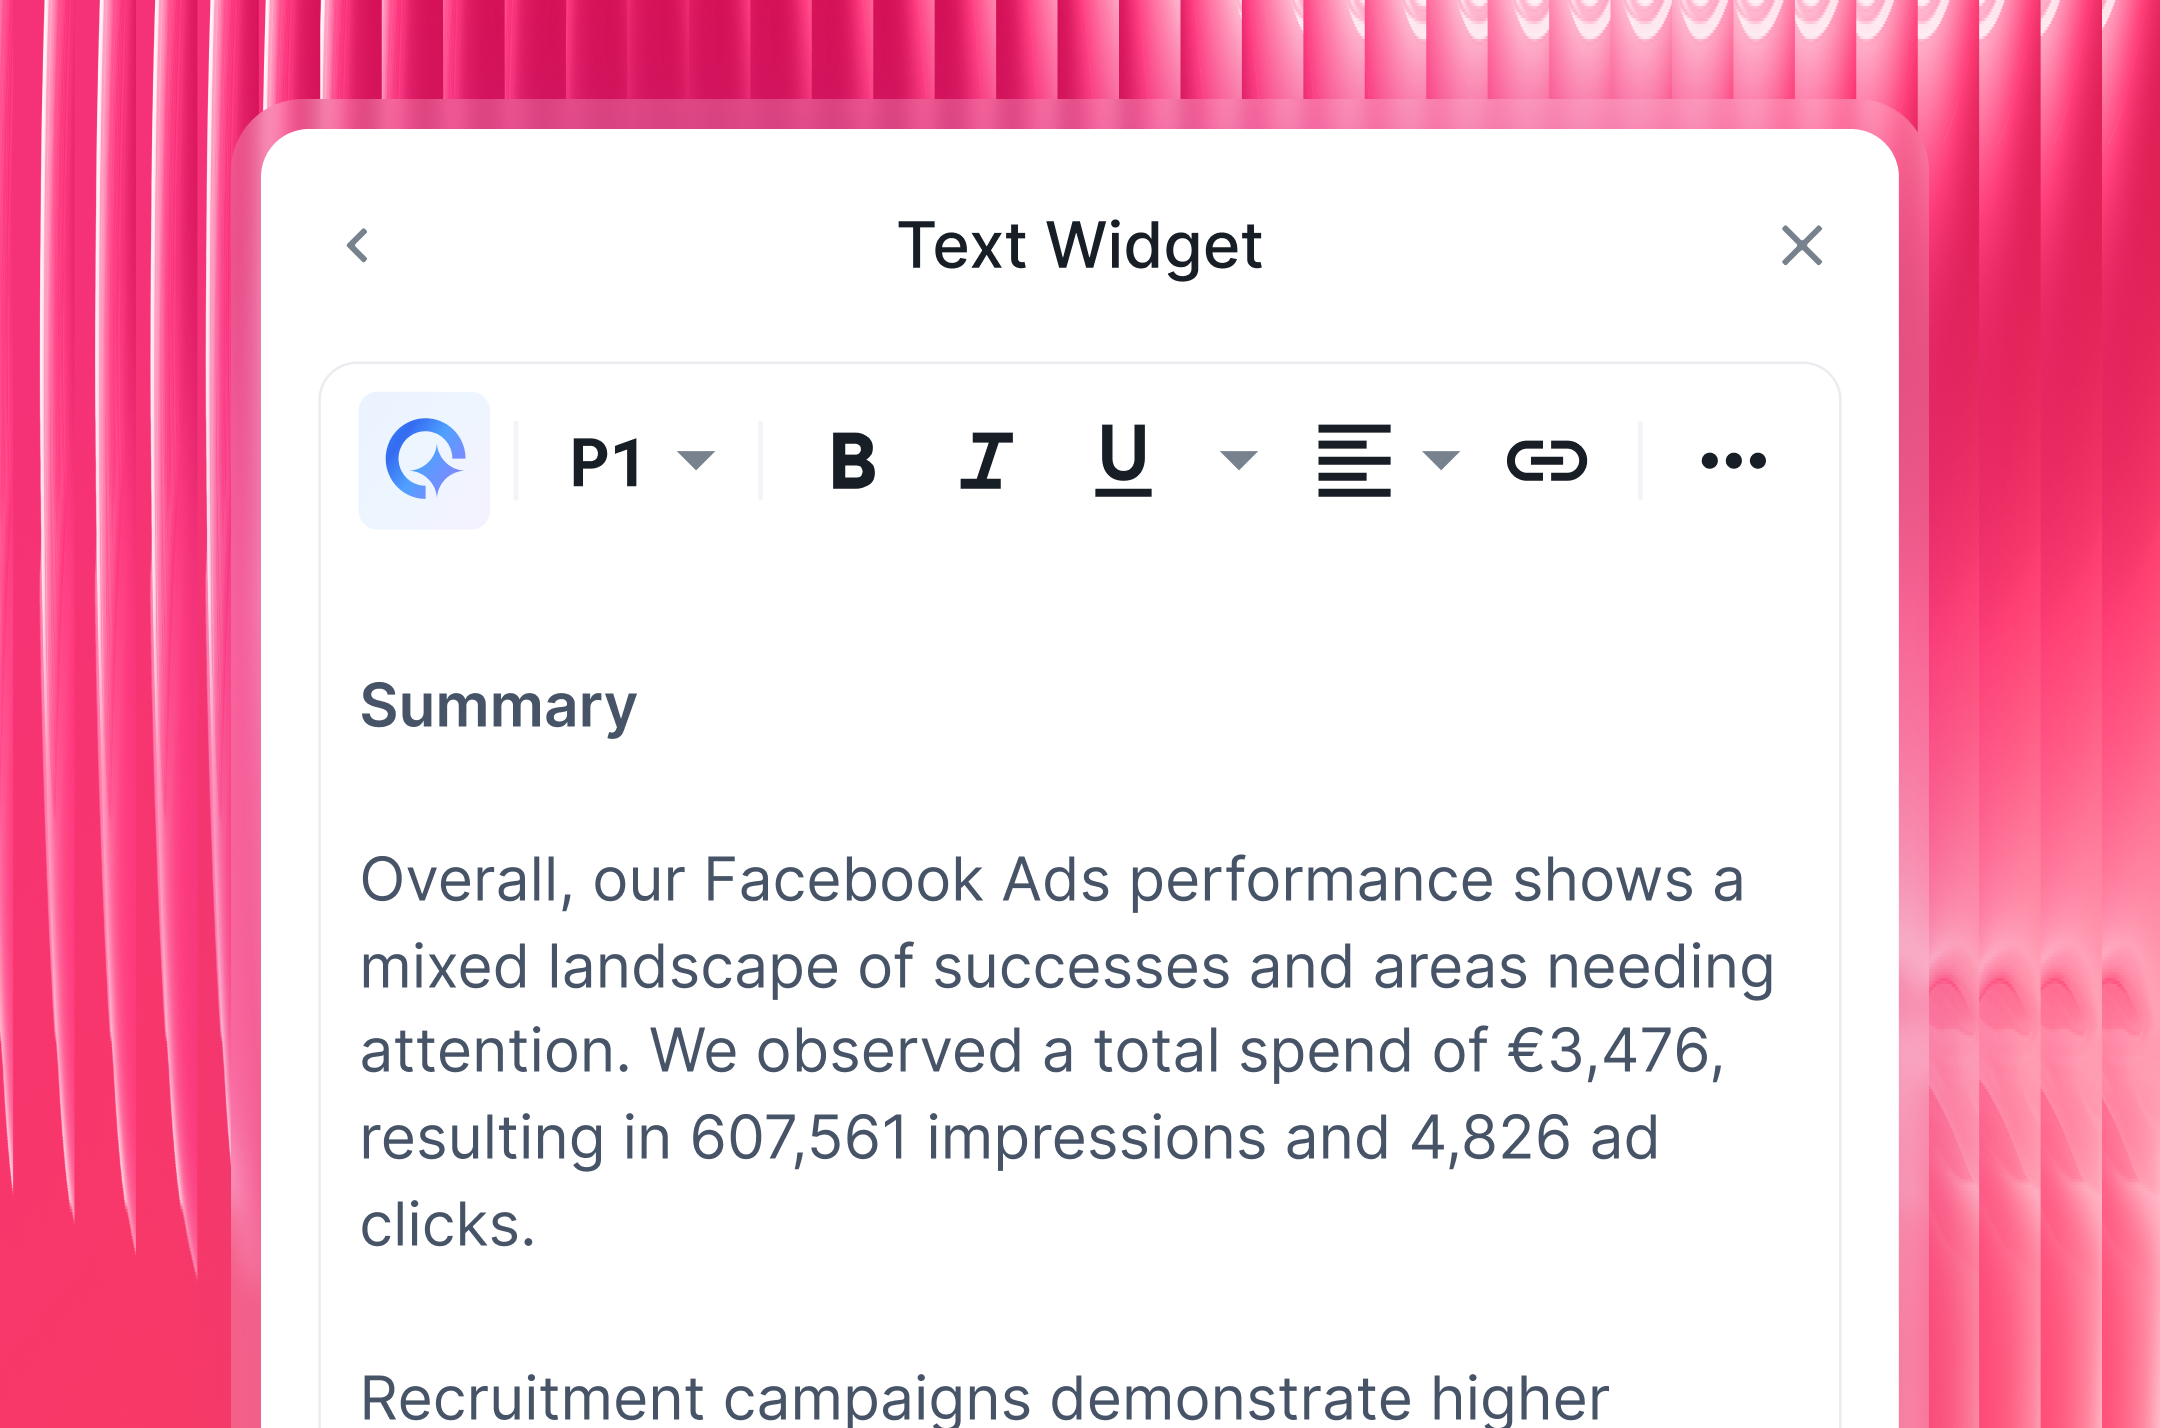
- Generate plain-language performance summaries that pull directly from your store data, so you're not writing commentary from scratch each month
- Ask IQ Chat direct questions about store performance and get instant answers without digging through dashboards
Whatagraph has also launched an MCP that lets you connect your data to Claude or ChatGPT and do your analysis there.
Whatagraph’s AI saves time and energy for marketing specialists. If they need to build reports themselves, it costs them negative energy. But if they can automate or speed it up with AI, it really gives them an energy boost—like ‘Hey this is working really nice. This is easy. This is going fast." - Lars Maat, Co-Founder at Maatwerk Online
What's the difference between Whatagraph's Magento reporting software and a Magento 2 reporting extension?
When agencies and store owners need better reporting, the first place many look is the Magento Marketplace. There are plenty of Magento 2 reporting extension options available - but they come with a set of trade-offs that add up fast.
Magento 2 reporting extensions:
❌ Require developer installation and ongoing maintenance - every Magento update can break them
❌ Show only store-level data - there's no way to combine Magento sales data with Google Ads, Meta, or GA4 in the same report
❌ Can't be white-labeled or branded for client delivery
❌ Don't support automated report scheduling or live link sharing with clients
In contrast, Whatagraph lets you:
✅ Natively connect to Magento - connect your store in a few clicks, no APIs, no developer, no extra add-on price costs
✅ Blend Magento data with any other channel - Google Ads, GA4, Meta, LinkedIn, email - all in one report or visualized side by side
✅ Use Whatagraph IQ to generate a full branded report in seconds, complete with the right metrics and layout
✅ Automate delivery to clients via email, Slack, or live link on a schedule you set once
The cross-channel view is where the real difference shows up.
With a Magento 2 reporting extension, you can see what sold. With Whatagraph, you can see what sold, what drove the traffic, what the ad spend was, and whether the campaigns actually paid off - all in one place.
Tanja Keglić, Performance Marketing Manager at Achtzehn Grad, put it well:
The biggest reason we chose Whatagraph was because of its holistic approach to reporting. We can blend data from different channels and see in one view what the performance is and what specific needs to be changed.
That's the gap a Magento 2 advanced reporting extension can't close - but Whatagraph can.
What Magento metrics should I include in a marketing report?
Choosing the right metrics for a Magento sales report comes down to what your client actually needs to act on.
But often, more is less - which Elizabeth Greene, Co-Founder at Junglr, agrees with:
A dashboard with too many metrics is often unhelpful or confusing. What we've focused on instead is identifying the few core KPIs that help us quickly spot when something is going wrong in an account - because we want to catch negative sales trends as early as possible.
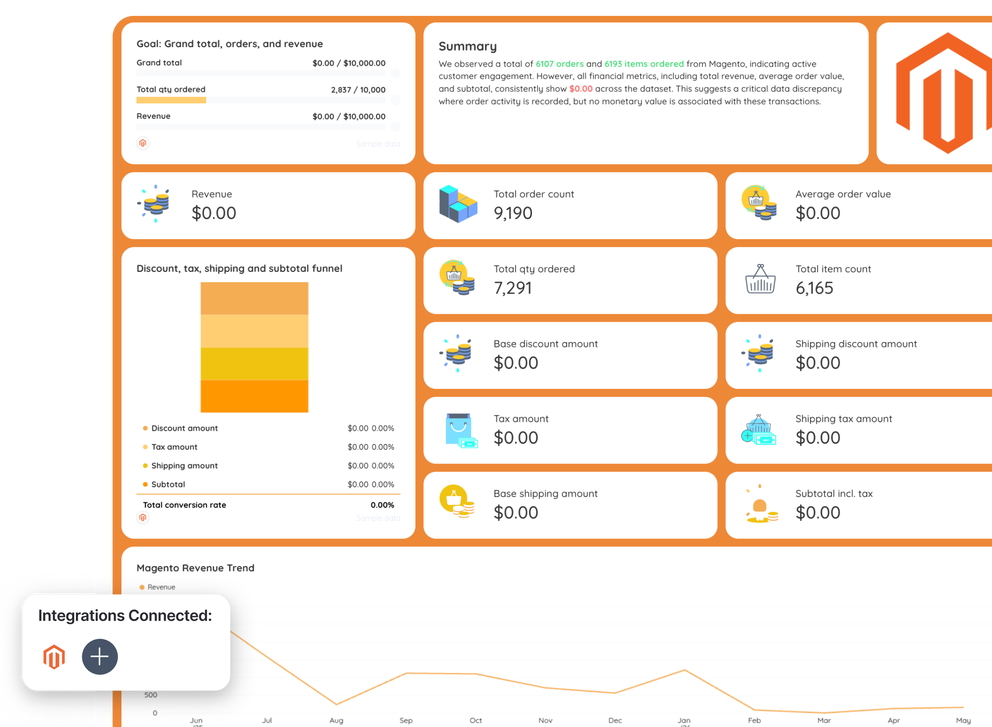
Below are the core metric categories every agency should track, based on the Whatagraph Magento dashboard template.
1. Revenue metrics
These are the top-line numbers every client checks first in their Magento 2 analytics:
- Grand total: Total revenue generated in the period - the single most important number in any e-commerce report
- Grand total over time: A trend line showing how revenue has moved day by day - key for spotting campaign impact
- Total sales by store: Revenue split by store name - useful for multi-store operations
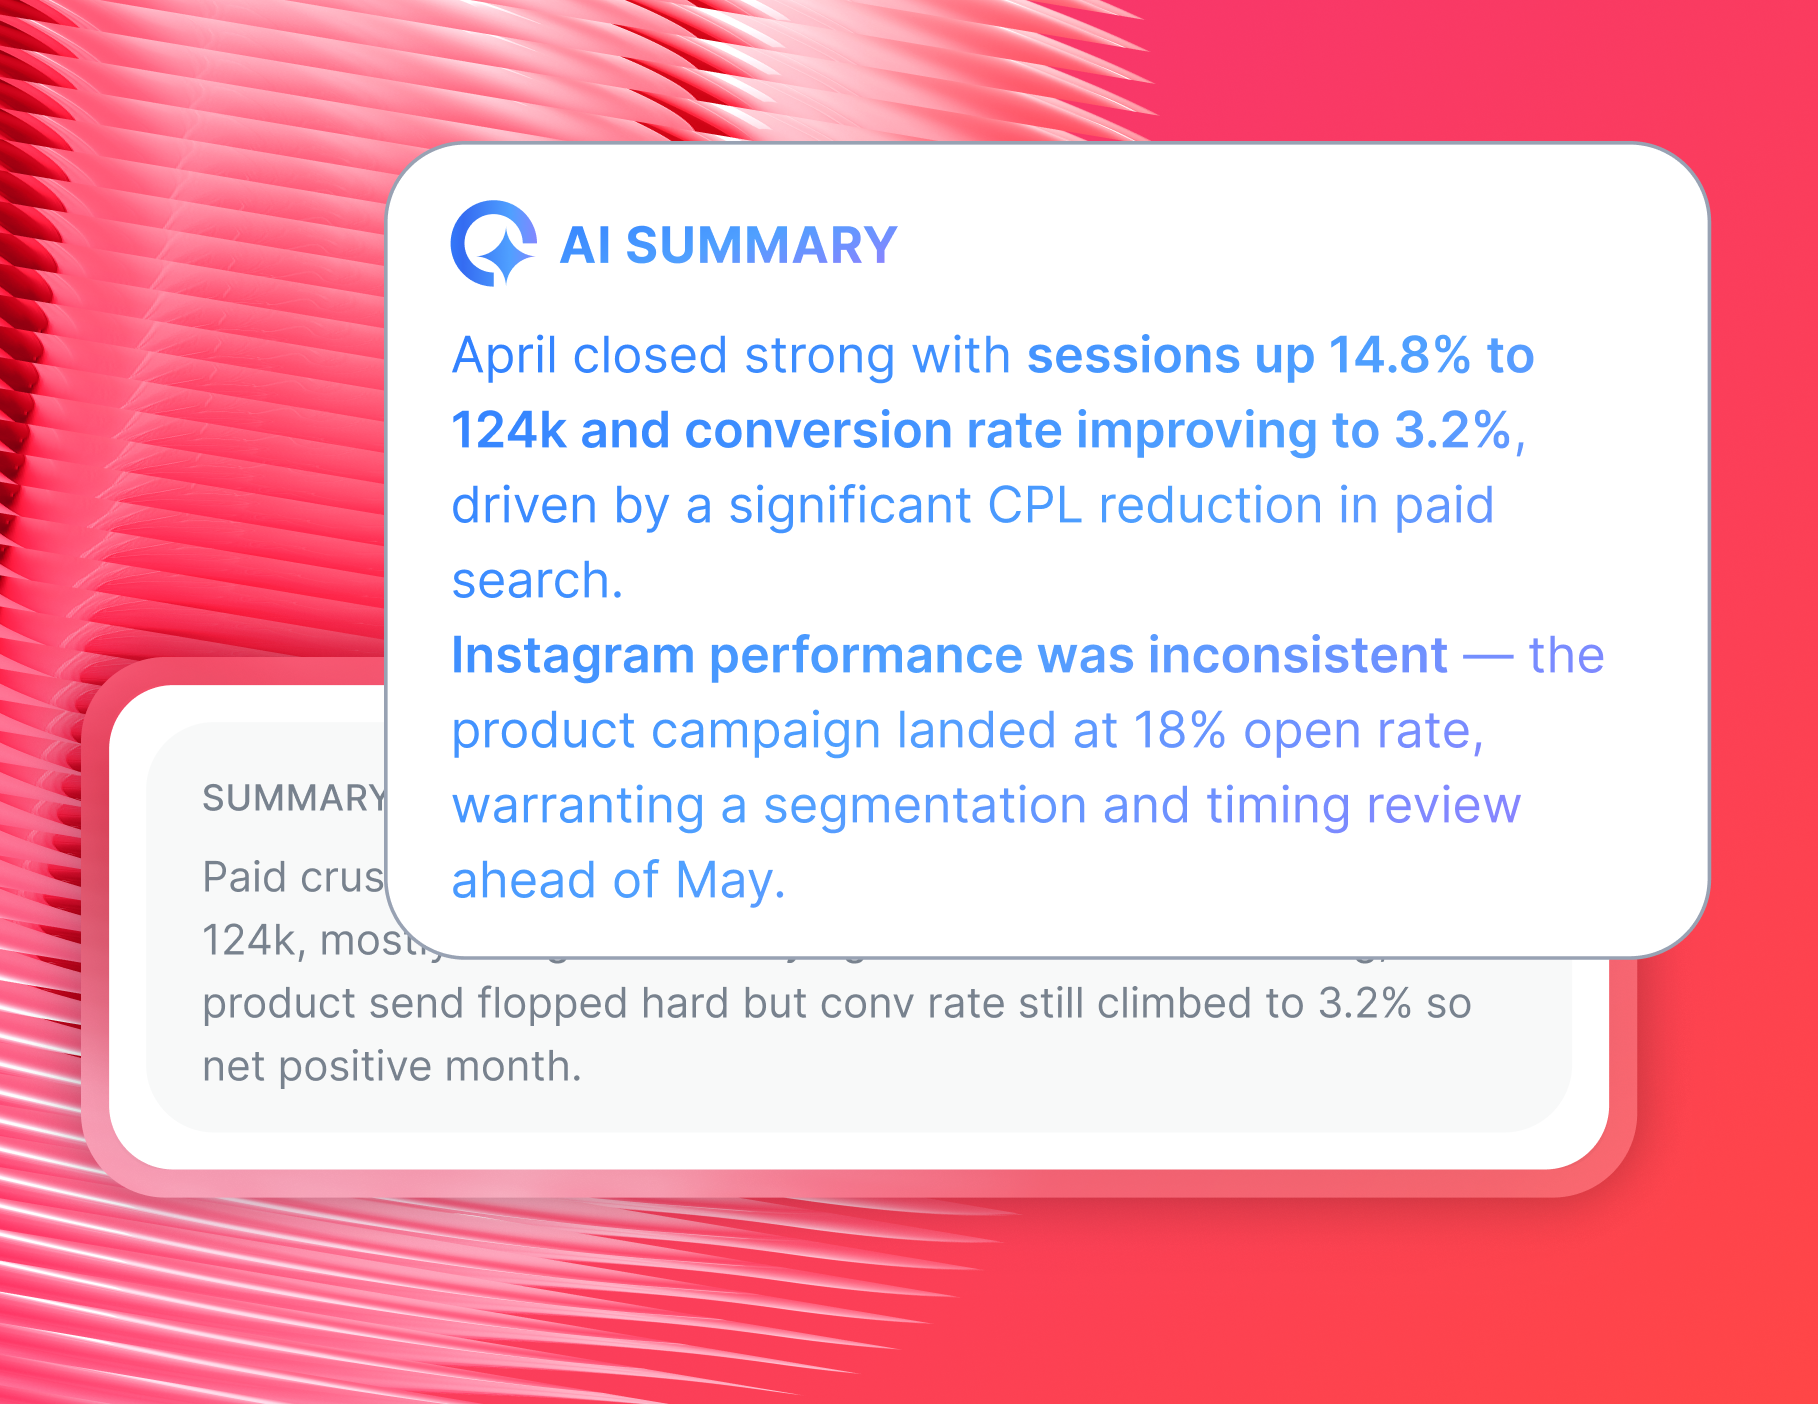
Before moving past these numbers, add a short written summary covering the key wins, any drops worth flagging, and what the team is focusing on next.
With Whatagraph IQ Summaries, this gets written automatically from your actual Magento data.
As Janet Mesh, CEO of Aimtal, explains, adding context to each report is crucial:
One of the biggest mistakes that marketers make when creating reports is just adding screenshots of sales performance charts without any context or analysis. Sending an overwhelming amount of data to a stakeholder without context can cause confusion and uncertainty.
2. Order and volume metrics
These metrics show how much activity your online store is generating, separate from revenue:
- Total quantity ordered: Total number of items ordered in the period, helpful for inventory management
- Total item count: Number of individual line items across all orders - useful for stores with high average cart sizes
- Order quantity by store: A table breaking down total QTY ordered per store with base currency - highlights which stores are moving the most product
- Total quantity ordered over time: A trend line showing order volume fluctuations - great for identifying peak demand days or weeks
3. Fulfillment and financial metrics
Fulfillment and financial metrics give clients visibility into the health of their orders:
- Shipping amount: Total shipping revenue collected across all orders
- Tax amount: Total tax collected - important for finance teams and compliance reporting
- Subtotal: Order value before shipping and tax - useful for understanding true product revenue
- Total cancelled: Value of orders cancelled in the period - a rising number here is worth flagging proactively
- Subtotal cancelled: The pre-tax, pre-shipping value of cancelled orders
- Items in different order status: A pie chart breakdown of total item count by order status (complete, pending, cancelled, etc.) - gives a quick visual inventory report
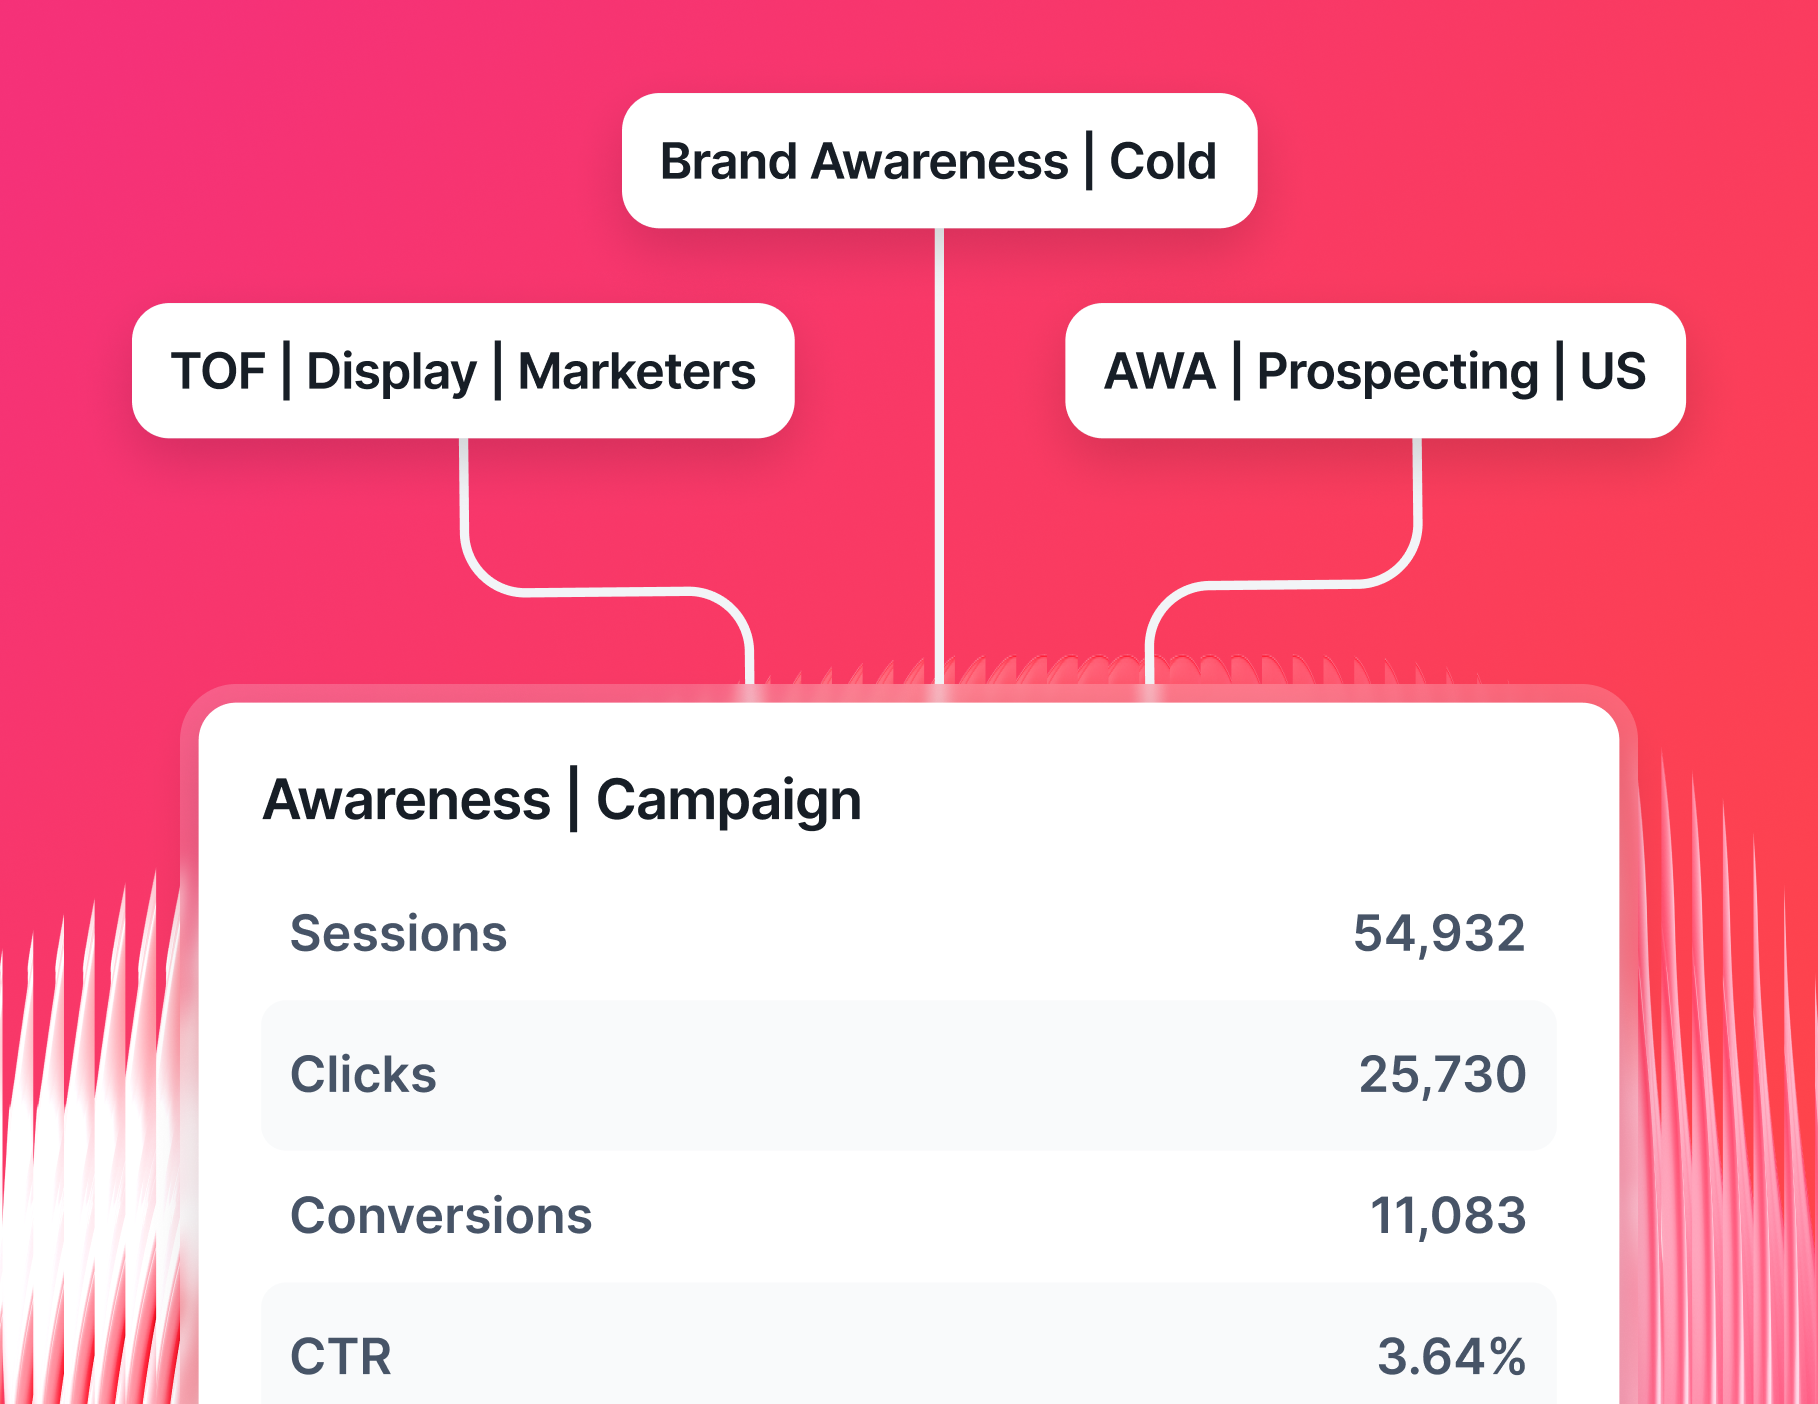
4. Cross-channel context - the metrics that make store data meaningful
Magento metrics tell you what sold. Cross-channel data tells you why.
A standalone Magento reporting dashboard only shows half the picture. Pairing your store data with marketing channel performance gives clients a complete view of what's actually driving results:
- Ad spend vs. grand total revenue: Compare what was spent on Google Ads or Meta against the store revenue it generated in the same period
- Sessions and traffic sources: From GA4, showing which channels drove visitors to the store
- Conversion rate by channel: Which traffic sources are converting best, not just which drive the most clicks
- Cost per acquisition: Total ad spend divided by the number of completed orders, across all paid channels
This is the cross-channel view that Magento's built-in reports can't give you - but Whatagraph can, by connecting Magento data and paid channel data side by side in the same report.
Can Magento store reports be automated and shared with clients?
Yes - and once it's set up, you won't have to touch it again. With Whatagraph, you can go from connecting your Magento store to sending branded, automated reports to clients in under 30 minutes.
Here's how it works, step by step.
1. Connect your Magento store
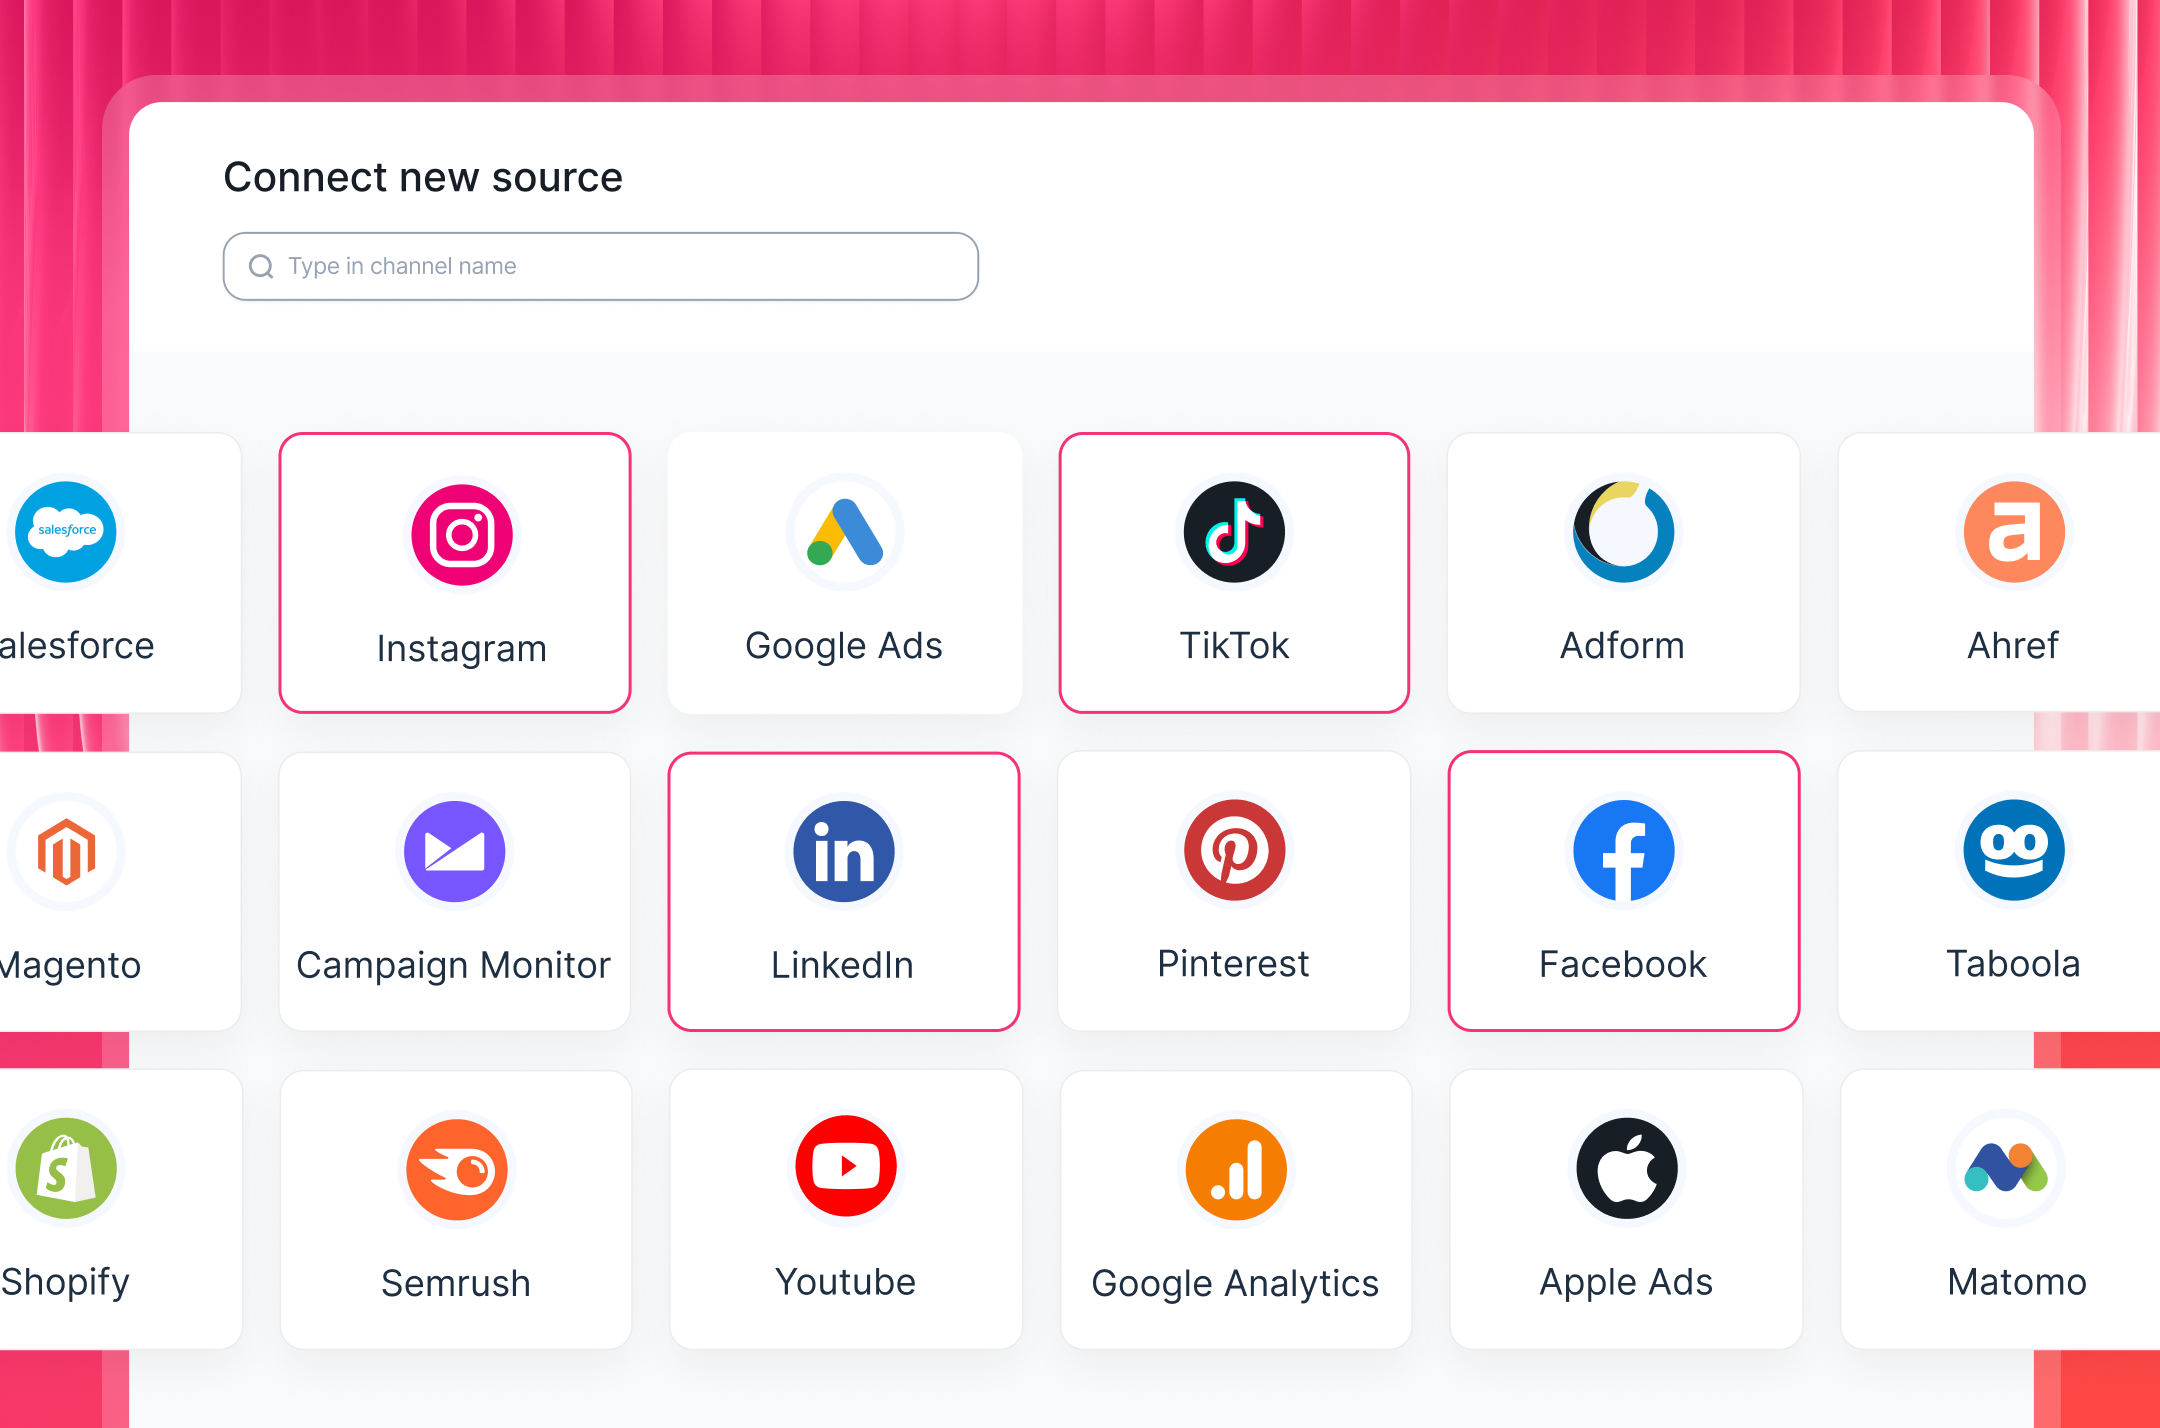
Start by connecting your Magento account through Whatagraph's native integration.
From your workspace, find the Magento connector, authenticate with your store credentials, and you're done.
No extensions to install, no developer needed, no third-party middleware. Setup takes a few minutes.
From there, you can also bring in data from any other source you need:
- PPC: Google Ads, Meta Ads, LinkedIn Ads, Pinterest Ads
- Analytics: GA4, Google Search Console, Matomo
- E-commerce: Shopify, BigCommerce, WooCommerce
- Email: Klaviyo, Mailchimp, ActiveCampaign
- SEO: Semrush, Ahrefs, SE Ranking
All integrations are fully managed and stable - Whatagraph handles connector maintenance, not your team.
2. Organize and blend your data
Once your Magento store is connected, take a few minutes to clean things up before building the report.
Standardize store names, align currencies across multi-store setups, and decide which channels you want to combine with your Magento data.
On Whatagraph, you can:
- Blend Magento revenue data with paid channel spend in one unified view
- Filter by store, region, or currency
- Standardize metric naming so everything reads consistently across sources
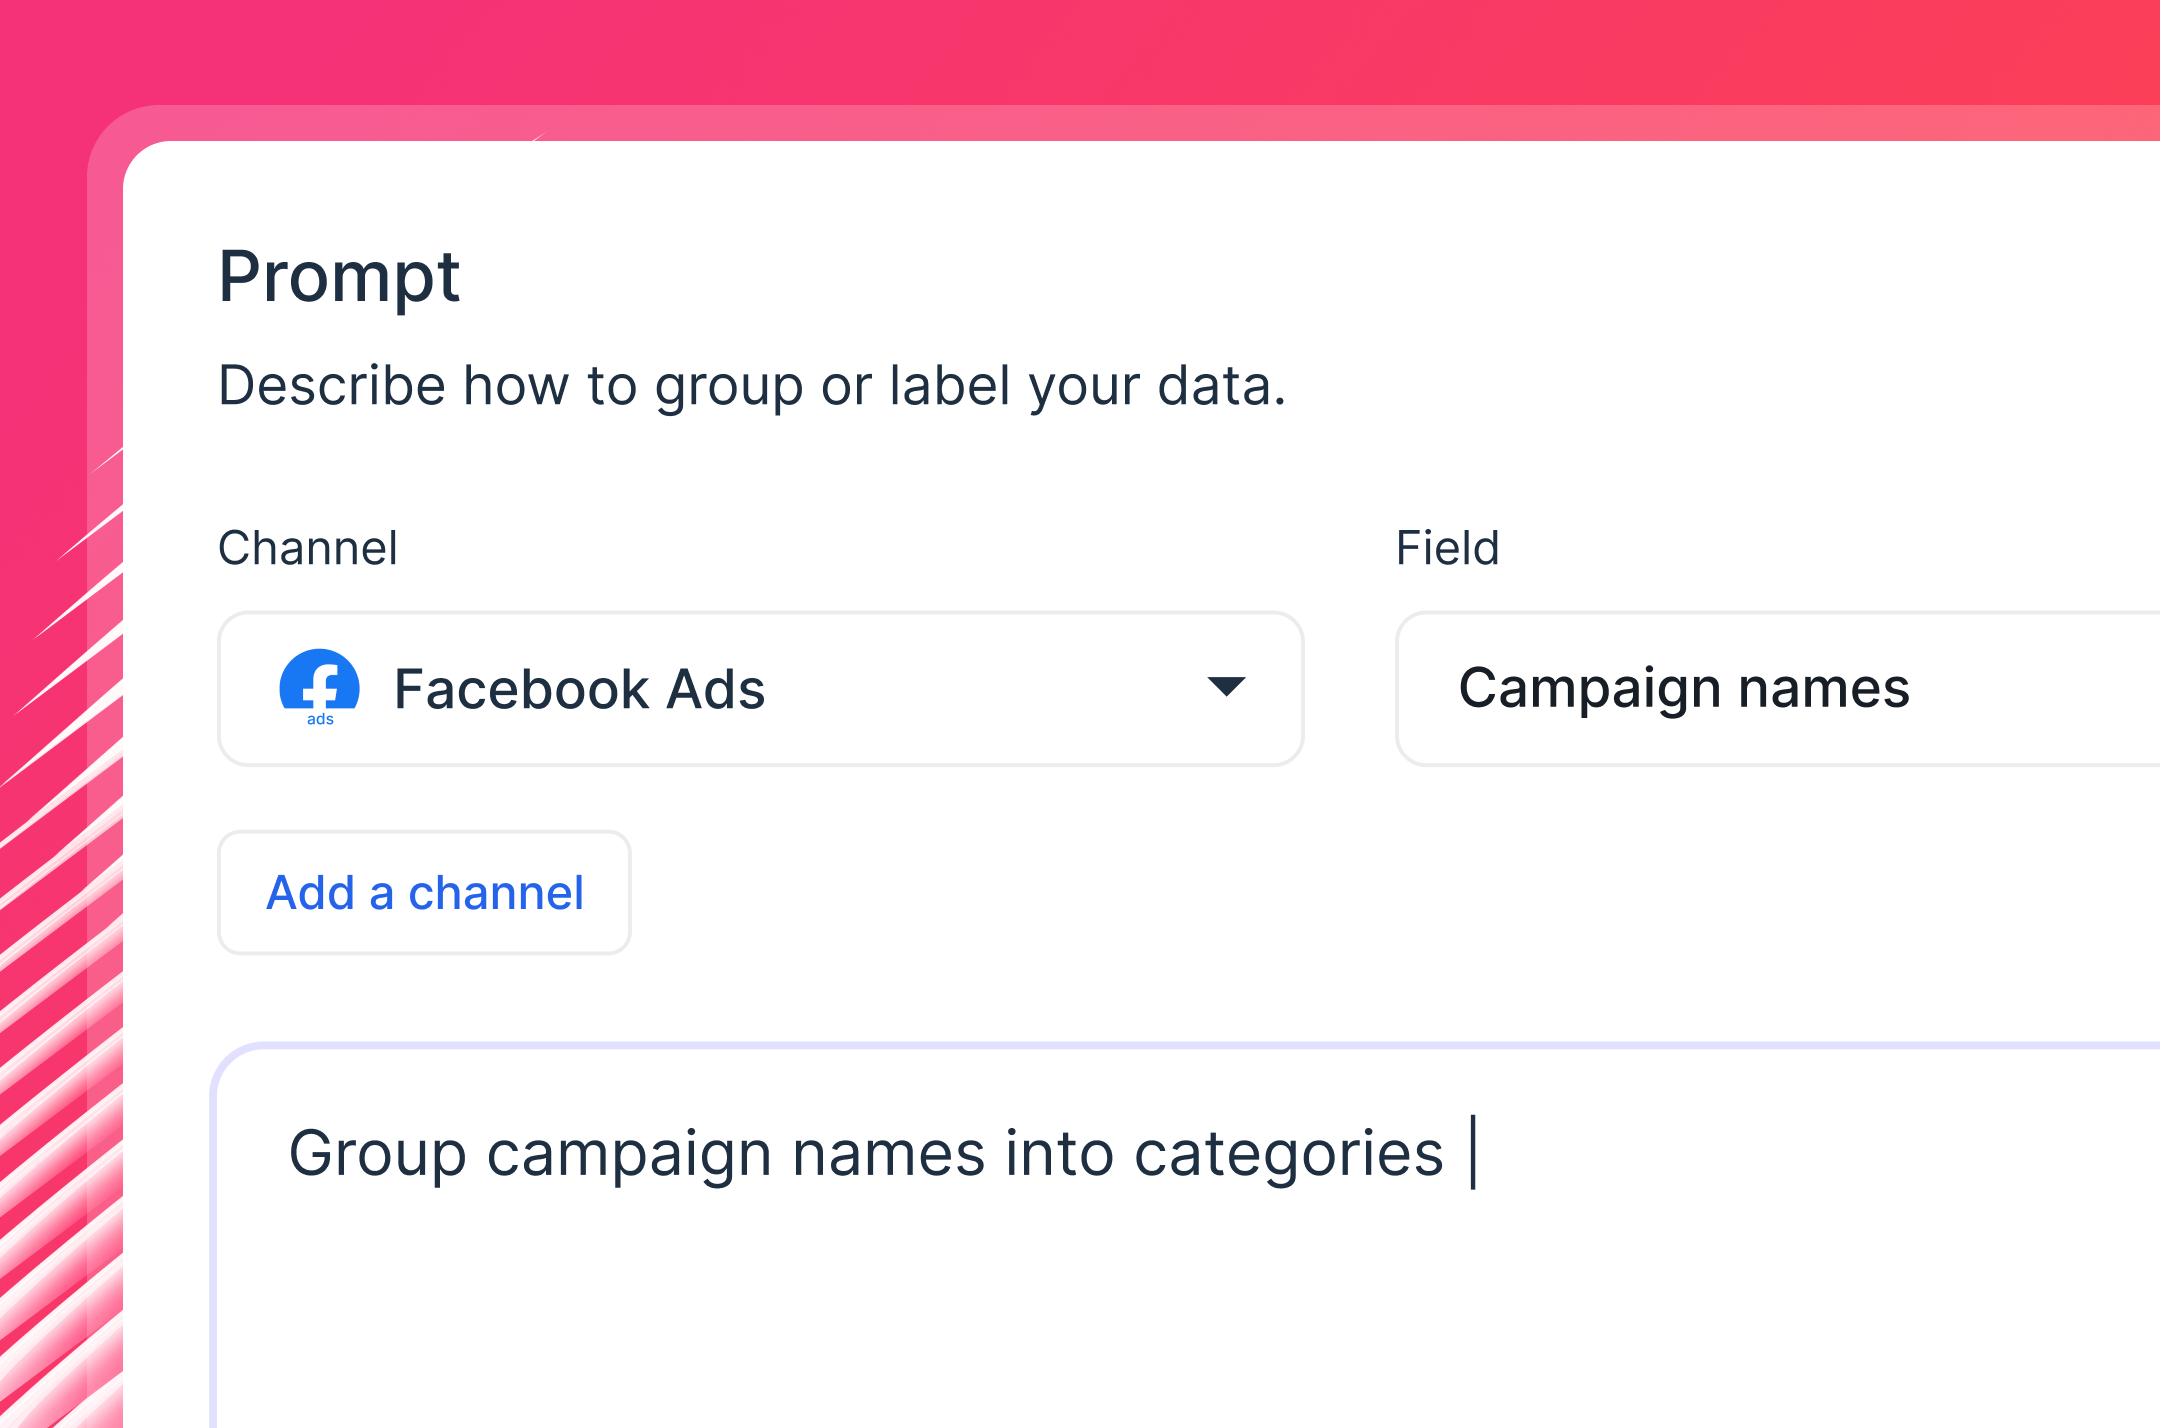
- Create custom metrics without formulas or coding
With Whatagraph IQ Dimensions, you can just describe what you need, and AI builds the dimension for you.
3. Build automated Magento reports for clients
This is where Magento advanced reporting gets genuinely fast.
Rather than building reports widget by widget, describe what you need, and Whatagraph IQ builds the full report - tabs, charts, KPI scorecards, and layouts included.
Your Magento data and any connected channels flow in automatically.
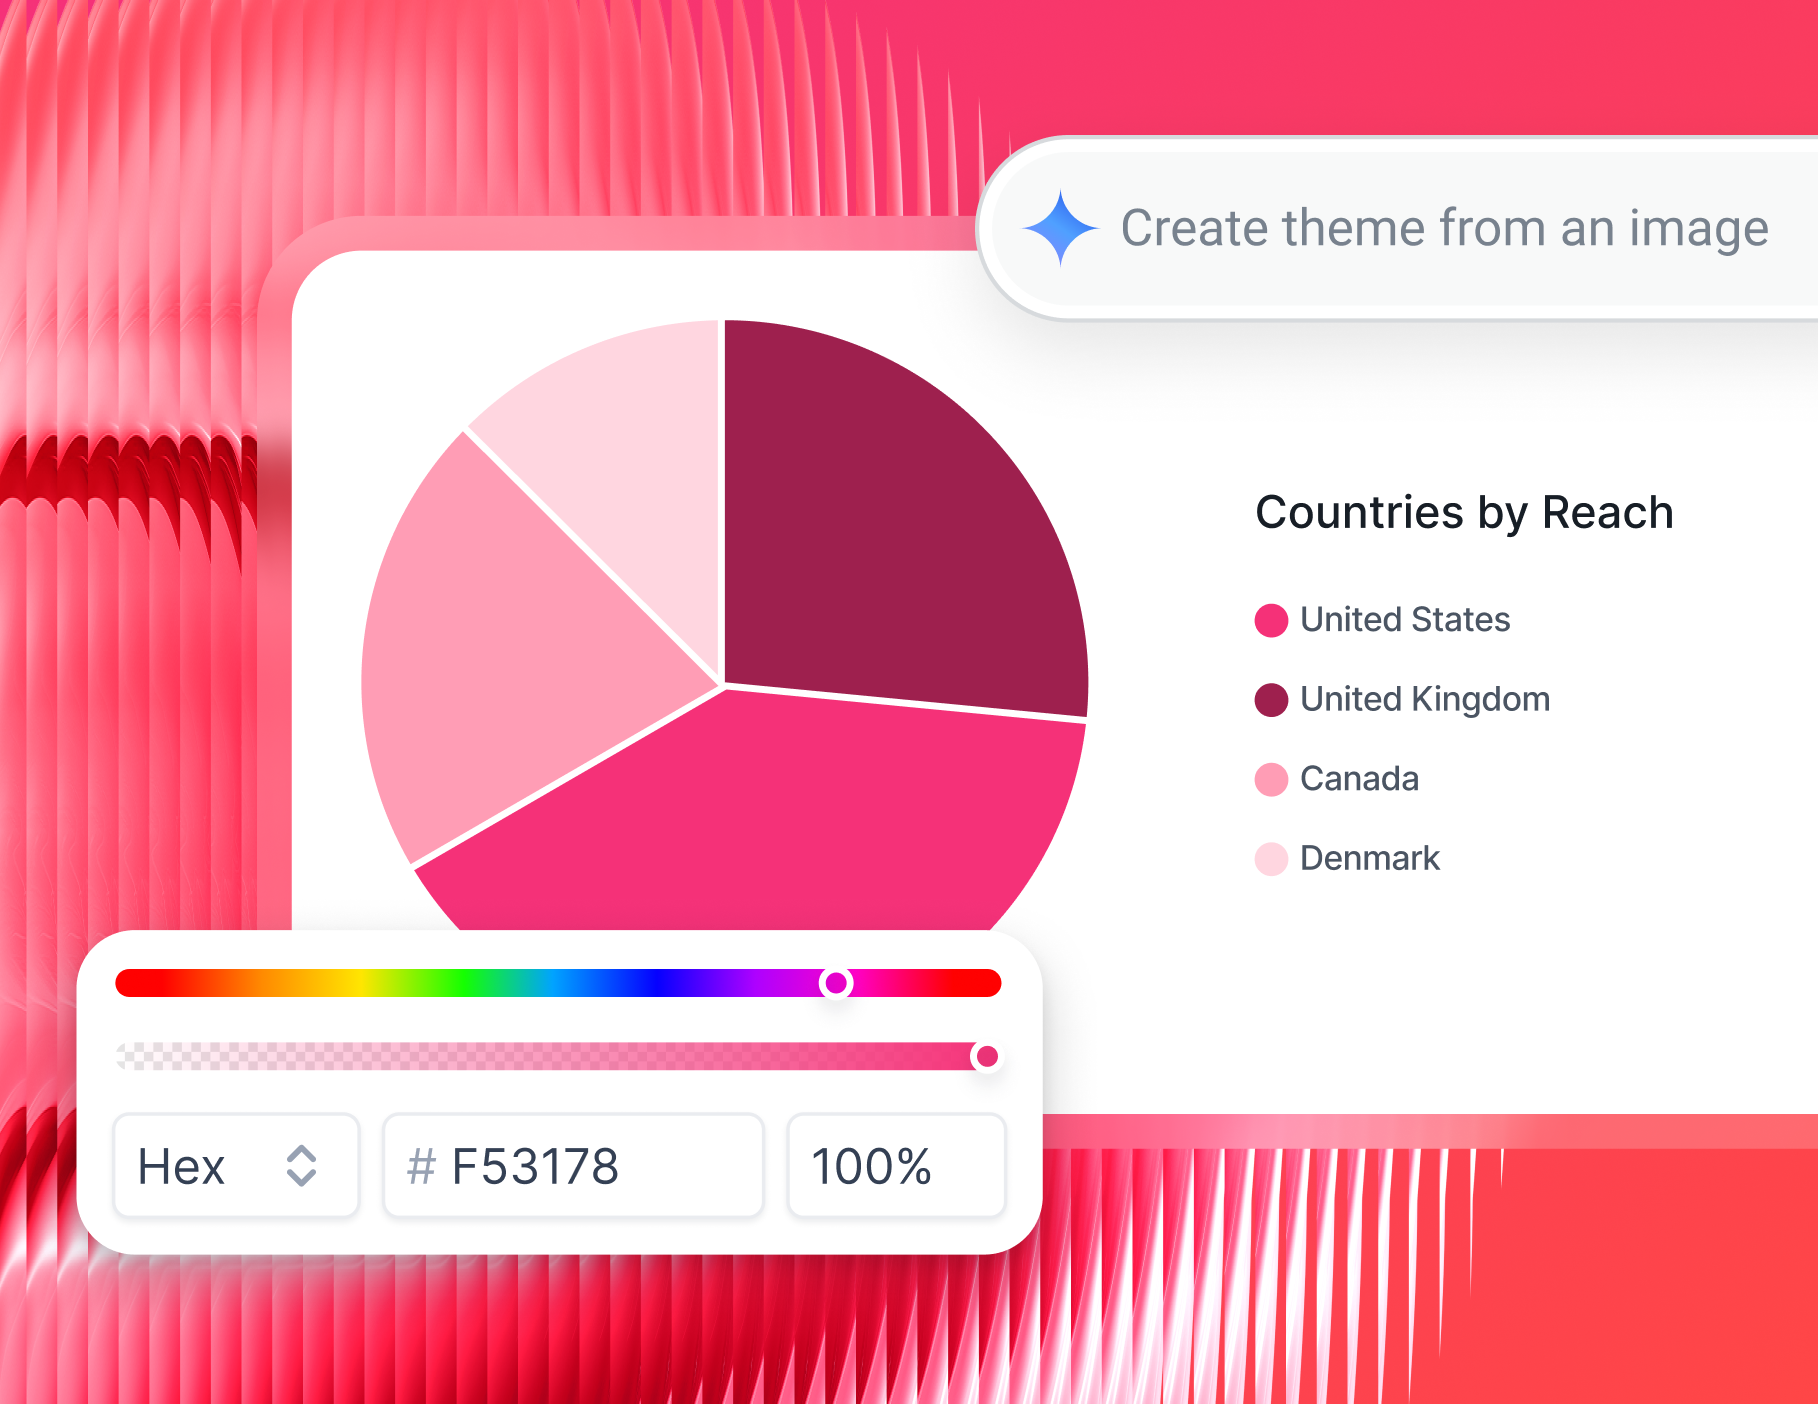
Want it branded to your client? Upload their logo or type a description of their visual style, and IQ Themes applies matching colors, fonts, and styling across the entire report in seconds.
Want performance commentary without writing it yourself? IQ Summaries reads the actual data in your report and generates written insights you can edit before sending.
The numbers alone rarely do the selling, which is why summaries are important. Stef Oosterik, Quality Manager at Dtch. Digitals has seen firsthand with his own clients: "Clients get bored if the reports are just a bunch of numbers."
Pro tip: Save your report as a team template and duplicate it for every new client. Use linked templates to edit everything at once - change the master report and all linked reports update automatically.
4. Monitor performance internally
Client reports are one thing. Your team also needs a way to track performance across all Magento accounts without opening every individual report.
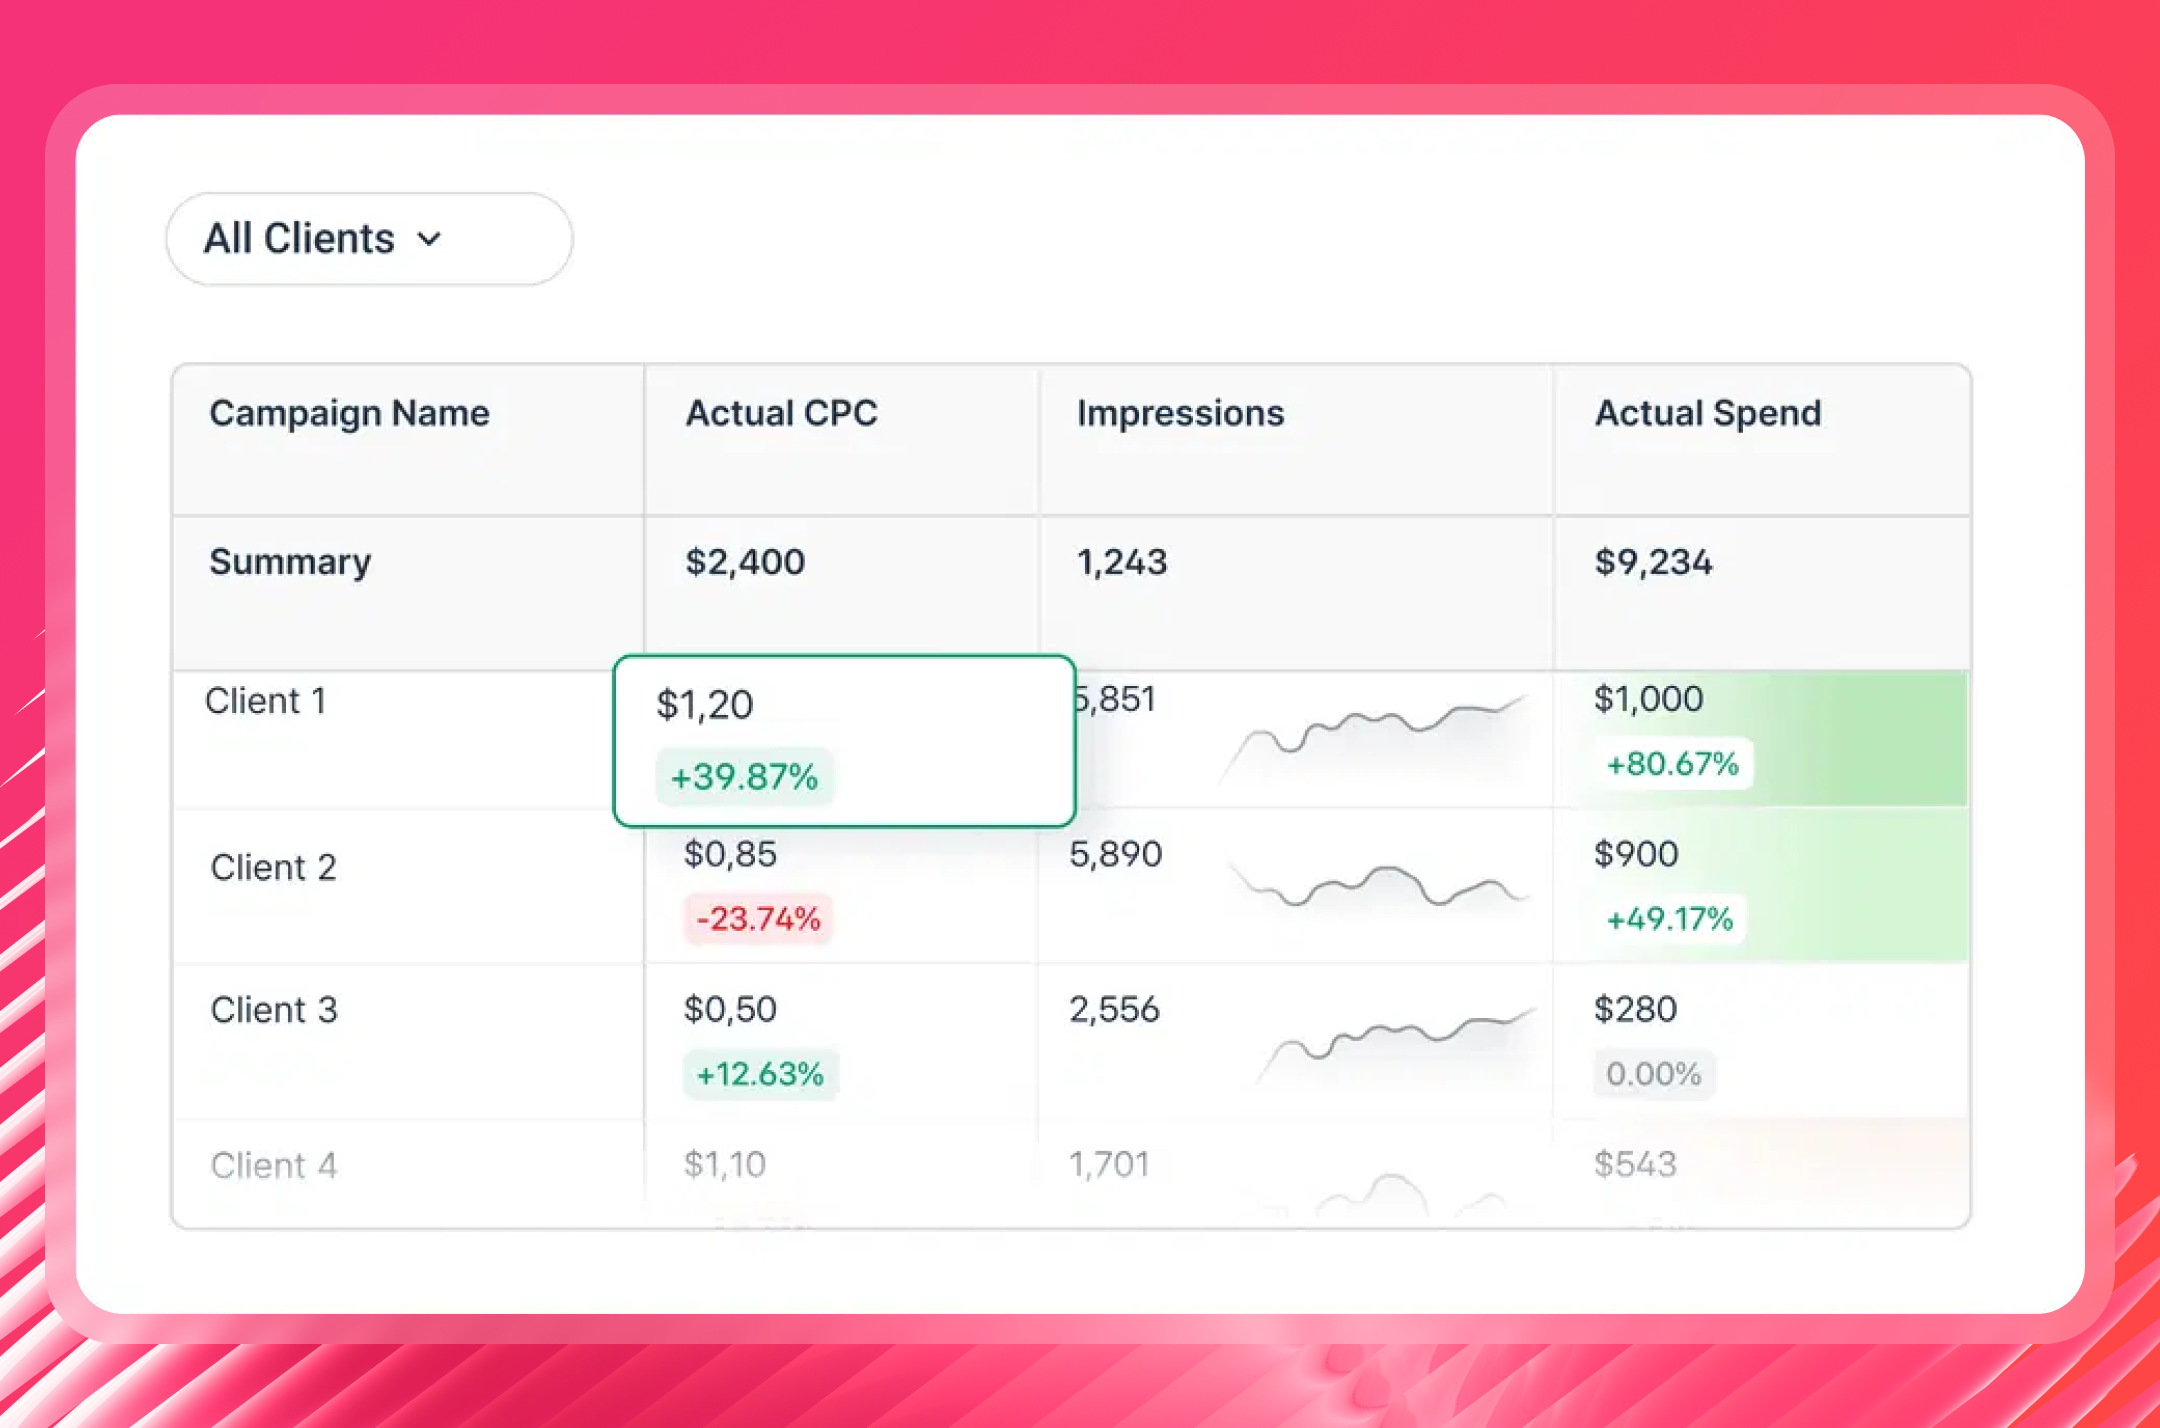
Whatagraph's Overviews give you an internal dashboard across all clients and stores in one place. Use it to:
- Get a sales overview, follow order volume, and key KPIs across every client account
- Flag stores that are trending down or hitting spend limits
- Monitor performance by account manager or region
- Set goals and get alerts when something goes off track
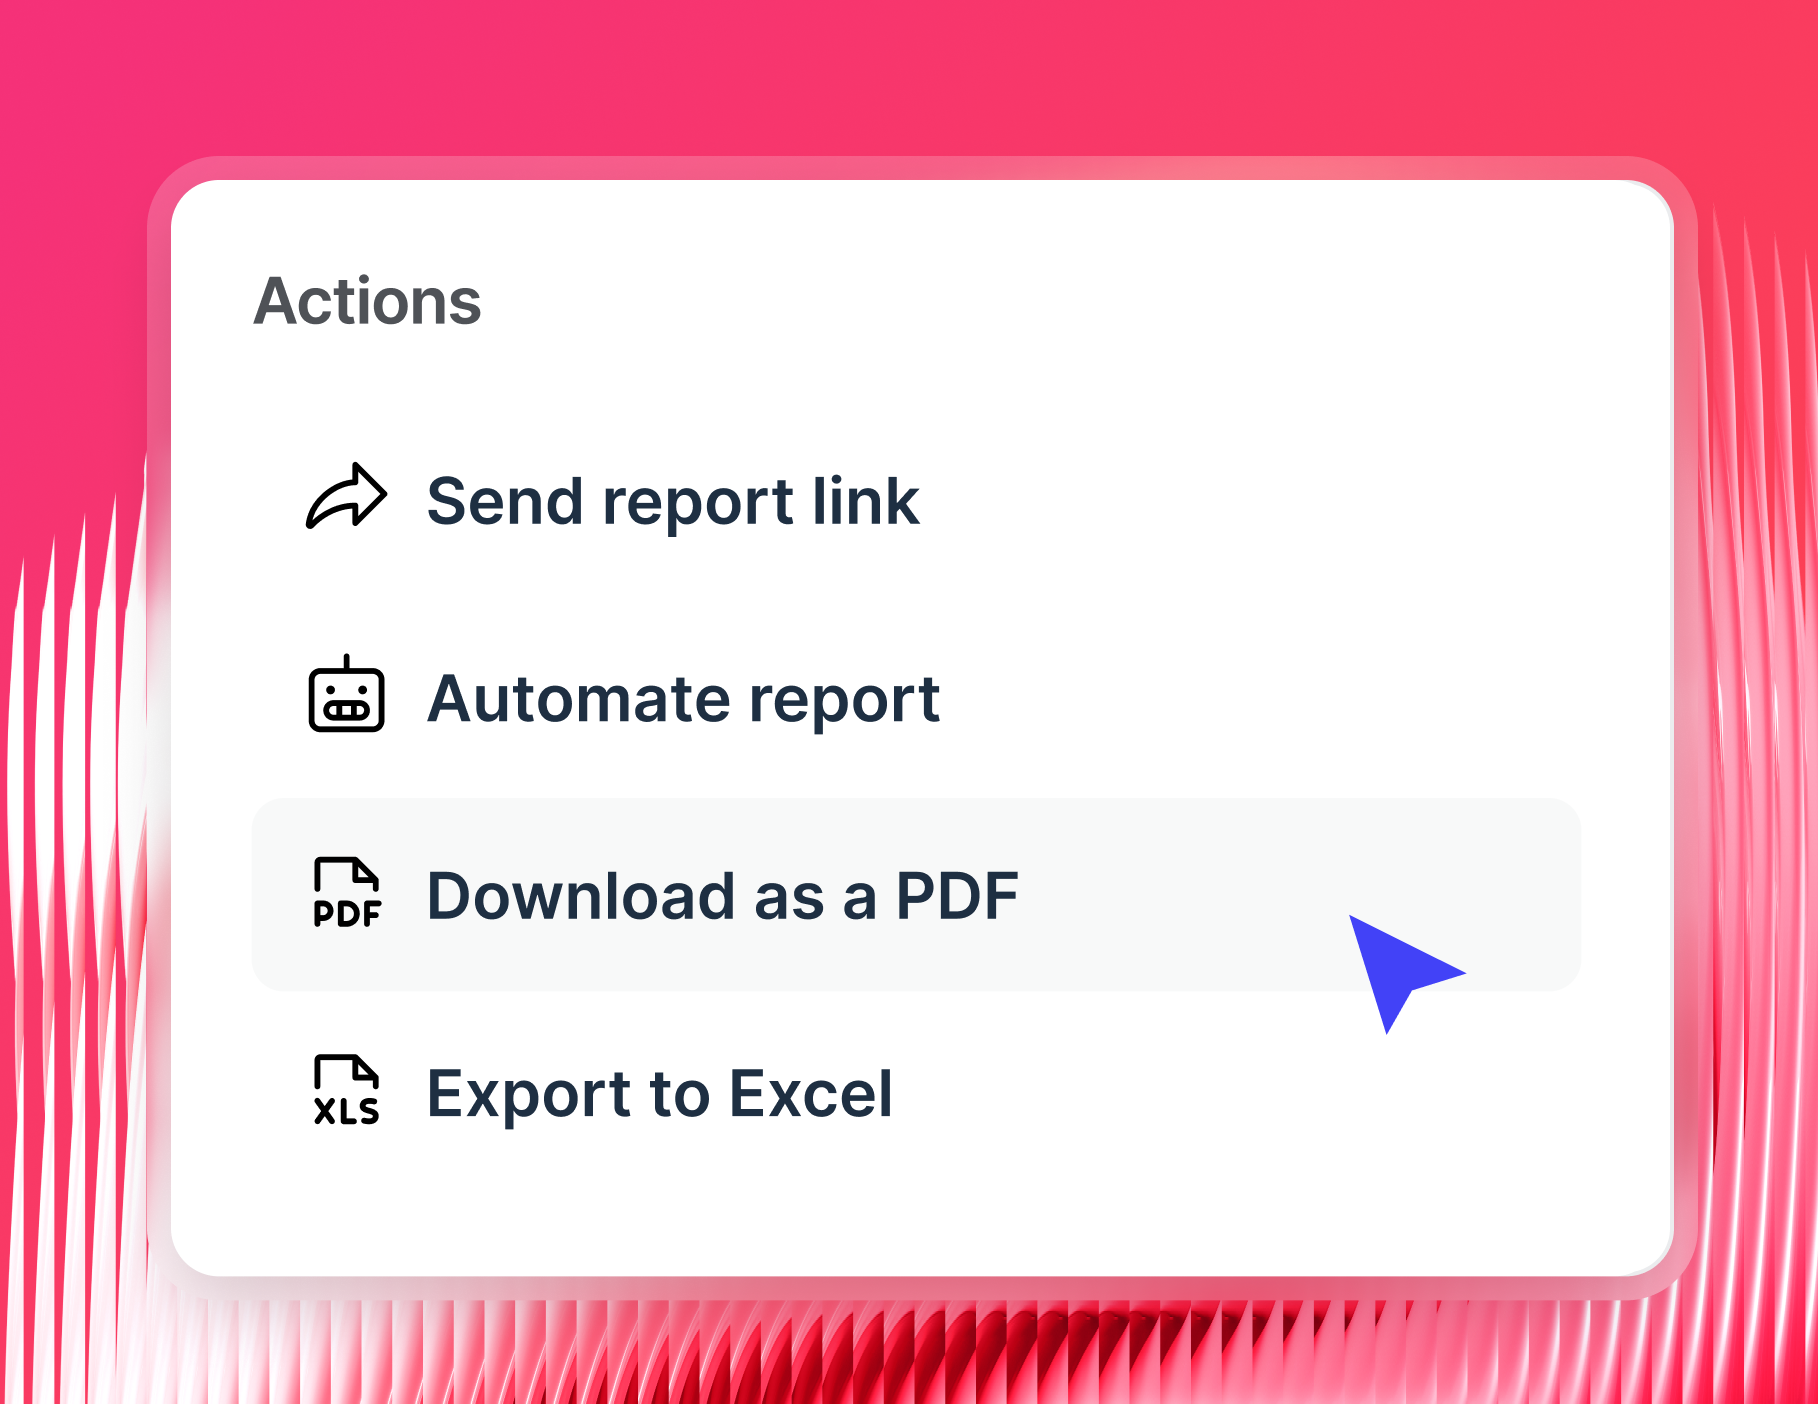
5. Share reports your way
Once your Magento report is built, set up delivery, and it runs on its own:
- Automated emails: Set the exact date range, time, and cadence - weekly, monthly, or quarterly. Reports go out via email or Slack automatically
- Live links: Share a link that updates in real time so clients can check their store performance whenever they want
- PDF or CSV exports: For clients who prefer a static file or need it for internal presentations
- BigQuery or Looker Studio: Push your Magento and marketing data onward for deeper analysis or custom visualizations
You can also enable IQ Chat on shared reports, so clients can ask plain-language questions about their store data and get instant answers without contacting your team.