Pinterest Ads Reporting Software
Monitor and report your paid campaign performance with our Pinterest Ads reporting software. Get all your KPIs in one place and transform them into actionable insights. Easily track and analyze your conversion metrics based on campaigns, ad sets, and ads. See which promoted pins drive the most traffic to your website. Turn performance metrics from your clients’ advertising platforms into actionable insights to help you reach goals, drive growth, and retain your clients. Build engaging visual Pinterest Ads reports in minutes and automate sharing through scheduled emails or live links.


Analyze and share your paid ads performance with our intuitive Pinterest Ads reporting tool
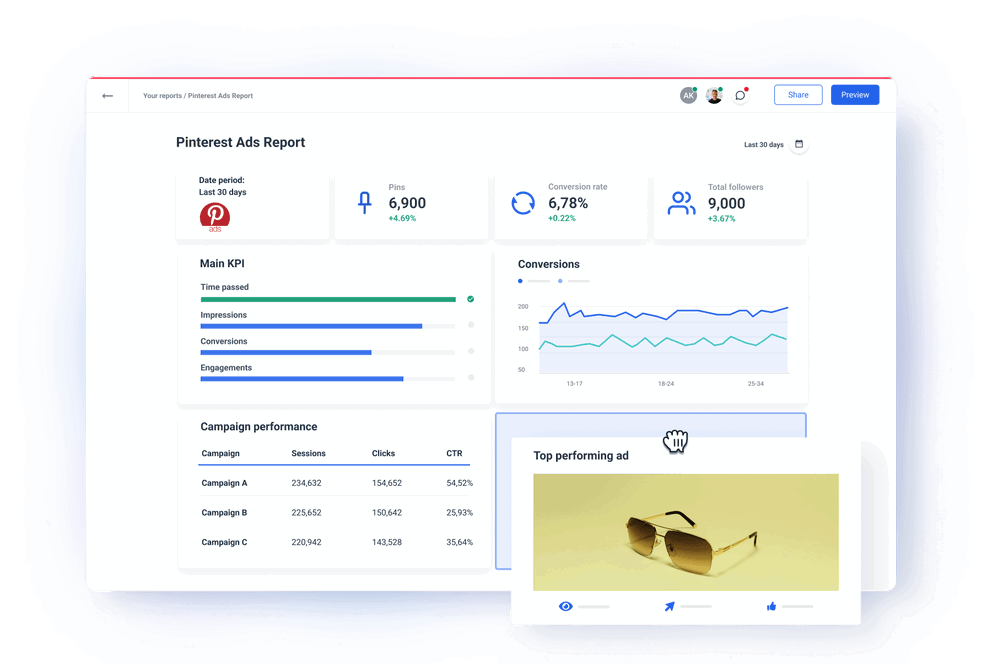
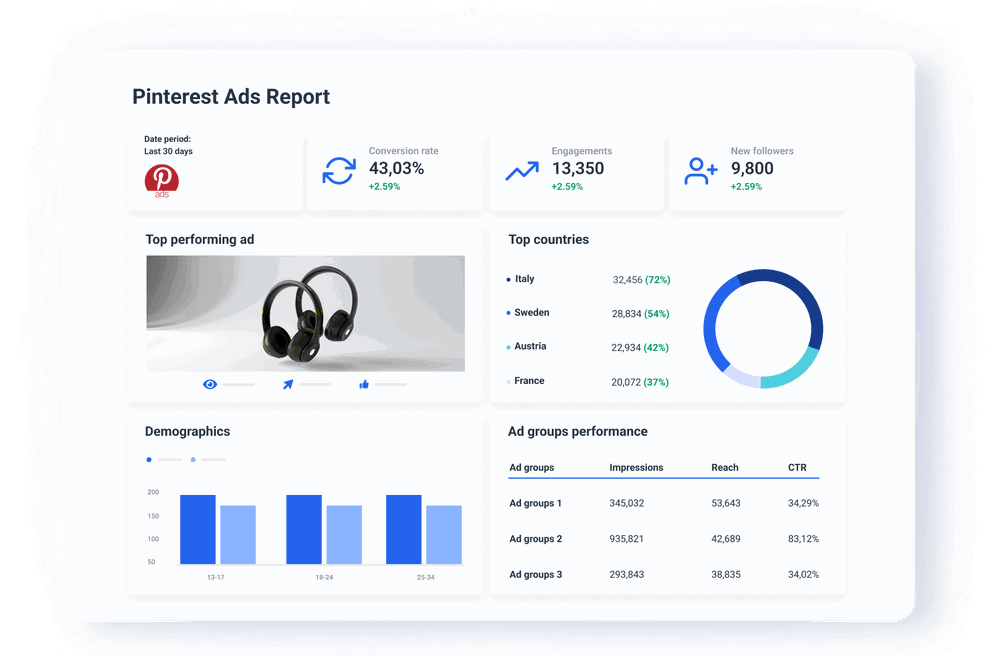
Automatically collect Pinterest Ads performance data for all KPIs
Connect your Pinterest Ads account directly to Whatagraph and automatically pull real-time data to your report. Break down your Pinterest Ads data into more manageable pieces. View individual campaigns, ad groups, specific ads, and demographic metrics to get a clear view of how your PPC strategy is performing. Use our media widgets to understand how Pinners are interacting with your promotional videos. No more sheets, slides, or manual copy-pasting are needed. With our Pinterest Ads report template, you can create amazing client or in-house reports in minutes.
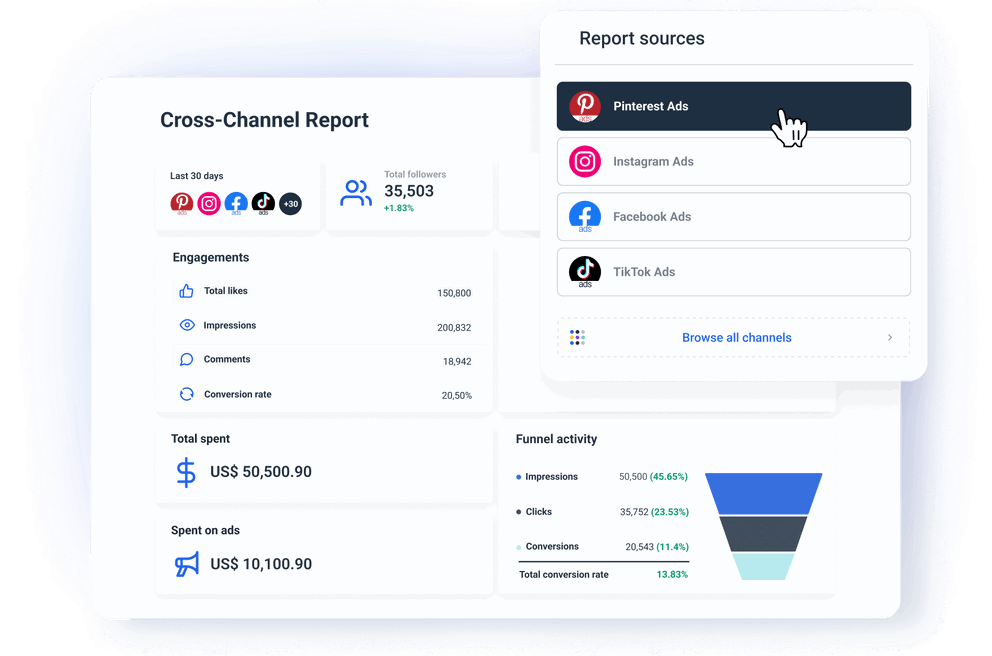
Simplify cross-channel ad reporting
Do your clients advertise on multiple ad platforms in addition to Pinterest Ads? There is no need to make separate reports. In a few clicks, add more sources to any report and easily build a cross-channel report that delivers a comprehensive advertising campaign analysis, not just for Pinterest Ads but other paid marketing platforms, too! Unify dimensions and metrics names from different PPC tools or blend data to organize your report for easier reading. Organize the connected data to aggregate attribution metrics from multiple Pinterest ads campaigns.
Save time with report automation and live links
Schedule your reports to be delivered whenever it suits your clients - daily, weekly, or monthly. Keep everyone in the loop with their Pinterest performance by sending them timely client reports on autopilot. This way, you can focus on driving revenue and value to your clients while they can focus on timely and accurate decision-making. Share a link to a live Pinterest Ads report so clients and stakeholders can check their data whenever they want, even change the date range to see how metrics have changed. Need to analyze any specific KPIs? Export any widget or whole report in a spreadsheet format.

It’s good to be loved! Our clients are not shy about expressing it.
I made a switch from GDS and Sheets for reporting to Whatagraph, and I am saving literal hours each week on performance report creation. Our small firm actually managed to onboard 2 new clients as a result of all the time we saved on managing data and reporting. The customer service is also really helpful and easy to reach.

Capterra verified review by
Mindaugas S., Marketing Consultant
Having active customer support to help fix any issues was a big contributor, but we also really liked the ability to save templates and connect sources to multiple charts/widgets at once without having to edit them individually. And having the grid layout is much easier to stay consistent with than the free form setup that Data Studio has.

Capterra verified review by
Nico T., Media Planner
The system has standard templates that are easy and fast to use. Also you can build your own report with lightning speed. It is very easy to use, has a lot of integration, and let get started very fast.

Capterra verified review by
Rasmus Bernt K., External Senior Management Consultant
We love Whatagraph - we would definitely recommend and our account manager is great! I love how easy this tool is to use, everyone on the team finds it much more user-friendly than other dashboards. Integration was easy, we sent some example reports to the team who duplicated these for us. We literally had to log in and send it to our clients!

Capterra verified review by
Stephanie S., Digital Director
We are showing our clients the work that we're doing for them and this is incredibly important for our clients ROI. They want to see results and having a tool like Whatagraph that can show data from virtually every source we use is hugely important.

Capterra verified review by
John S., SEO Strategist
The tool is easy to use; you do not need to have development resources. Even my junior project managers are capable of making campaign reports in minutes. There are a lot of pre-made templates you can use as well as many pre-made widgets.

Capterra verified review by
Erman E., Marketing Specialist
Really easy to connect data sources within the tool. The library of report templates has been helpful. The customer support team has been responsive to all of our needs. Our team enjoys the simplicity of setting up the reports and how the data is presented.

Capterra verified review by
Brent N., Director of Operations
Easy to create really beautiful graphs and reports which can help other team members to understand the most important takeaways. I especially like the automated report function, so I don't have to check on the same thing repeatedly.

Capterra verified review by
Orsolya S., Online Marketing Manager
All reporting features your agency needs


Build insightful Pinterest Ads reports in minutes
Pick from over 170 Pinterest Ads metrics and create standalone Pinterest Ads reports or easily combine data from different integrations and build cross-channel reports in our Pinterest Ads reporting software.
Explore marketing automation and custom report features


Frequently Asked Questions
How to report Pinterest ads?
You can report Pinterest ads by using the platform’s native reports. To access those, you need to:
1. Log into your Pinterest business account
2. Click the hamburger icon at the top-left of the page
3. Under Ads, click Reporting
These reports summarize how your ad campaigns are performing based on your objective, spend, Pin clicks, and more. You can apply different filters to customize your data.
This way of tracking ad spend is good for freelancers and startups with a handful of campaigns. However, if you want to organize your data, include campaign results from other PPC platforms, or scale up to tracking and reporting on hundreds of accounts in a month, you need a Pinterest Ads reporting platform like Whatagraph that allows you to quickly create custom reports with multi-channel data while saving you time and automating most of the process.
What is a Pinterest Ads reporting tool?
Pinterest Ads reporting tool is a marketing reporting software or data platform that allows marketers to track the performance of their Pinterest paid ads by tracking metrics such as ad spend, cost-per-click, click-through rate, and conversion rate. A Pinterest Ads reporting platform should make the whole data collection, visualization, and report-sharing process seamless while also offering user-friendly cross-channel and advanced analytics capabilities.
What Pinterest Ads metrics should I focus on?
By focusing on the right metrics, you can gain insights into your campaign's performance, optimize your ad strategies, and ultimately achieve better results on Pinterest. These metrics are:
1. Total Impressions: Indicate the reach of your campaign. High impressions suggest that your ads are being seen by a broad audience.
2. Pin Clicks: Show how engaging your ad is and if it compels users to take action. High click numbers indicate effective ad creative and targeting.
3. Click-Through Rate (CTR): Measures the effectiveness of your ad in generating interest. A higher CTR suggests that your ad resonates well with the audience.
4. Engagement Rate: Provides a comprehensive view of how users interact with your ad. A high engagement rate signifies strong ad performance.
5. Cost Per Click (CPC): Helps you understand the cost-effectiveness of your campaign. Lower CPC indicates that you are getting more clicks for your budget.
6. Cost Per Thousand Impressions (CPM): Useful for brand awareness campaigns. It helps in assessing how efficiently you are reaching a large audience.
7. Outbound clicks: Show how effective your ad is in driving traffic from Pinterest to your website. High outbound clicks suggest that your ad content is compelling enough to encourage users to leave Pinterest and visit your site.
8. Conversion Rate: Critical for evaluating the success of your ad in driving meaningful actions. A high conversion rate indicates that your ad is effective in achieving its objectives.
9. Total Conversion Value: Measures the return on investment (ROI) of your ad spend. Higher conversion value indicates a more profitable campaign.
10. Return on Ad Spend (ROAS): Provides a clear picture of your campaign's profitability. A higher ROAS indicates better financial performance.
11. Audience Insights: Helps refine targeting and understand who is engaging with your content, allowing for better optimization of future campaigns.
12. Video Completion Rate: Important for video ads, as it indicates how engaging your video content is.
How many Pinterest Ads sample reports can I create with Whatagraph?
With any Whatagraph plan, you can create as many Pinterest Ads sample reports as you like. You can also save whole reports, parts of reports, or individual widgets as templates for future use, saving you considerable time.
What other marketing channels can I connect with Whatagraph?
Apart from Pinterest Ads, you can connect all popular PPCs like LinkedIn Ads and Google Ads, social media such as LinkedIn, Instagram, and Twitter, e-commerce platforms like Shopify and WooCommerce, SEO tools like Ahrefs, Semrush, and Google My Business, email marketing tools like Klaviyo and Mailchimp, Google Analytics 4, and CRMs like HubSpot and Salesforce.
If you can’t find the integration for your marketing data source, connect it via a Custom API or export it to Google Sheets docs or BigQuery data warehouse and add it as a source.