


TL:DR
Klipfolio is a business intelligence (BI) platform that allows marketing teams and agencies to track KPIs and visualize data through customizable dashboards.
Who it’s best for:
Technical internal teams or data-savvy agencies needing deep customization, frequent internal KPI monitoring, and who are comfortable investing time in building dashboards manually.
Key features at a glance:
| Feature | Klipfolio |
| Integrations | ~140+ integrations |
| Stable connections | Mixed reviews; many users report connections not working reliably |
| Ease of use | Steep learning curve; technical setup required for custom metrics or dashboards |
| Data blending | Possible but requires manual setup and technical know-how (coding/SQL) |
| Internal dashboards | Customizable with "Klips" (widgets), but editing flow is clunky (separate editor) and templates are limited |
| Customizable reports | Highly customizable within the Klips editor, but complex for combining multiple data sources |
| Report sharing & automation | Offers email, internal link, public link, and PDF/image downloads; email scheduling available |
| Security | TLS 1.2 encryption, GDPR compliant, role-based access controls, SSO available on pricier plans |
Pros ✅
- Supports many data sources (140+ integrations)
- Customizable charts for visualizing data
- Easy dashboard sharing
- Drag-and-drop customization (once "Klips" are created)
Cons ❌
- Time-consuming to build dashboards
- Slow to load, especially with complex tasks or large datasets
- Sub-par customer support for most plans
- Limited pre-built templates
- No batch editing for reports
- Lack of AI features for insights or summaries
Klipfolio Pricing
Let’s start with the pricing. The Klipfolio pricing plans are divided into two main categories: Business plans and Agency plans.
To help you understand both of them, we’ve explained them below.
Klipfolio Business Plans
The Business plans are mainly for internal teams who want to track their team’s KPIs.
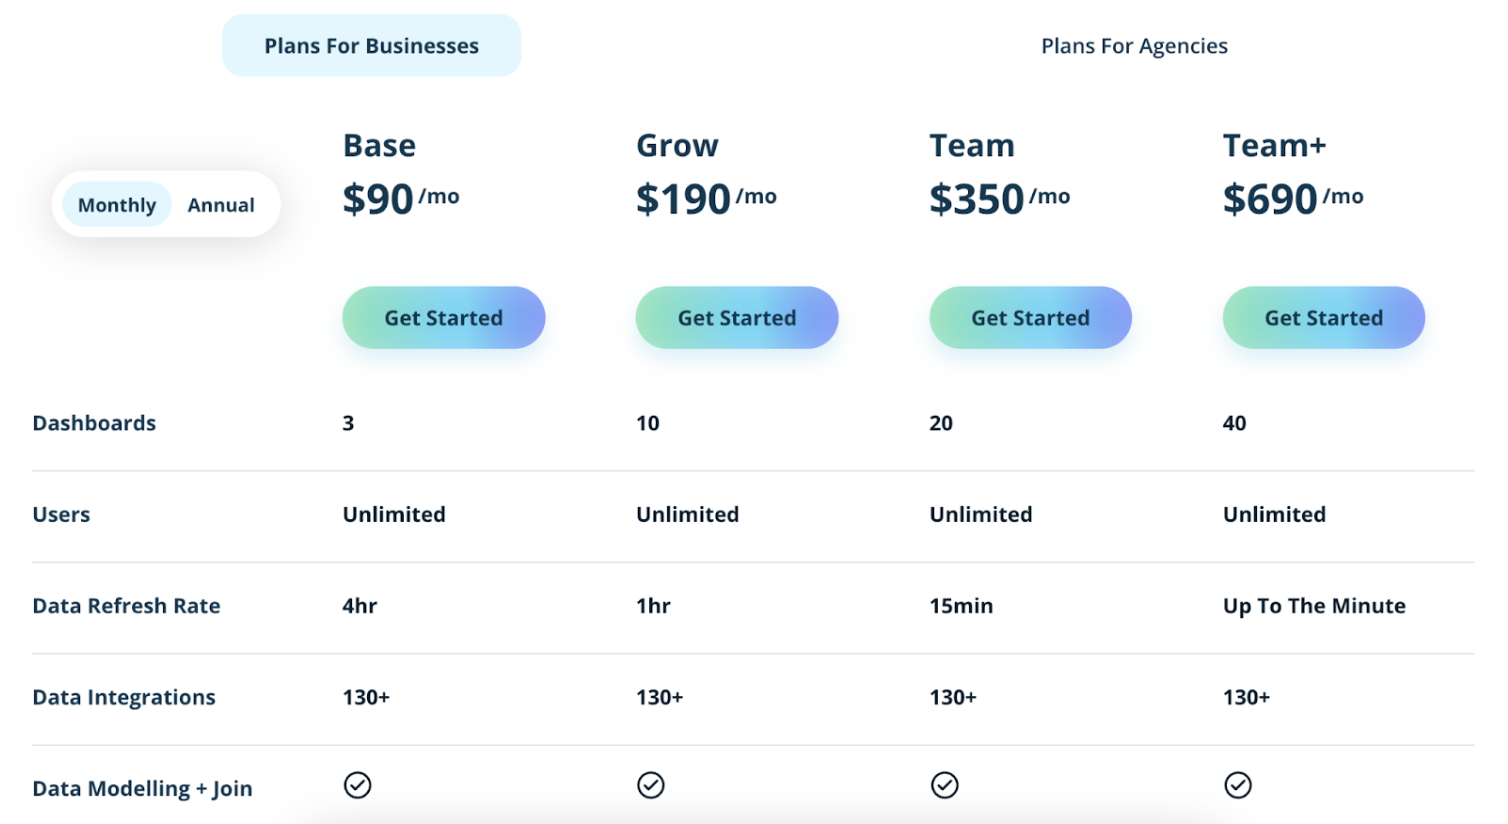
For a detailed look at the Business plans, we’ve created an overview table below:
| Plan | Price | Included Dashboards | What’s Included |
| Base | $90/month, or $80/month annually | 3 |
|
| Grow | $190/month, or $170/month annually | 10 |
|
| Team | $350/month, or $310/month annually | 20 |
|
| Team+ | $690/month, or $600/month annually | 40 |
|
Klipfolio Agency Plans
Klipfolio’s Agency plans are similar to the Business plans, but each plan also has a limit for the number of clients you can manage. 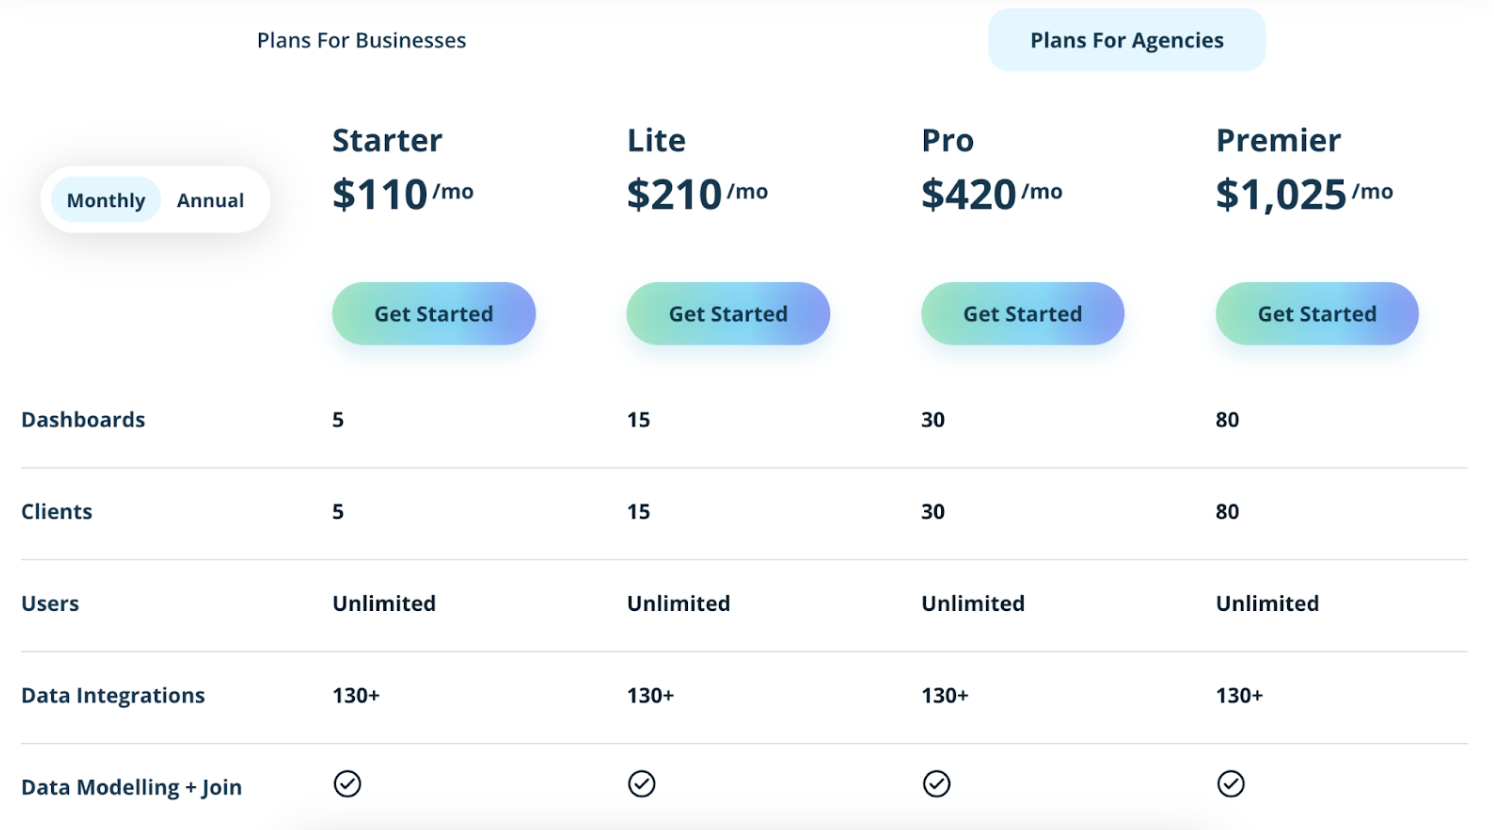
As we did for the Business plans, here’s an overview of the Agency plans:
| Plan | Price | Included Dashboards | Included Clients | What’s Included |
| Starter | $110/month, or $100/month annually | 5 | 5 |
|
| Lite | $210/month, or $195/month annually | 15 | 15 |
|
| Pro | $420/month, or $380/month annually | 30 | 30 |
|
| Premier | $1,025/month, or $900/month annually | 80 | 80 |
|
Heads-up: As you onboard more clients, the cost increases quickly. A 30+ client agency could easily pay $1000-2000+/mo.
Key takeaways for your budget
1. Pricing structure
Each Klipfolio plan contains a set amount of dashboards and clients you can create/manage.
If you exceed your plan's client limit, you need to upgrade to a higher plan, which can 2-3x the price quickly. Each extra dashboard also costs an extra $8/month.
2. Add-on costs
Outside of the general pricing plans, there are different add-ons for an additional monthly/annual cost. The add-ons are:
- Dashboard top-ups ($8/month) — Add more dashboards for visualizing data.
- Near real-time data refresh ($139/month) — Get into a dedicated queue for near real-time data refreshes.
- Performance tuning ($220/month) — Use Klipfolio’s experts to ensure your performance settings are right.
- Large data processing (Custom quotation) — Work with larger data sets up to 15MB or 25MB.
- Warm up refresh ($39/month) — Specify time once per day to refresh all data sources.
- Branding+ ($199/month) — White-label your reports by changing key terminology.
- SSL domain alias ($69/month) — Use a custom domain for your reports.
- Custom theme ($69/month) — Customize Klipfolio’s theme with custom CSS and JavaScript.
Some of these add-ons are included in the Agency plans by default. For example, Branding+ and custom themes are available in the Pro plan ($420/month).
If you’re an agency owner, you’d still most likely want real-time data refreshes, large data processing, and dashboard top-ups, which can drive up the cost significantly.
Real User Reviews: What are Customers Saying About Klipfolio?
To get an honest view of Klipfolio, we dug into its user reviews. We looked at reviews from platforms like G2, Capterra, and Reddit to see what other users like about the platform (and what could be better).
| Overall G2 Klipfolio rating | 4.5/5 (250+ reviews) |
| Overall Capterra Klipfolio rating | 4.7/5 (190+ reviews) |
Klipfolio pros: What Users Love
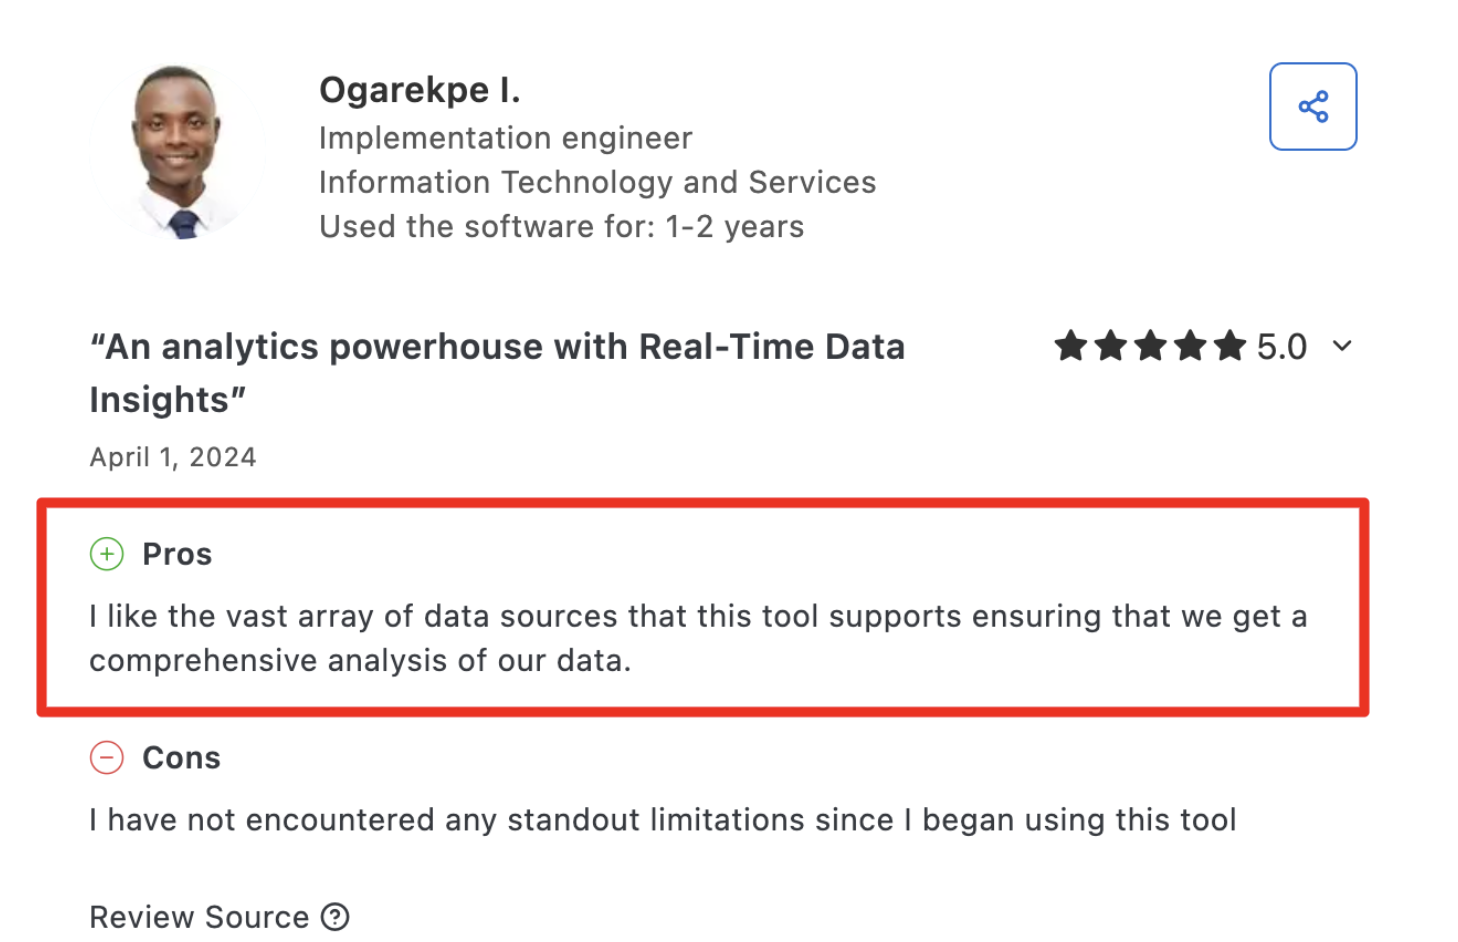
✅ Supports many data sources
Users frequently praised this. Klipfolio integrates with 100+ third-party platforms for data importing. Users like Ogarekpe L. say, “This helps to get a comprehensive analysis of data.”
✅ Charts for visualizing data
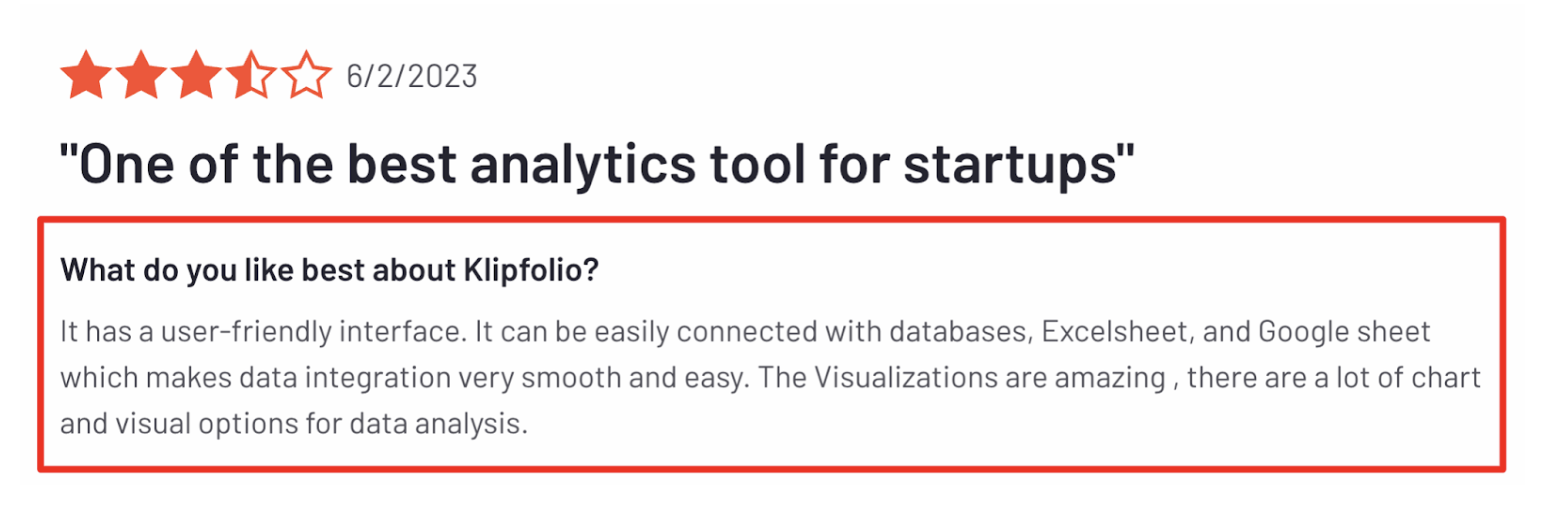
Klipfolio has different charts that help to display data. One G2 user said, “The visualizations are amazing. There are a lot of charts and visual options for data analysis."
✅ Easy dashboard sharing
Klipfolio offers a few different ways to share dashboards, which users appreciate. You can create links, share via email, or give internal access to team members.
✅ Drag-and-drop customization
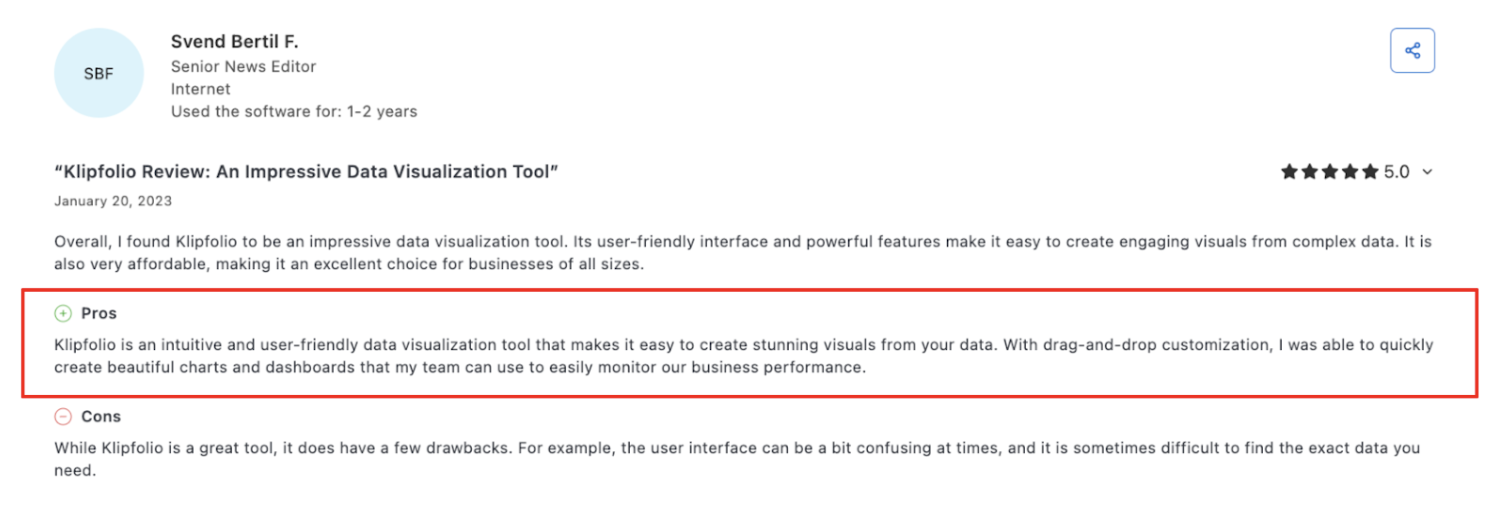
After creating your “Klips” (similar to widgets), you can drag and drop them into your dashboard. Klipfolio user Svend Bertil F. said, “The drag-and-drop editor helped to create charts and dashboards quickly.”
 ✅ Track KPIs
This is one of Klipfolio's main value propositions: businesses can track KPIs for different departments internally, which users say works great.
With that said… Let’s look at Klipfolio review complaints—areas where users got frustrated.
Klipfolio cons: Where Users Get Frustrated
⚠️ Hard to configure
The biggest Klipfolio feedback was that it’s hard to configure. If you want to build custom connections, you'll need to work with code and SQL queries, which is time-consuming and too advanced for most.
Many Klipfolio users who want to create custom dashboards have to end up hiring a data scientist—adding to the total cost.
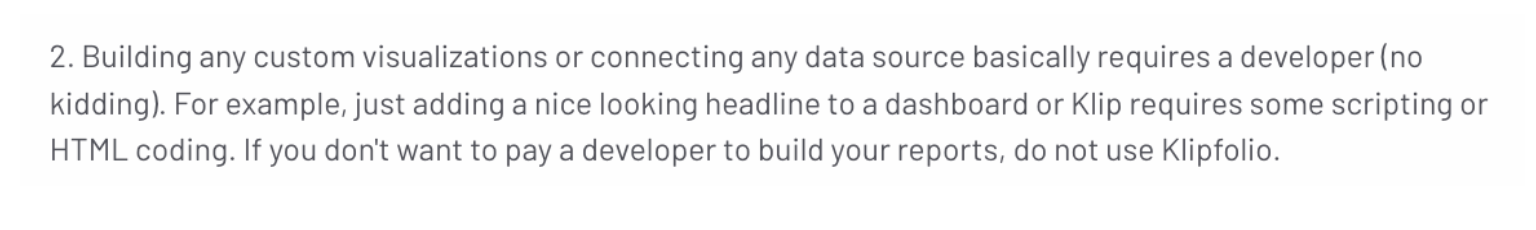
One G2 user was frustrated about this and said, “Building any custom visualizations or connecting any data source basically requires a developer (no kidding).”
 ⚠️ Time-consuming
Klipfolio has a drag-and-drop editor for building dashboards, but before that, you need to create Klips on a separate page.
Depending on the type of Klip you create, this process can take anywhere from 5 minutes to 1 hour. And then, you’ll most likely need multiple Klips, which means it can take hours to create a full-blown dashboard.
⚠️ Slow to load
Users like Graham H. say Klipfolio can be slow, particularly when performing more complex tasks. Even less advanced reports with basic visualization can take a long time to load—or load without up-to-date data.
⚠️ Expensive
If you’re an agency needing full white-labeling, custom themes, onboarding support, or single sign-on (SSO), you need the pricier Pro ($420/month) or Premier ($1,025/month) plans.
Not to mention the add-ons, which can easily double the monthly cost.
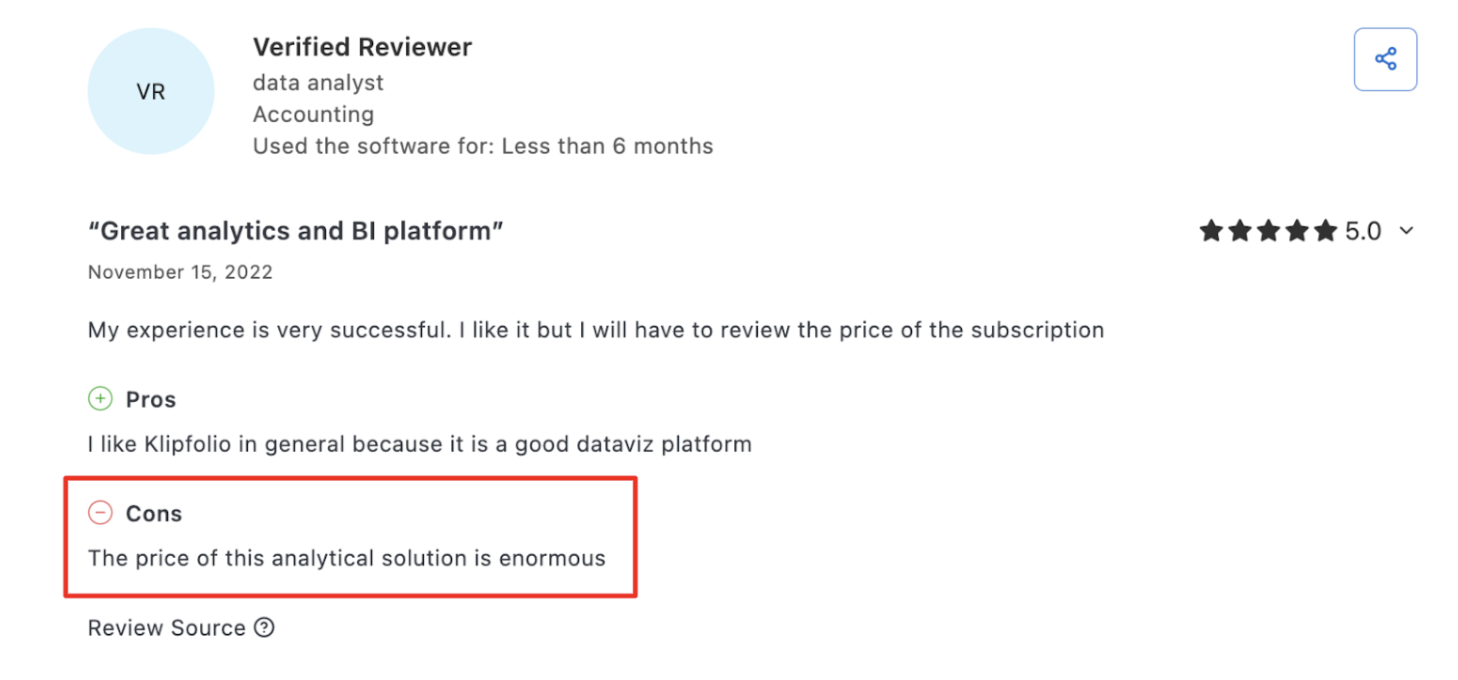
One Capterra user left feedback and simply said, “The price of this analytical solution is enormous.”
⚠️ Sup-bar customer support
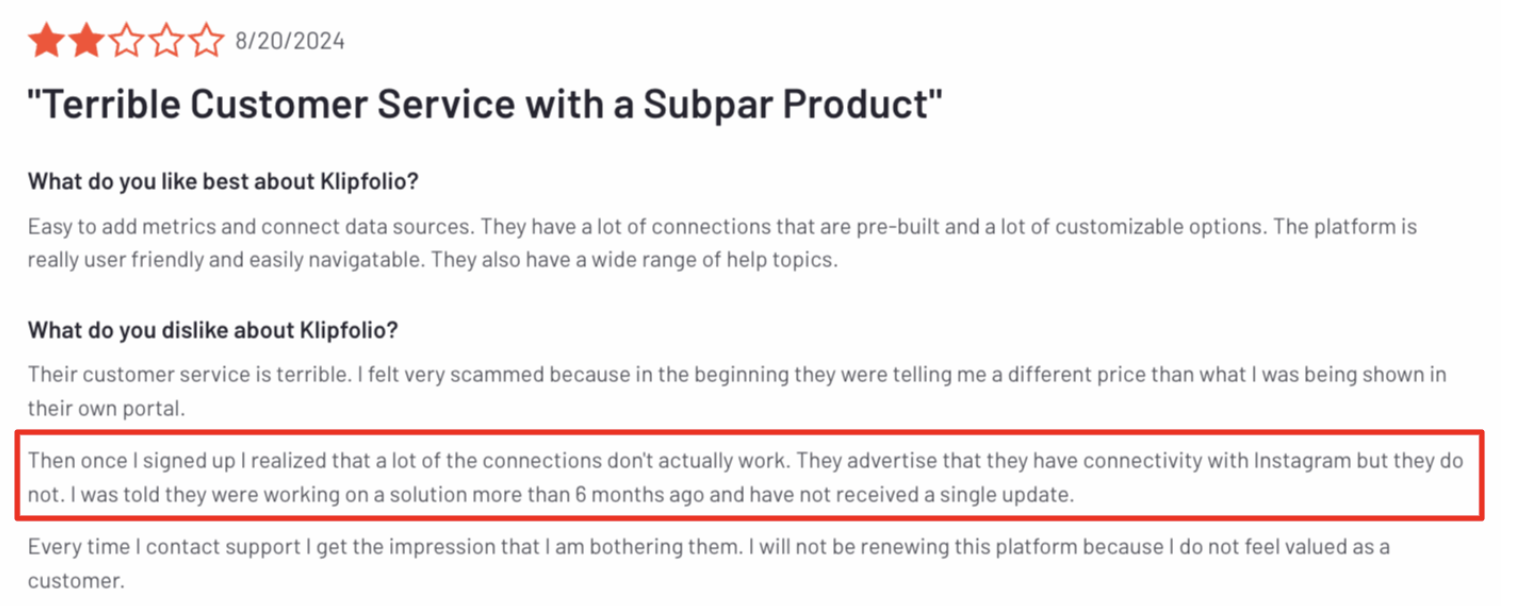
The only way for most users to contact Klipfolio’s support is via email, and even then, users like Jennifer B. say, “the support is terrible”.
The same reviewer mentioned “feeling scammed” because the price Klipfolio told her was different from the one shown in the portal.
Feature Deep Dive #1: Klipfolio Ease of Use
The first thing we wanted to test was Klipfolio’s ease of use. More specifically, how easy is it to create new dashboards, are there templates available, and can you edit dozens of reports quickly?
Are there ready-made templates and widgets available?
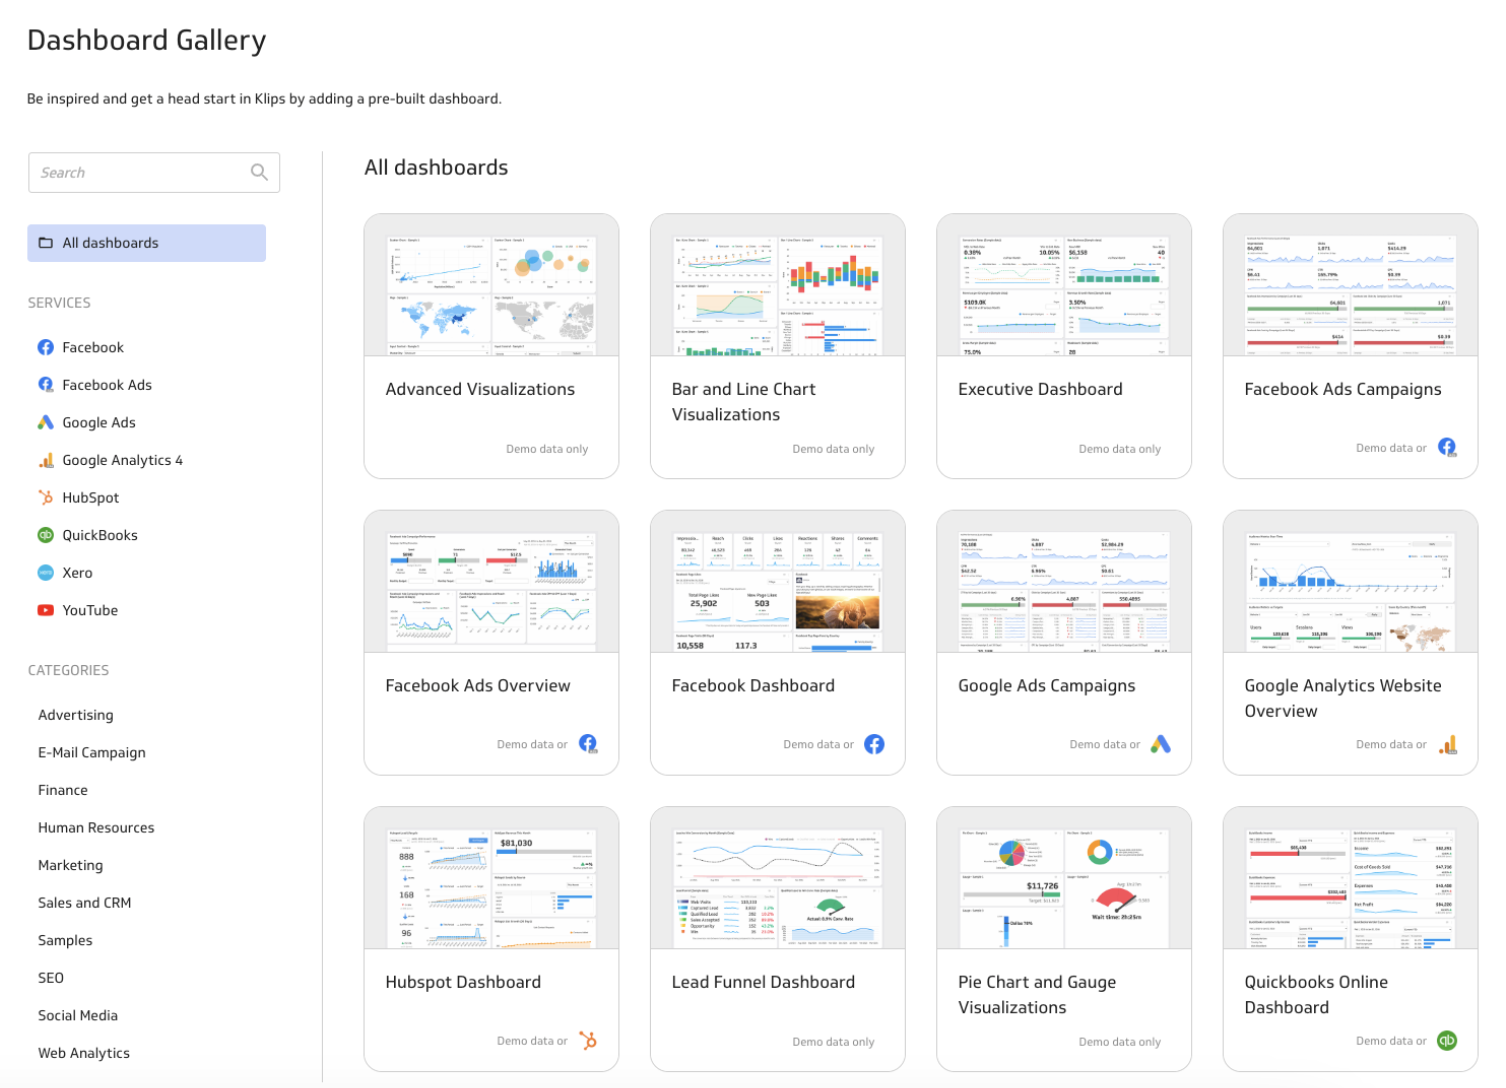
Yes, both ready-made templates and widgets are available. In total, you can find 17 templates from Klipfolio’s dashboard gallery.
 As for widgets, Klipfolio calls them Klips, which there are 1-8 pre-made for each data source.
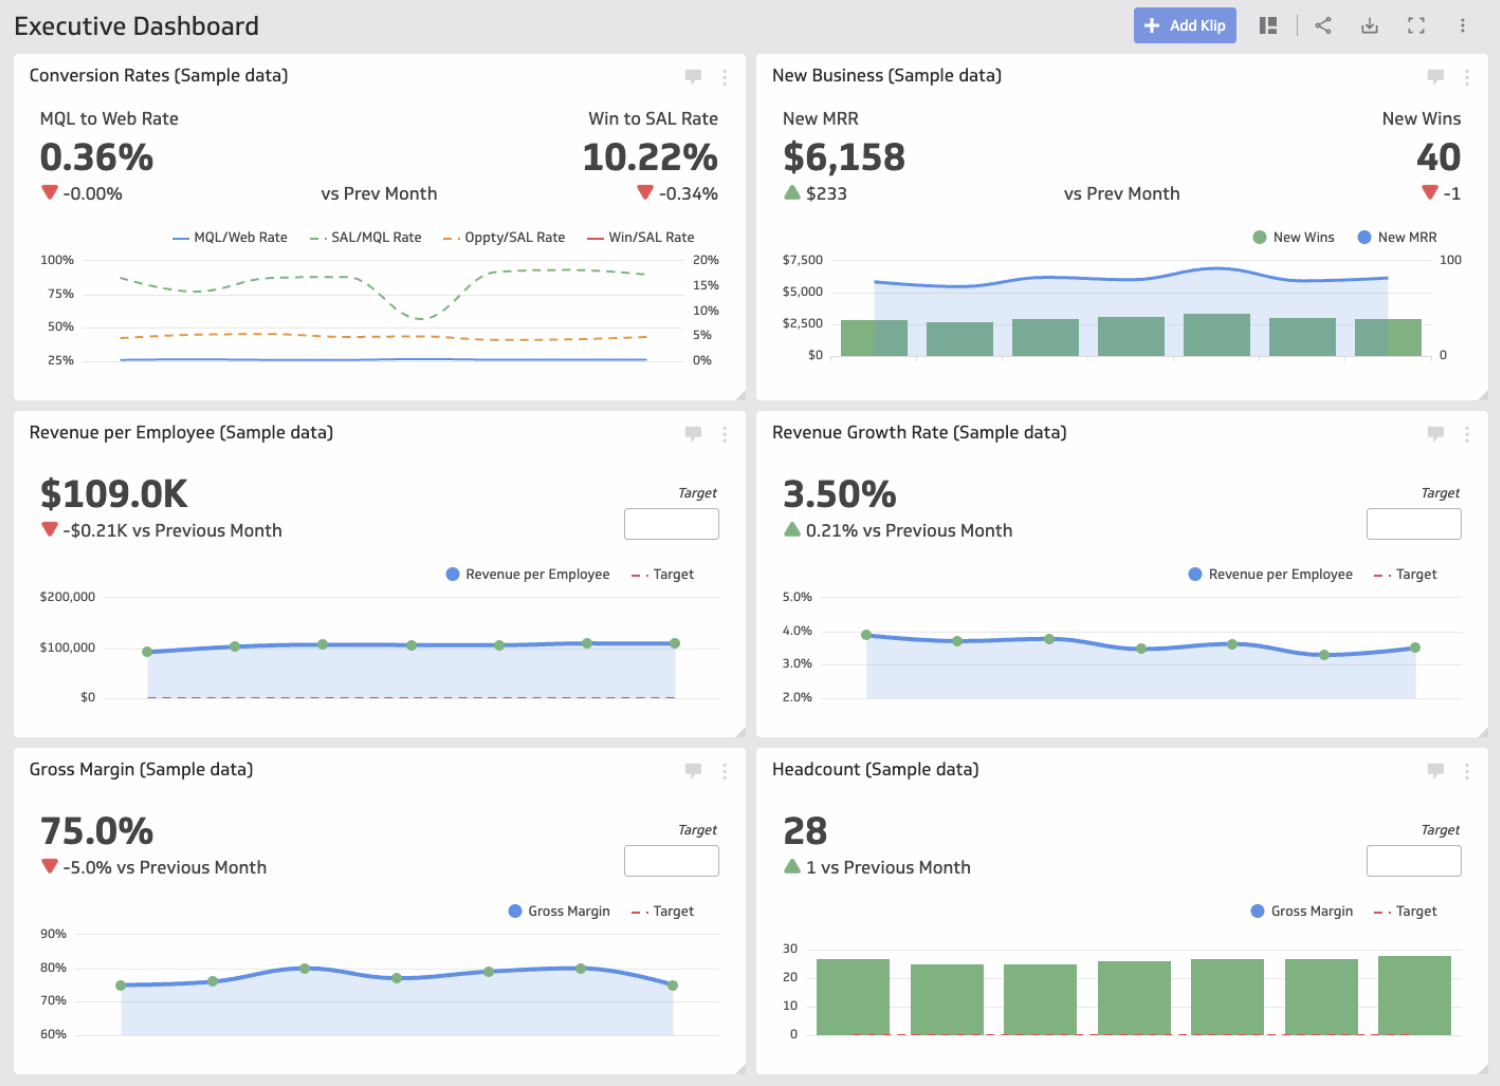
 While the amount of pre-made Klips available is sufficient, 17 dashboard templates simply aren’t enough…especially since one dashboard might contain only 6 Klips, like in the “Executive Dashboard.”
 The lack of detailed templates means you’ll need to spend hours crafting dashboards from an empty page.
Whatagraph solves this with 55+ pre-built templates and 100’s of pre-built widgets for visualizing data. You can find templates for social media, paid ads, email, website performance, and more.
The templates are comprehensive, and you can easily expand on them.
How easy is it to edit dashboards?
Klipfolio’s dashboard builder lets you add and resize Klips, reposition them, add comments, and change the data source or filters.
If you don’t take into account creating the Klips (which can take up to an hour per Klip), doing these simple changes was relatively easy.
One big limitation was that the templates live on a fixed grid, so you can't make precise pixel tweaks. The Klips automatically adjust to the nearest grid size.
How easy and fast is it to edit dozens of reports?
Klipfolio doesn’t have a batch editing feature, meaning you’ll need to edit each report one by one. If you have to tweak 10+ similar reports for clients, this can be very time-consuming to do individually.
On Whatagraph, our reports are “Linked.” This means that any changes you make to the master template will automatically affect all linked reports.
This is especially useful for agencies that need to make small tweaks to 10+ reports and want to save time.
Klipfolio offers basic templates and pre-built Klips, but a limited template selection, fixed grid layout, and lack of linked reports make building multiple dashboards slow.
Feature Deep Dive #2: Klipfolio Integrations
One of Klipfolio's main benefits was its broad integrations with different data sources. And truthfully, we can give them credit for this.
Looking into the integrations library, we found 140+ integrations with platforms in categories like e-commerce, SEO, social media, analytics, customer support, and CRM.
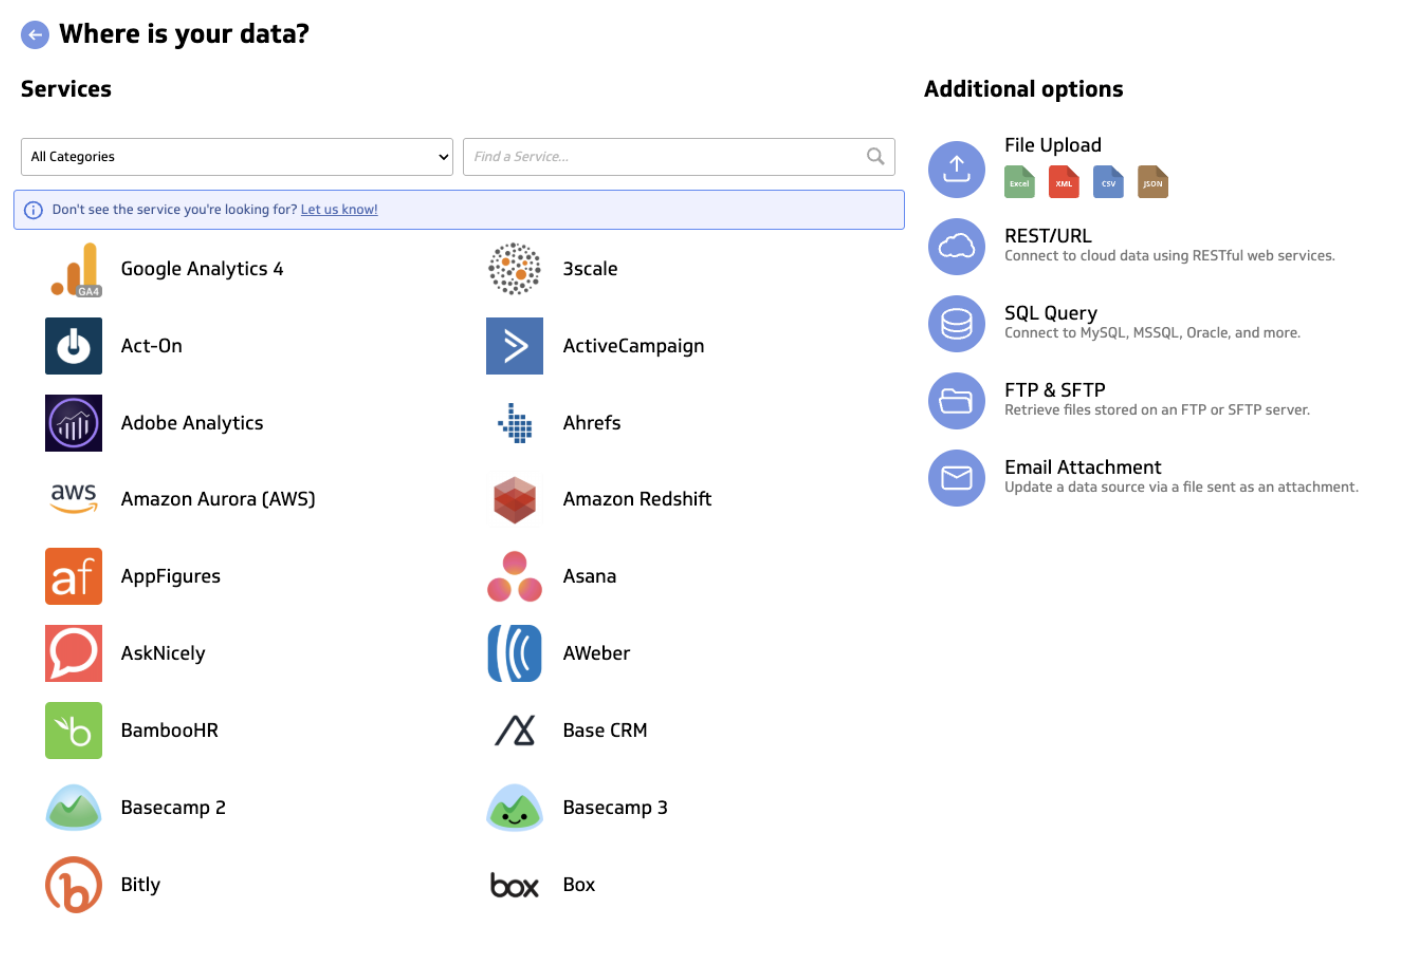 In addition, there is an option to update a data source via a file, REST/URL, SQL queries (e.g., MySQL, Oracle), and FTP/SFTP file retrieval.
Are the integrations reliable?
It’s clear Klipfolio’s integrations are extensive, but how do they perform? And most importantly, is the data reliable?
This is where the feedback gets more mixed, as many users say a lot of the connections don’t actually work.
For example, this is what Jennifer B wrote:
“Then once I signed up, I realized that a lot of the connections don’t actually work.”
When connections are unstable, the data on your reports become unreliable – as they can be either late or inaccurate, and this is a real issue if you’re reporting to clients.
Other users also say the platform “hangs” when analyzing larger sets of data.
Comparatively, Whatagraph solves these problems with fully-managed integrations, meaning they’re more reliable, stable, and much faster. One of our customers says:
We don’t have any connection issues on Whatagraph at all. We just connected the platforms once, and that was it. It's also very quick when loading the data.
You can work with 10+ sources and 100+ widgets simultaneously without slowing down our platform.
We also offer a consistent 30-minute refresh rate across all data sources, blends, and pricing plans. In comparison, the refresh rate for Klipfolio varies from 4 hours to 30 minutes, depending on your plan.
140+ integrations are available, but users have concerns about connections not working, which impacts data accuracy.
Feature Deep Dive #3: Data Blending and Custom Metrics
Klipfolio supports many integrations, but is it possible to blend data from them into custom metrics? We’ll look at this below.
Can you easily blend data or create custom metrics and dimensions?
Klipfolio lets users blend data from multiple sources into unified metrics, but it requires manual setup and technical know-how.
Like we already discussed, the Klips editor has a steep learning curve, which is where you need to create the unified metrics.
Looking into Klipfolio’s Help Center, there is also little to no information on these topics.
For these reasons, creating custom metrics and dimensions is out of reach for most users.
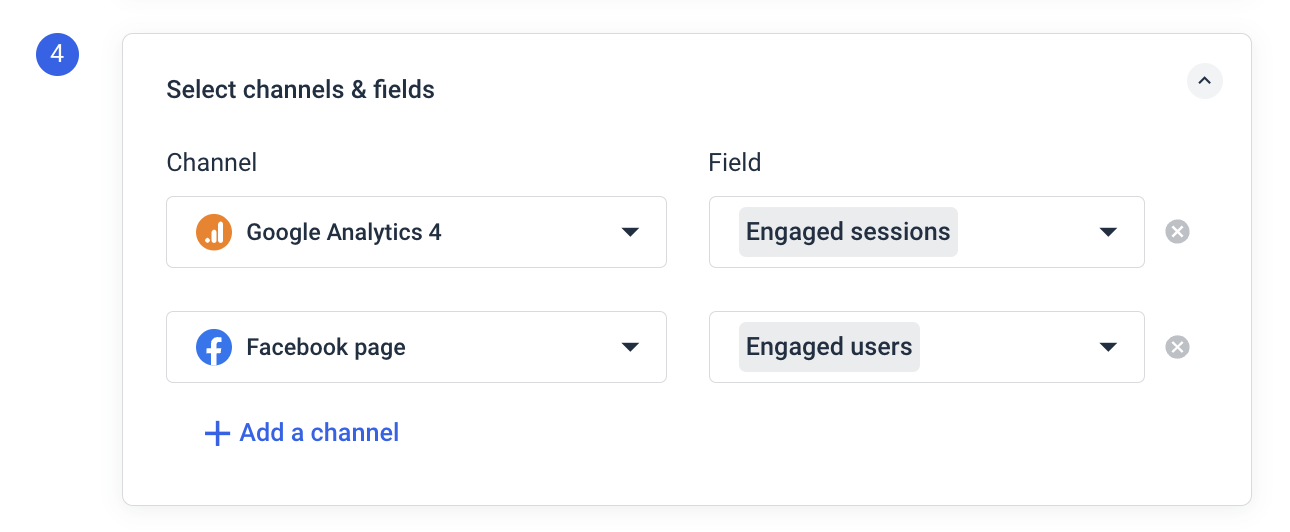
On Whatagraph, you can create custom data blends, widgets, and dimensions with simple workflows that are quick to set up. This is what each of them is useful for:
- Data blends and source groups - Combine data from different sources together and visualize them as one in your reports.
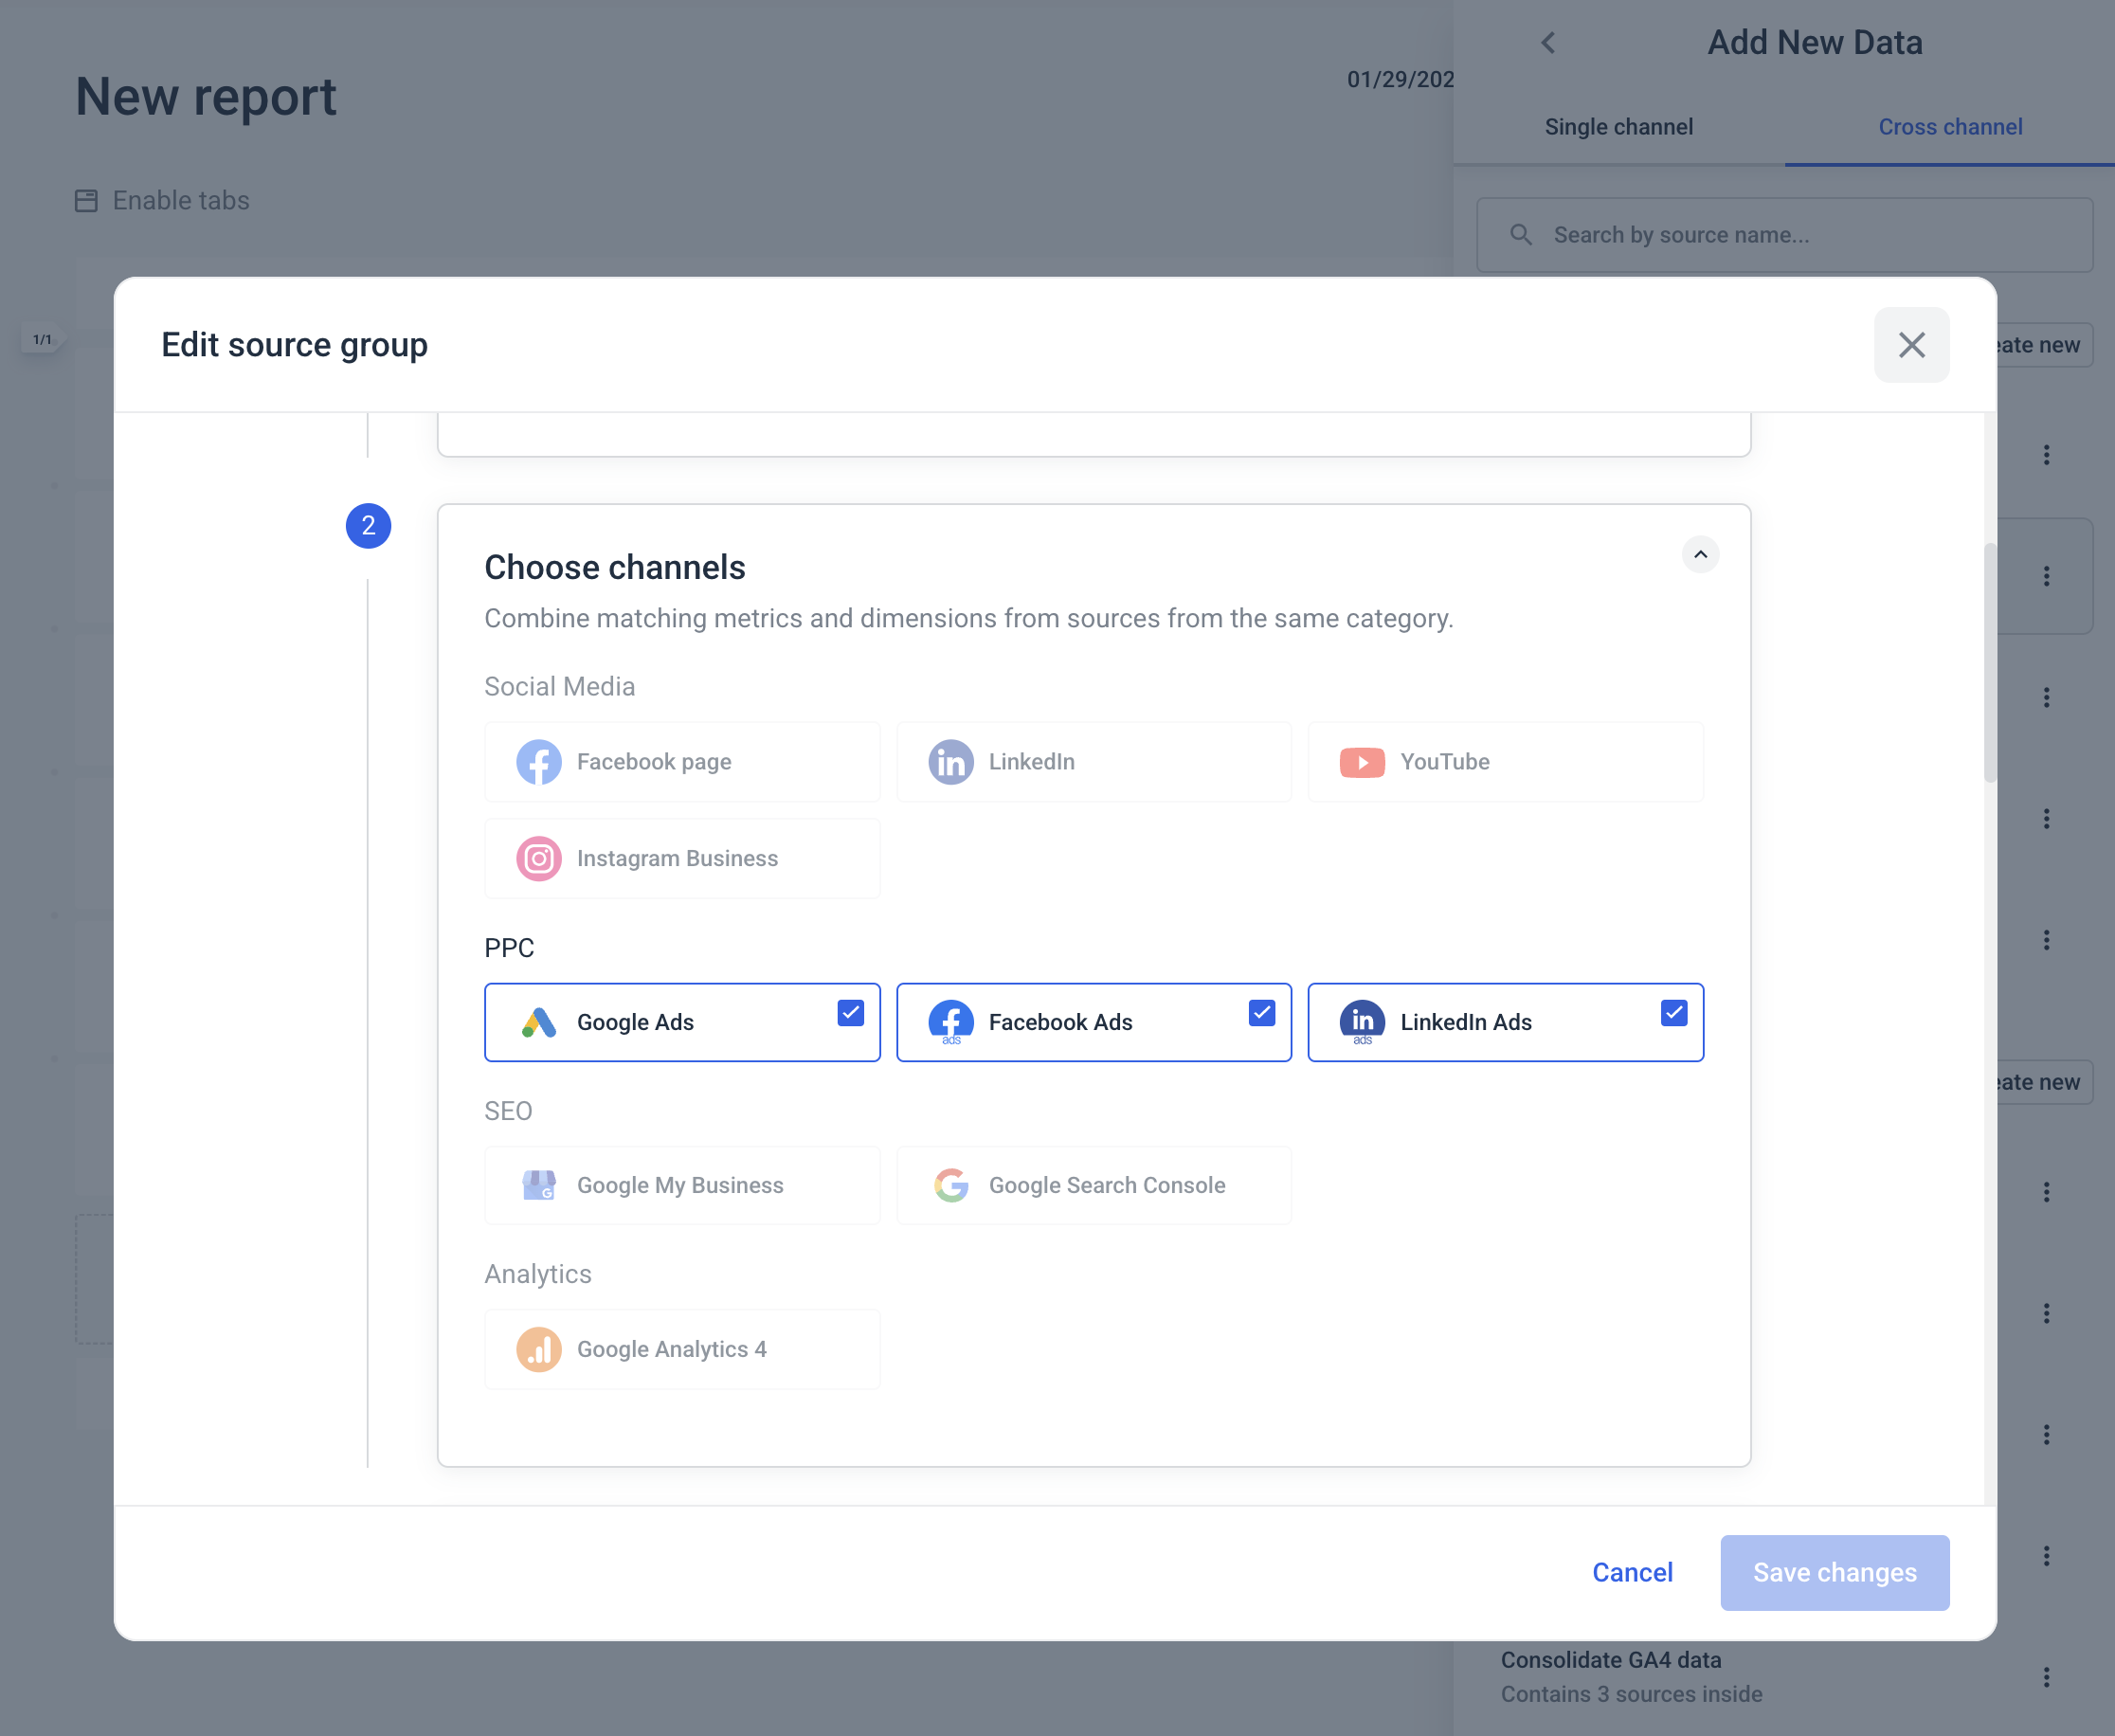
- Custom dimensions - Standardize and group cross-channel dimensions (like age, gender, or device type) and different data points from various integrations.
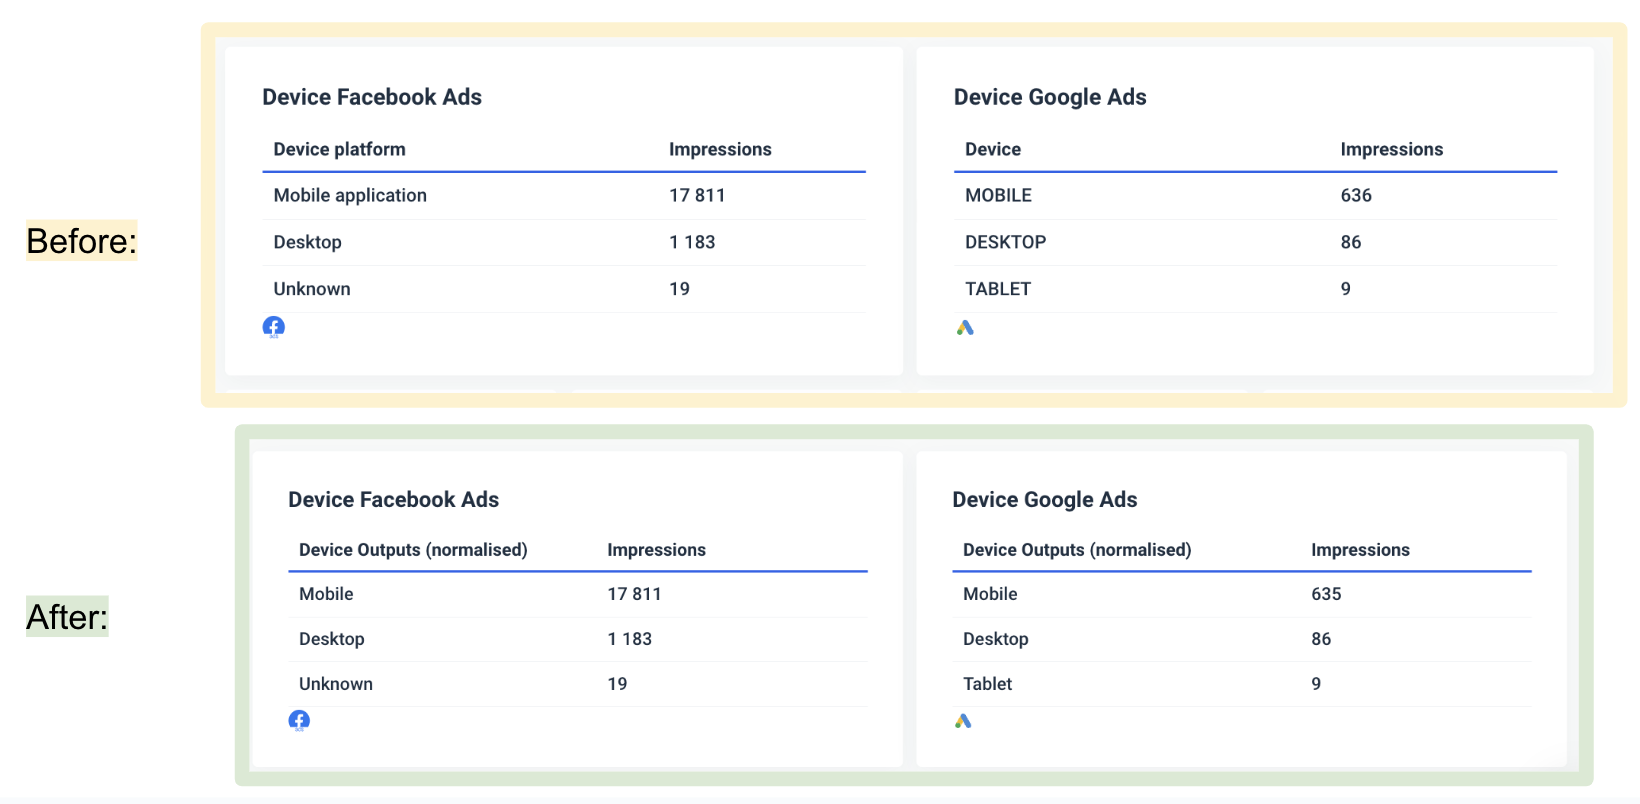
- Custom metrics - Rename metrics permanently or create new ones using simple or advanced formulas. Perfect for showing totals like "Engaged Sessions" from multiple sources.
The great thing is that you can create all of these inside your report. This means there is no need to go back and forth between two workspaces, unlike with Klipfolio.
This easy and granular data blending is what Tanja Keglić, Performance Marketing Manager at Achtzehn Grad, loves about us:
The biggest reason we chose Whatagraph was because of its holistic approach to reporting. We can blend data from different channels and see in one view what's the performance and what needs to be changed.
Read the full case study.
Klipfolio’s Klips editor lets users create unified metrics, but it requires deep technical expertise, which makes them out of reach for most.
Feature Deep Dive #4: Klipfolio Dashboards
Dashboards are the cornerstone of a reporting tool, so we wanted to see how they’re built with Klipfolio, how customizable they are, and whether there are any AI features.
How are the reports built?
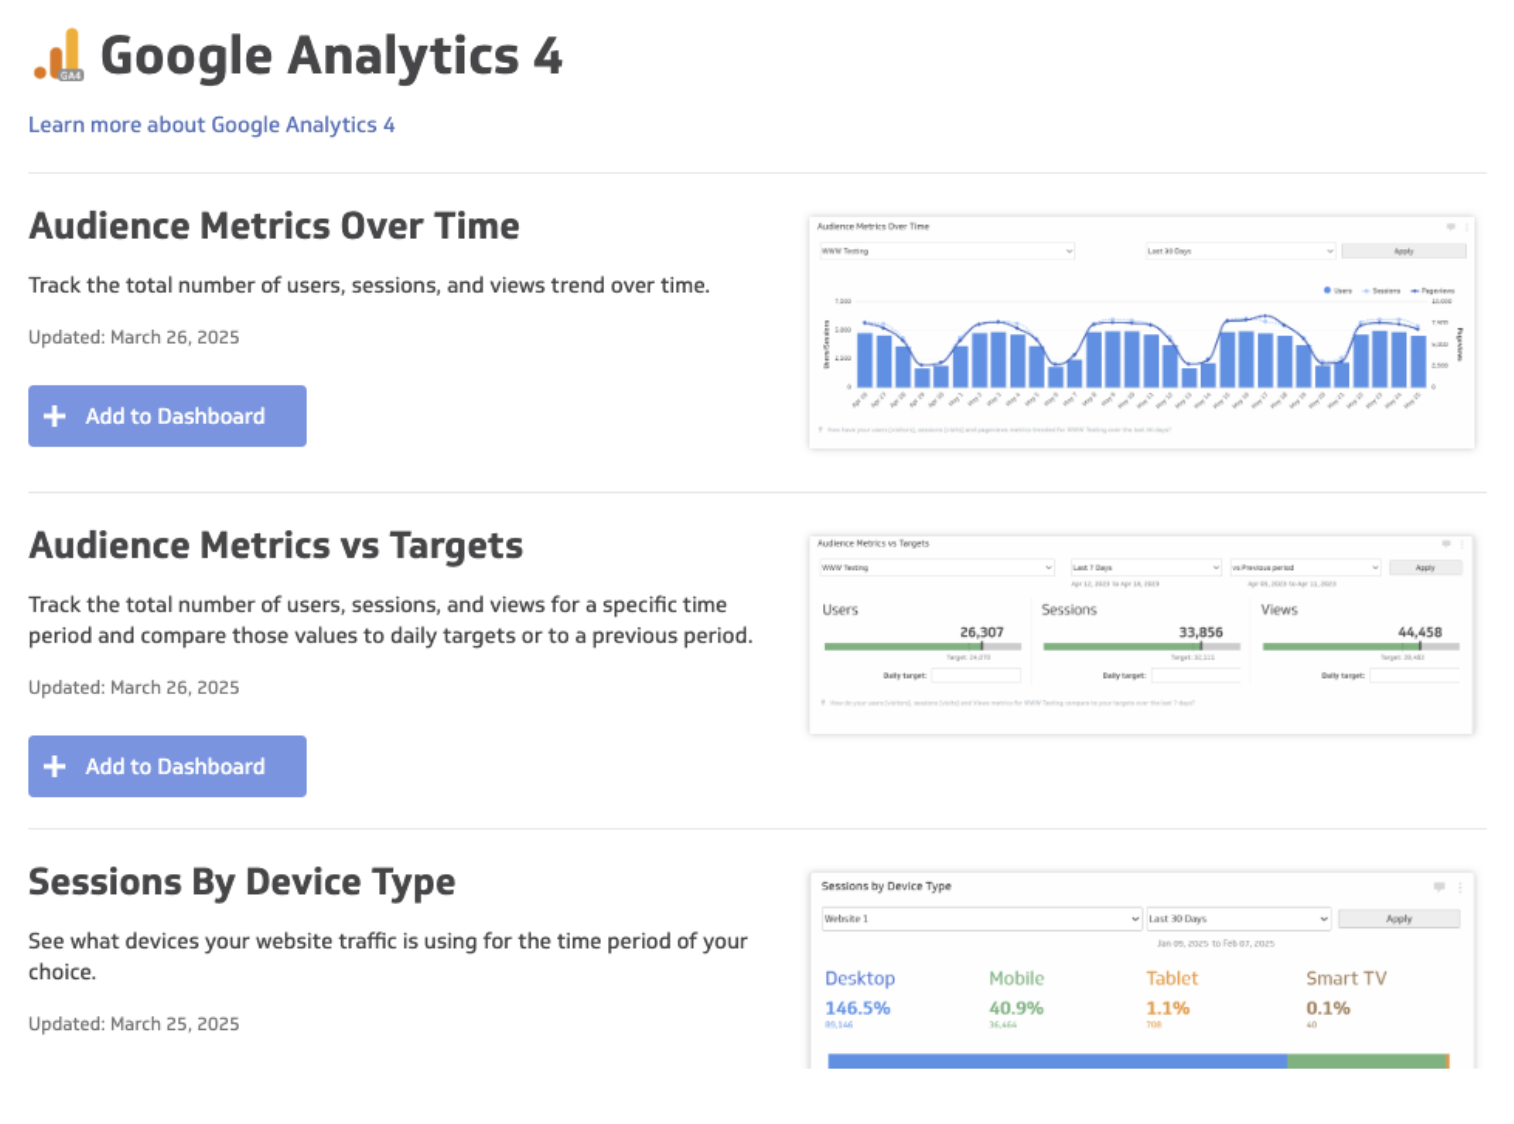
Klipfolio’s reports are built on “Klips,” which are essentially widgets for displaying data. You can create Klips from a dedicated page on the admin dashboard.
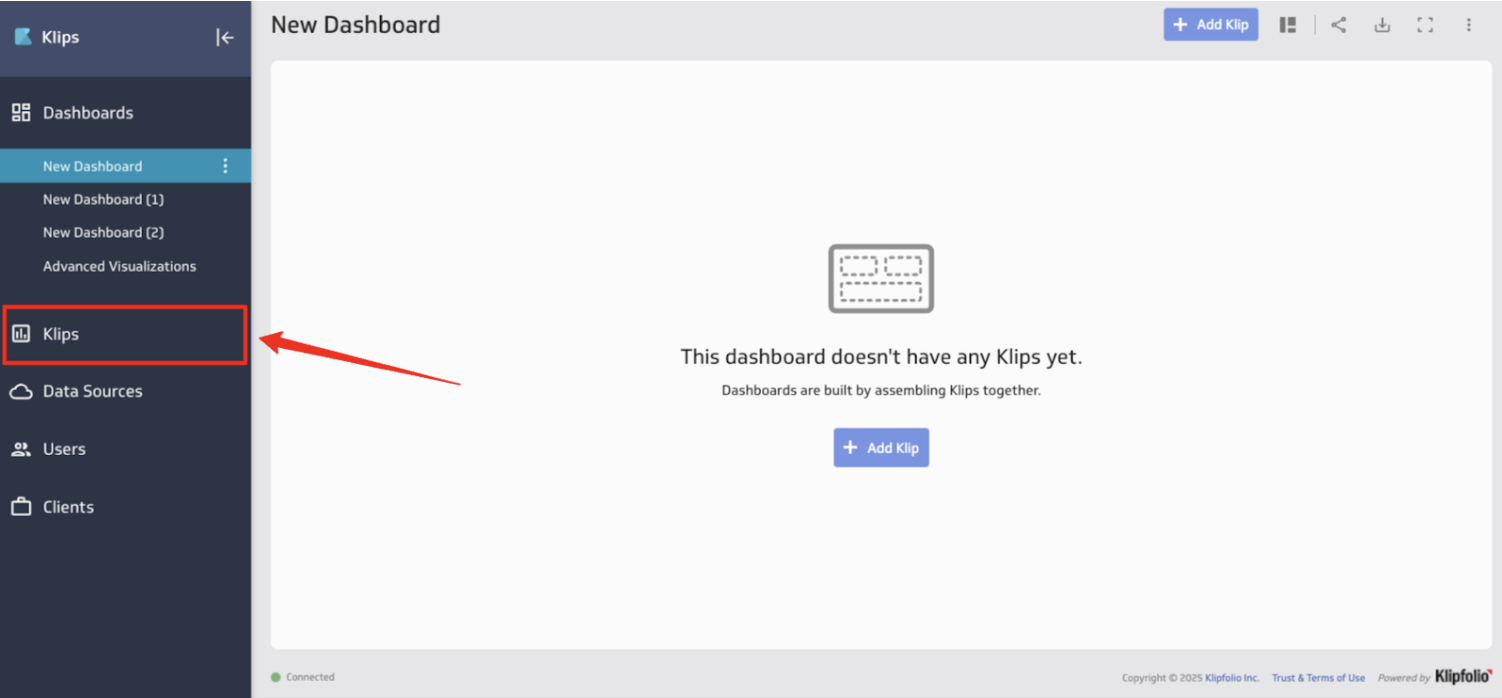
Alternatively, you can add Klips from the dashboard itself by clicking on “Add Klip” and selecting your data source.
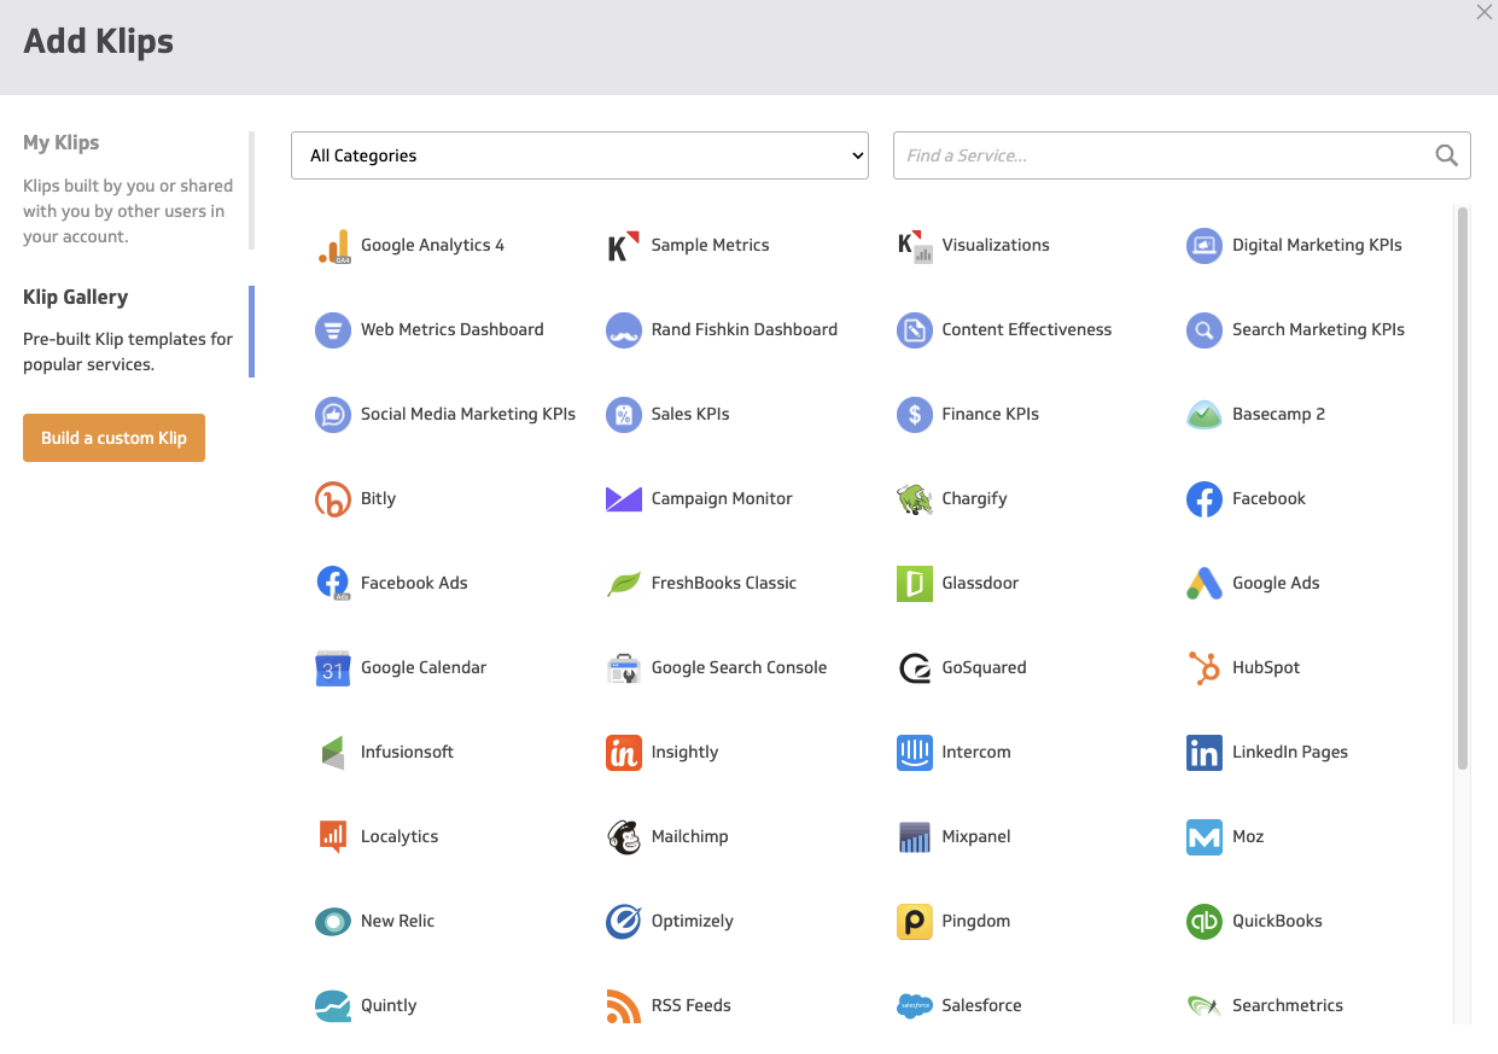
Each data source has 1-8 pre-built Klips to display different metrics. For example, here’s what’s available for Google Analytics 4:
What we found a bit odd is that you can’t edit the Klips within the dashboard editor.
You have to click on “Edit”, and you’ll be moved to a separate page, where you can edit the Klip.
Truthfully, we believe this slows down the process of creating dashboards. Imagine having to do this for 20+ Klips across multiple client accounts…you’d be spending hours, just to create widgets.
Again, Whatagraph offers an easy solution to this problem—you can create new widgets directly from the drag-and-drop editor.
It’s as simple as selecting the right widget and dragging it onto the dashboard:
This means no unnecessary time wasted switching between two interfaces, and no extra cognitive load.
How customizable are the Klips?
This is something we can give Klipfolio credit for: how customizable their Klips are.
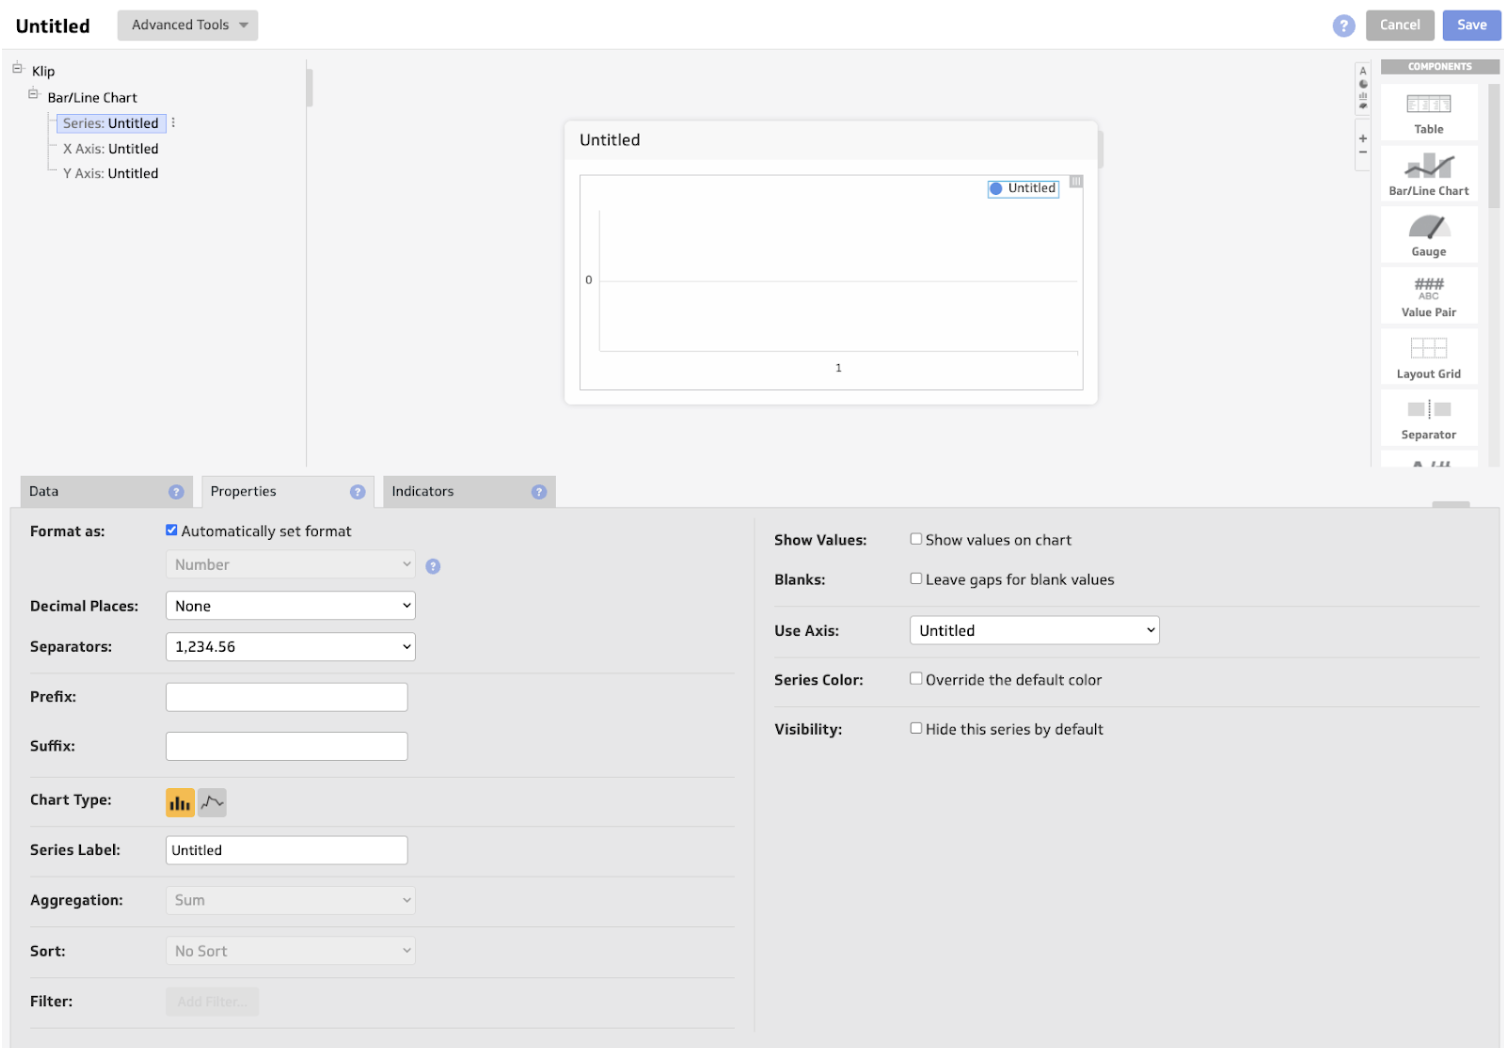
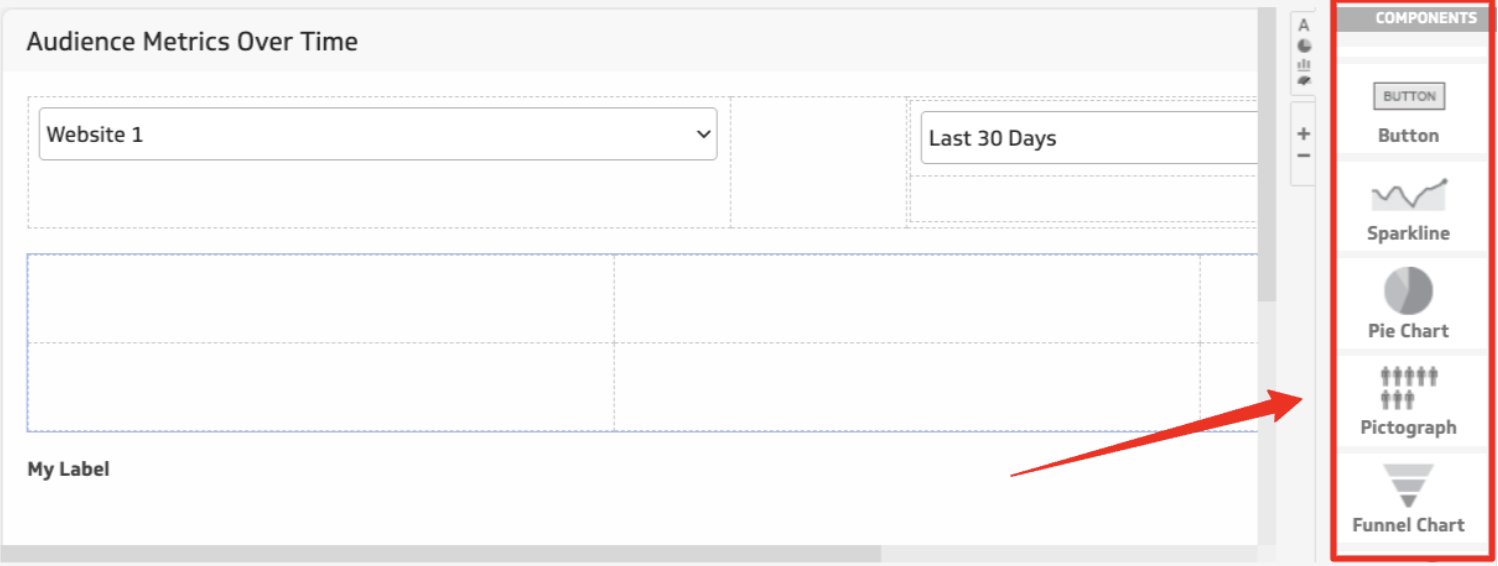
You can make changes to the Klips within the Klips editor, which looks like this:
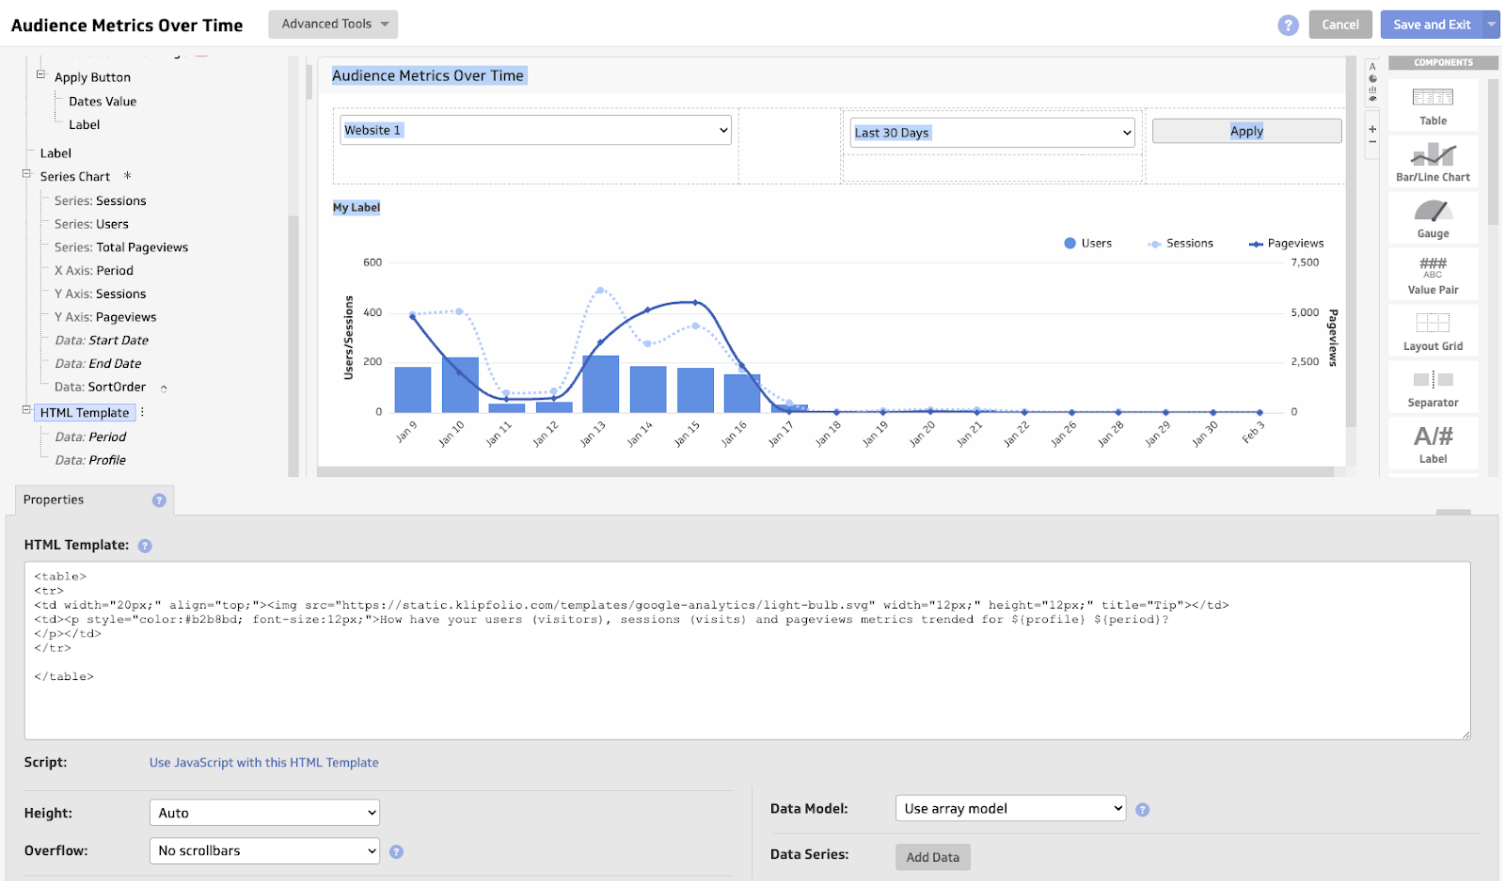
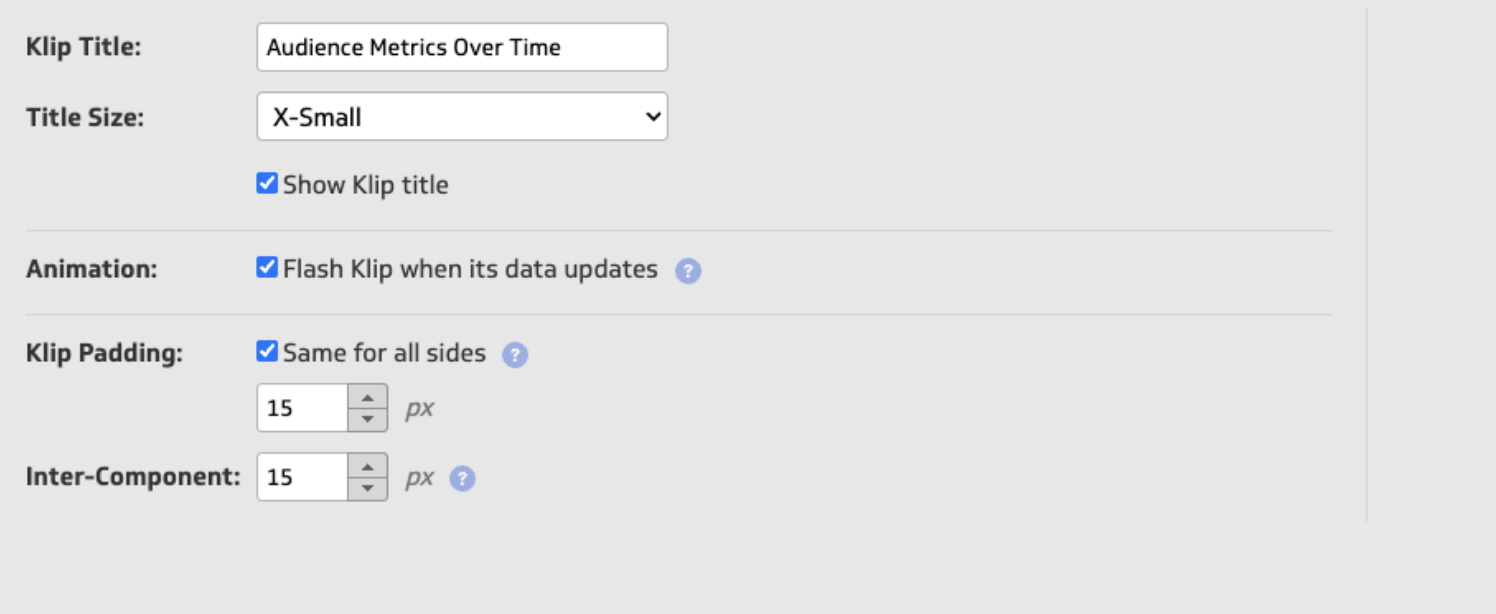
You can modify:
- Data sources - Add one or multiple data sources.

- Chart properties - Modify chart height, adjust legend size, toggle stacking options, enable X-axis zooming, remove blank data series, and invert axes as needed.
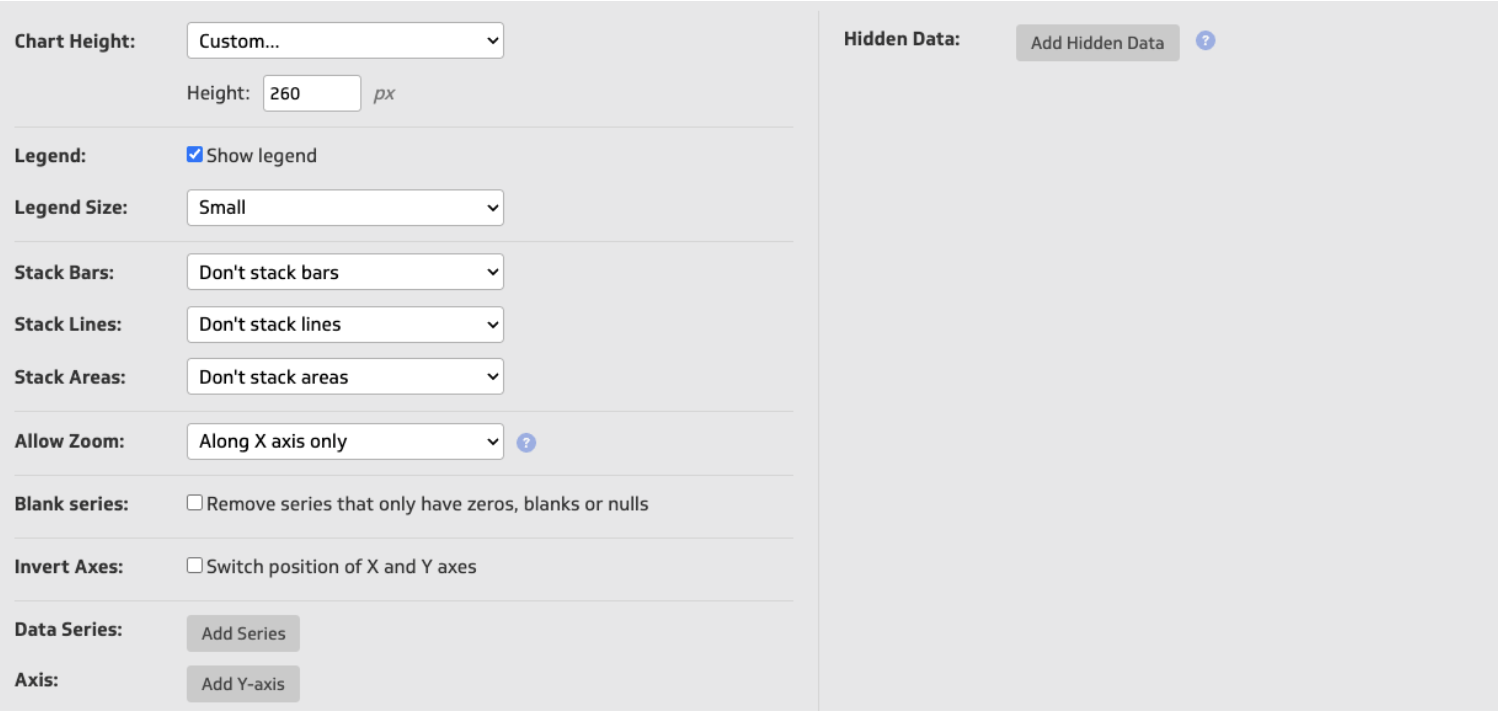
- Layout - Change the amount of columns, rows, title and its size, klip padding, animation, and more.
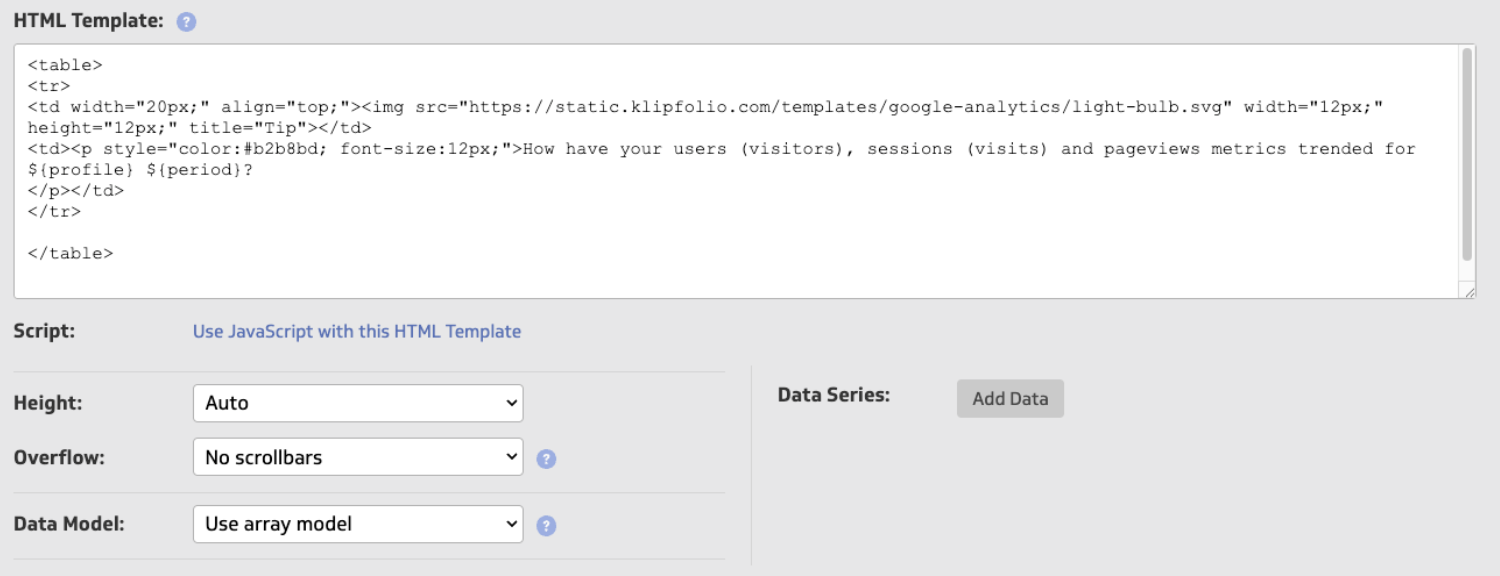
- HTML template: If you have the technical know-how, you can edit the HTML to customize the layout.
- Components - Choose between components like table, chart, gauge, value pair, layout grid, and image.
- Advanced tools - Alternatively, you can create and manage variables and access the source code.
Once you’ve created your Klips, you can add them to your dashboard.
You can customize a lot, but in Klipfolio’s case, it also comes with a steep learning curve.
Our impression was that navigating the Klips editor is complex, especially if you try to combine multiple data sources.
Many Klipfolio users reported that creating new dashboards would require a data scientist, which was also how we felt when creating custom Klips.
What are your sharing options?
Klipfolio offers a few ways to share dashboards:
- Via an email
- Creating an internal link
- Publishing link to dashboard
- Downloading a PDF/image of the dashboard
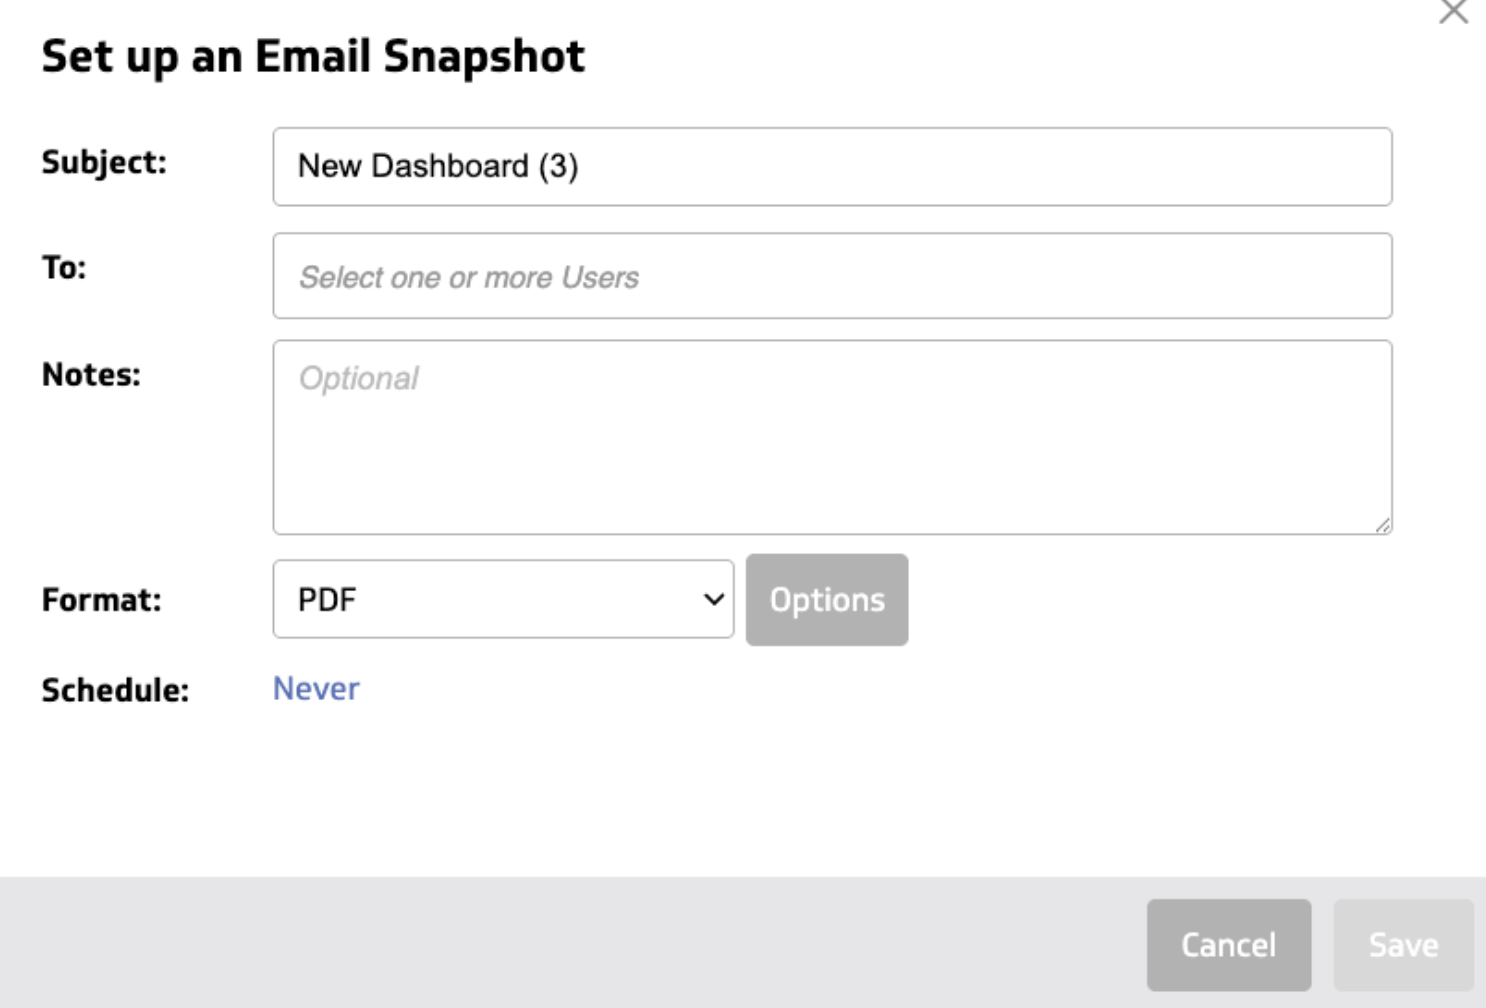
It’s also possible to set up an “Email Snapshot,” which schedules an email to be sent to one or multiple users.
These are the same sharing options most Klipfolio alternatives (including Whatagraph) offer.
Are there AI features for insights?
Klipfolio doesn’t offer AI features for insights.
This means you’ll need to manually explain campaign performance, which can be very time-consuming, especially if you do it for multiple clients.
Whatagraph (again) offers a solution to this through two innovative AI features:
- AI insights: Ask our AI Chatbot any questions about your connected data. For example, “Which campaign is performing the best?”
- AI summaries: Add a text widget to your reports and ask the AI to automatically write our summaries, wins, recommendations, or suggestions based on the data on that report. Don’t worry – you can fully edit this text too!
And the best part? All of our plans come with these AI features. You don’t need to pay extra for anything.
Klipfolio dashboards are very customizable, but the complex setup, clunky editing flow, and lack of AI features make the process time-consuming.
Feature Deep Dive #5: Klipfolio Security
How does Klipfolio approach security, and do they comply with industry standards?
The short answer is yes, but here are more details:
How do they approach data encryption?
Klipfolio secures all data in transit using TLS 1.2 with SHA-256 encryption. Sessions automatically expire after 30 minutes of inactivity or upon manual sign-out—helping to minimize unauthorized access risks.
Are they covering GDPR basics?
Yes, Klipfolio complies with GDPR and provides a Data Processing Addendum. They process customer data in accordance with EU data protection laws.
Are there role-based access controls?
Yes, you can create admin, editor, view-only, and custom roles. Multi-factor authentication is also available for all plans.
Klipfolio also mentions "maintaining a detailed event log, capturing items such as authentication, failed login attempts, asset creation, deletion, and modification."
What about single sign-on (SSO)?
SSO is used by enterprises for more secure user access and is available on the pricier Klipfolio plans.
Klipfolio covers GDBR basics, has a data encryption protocol, and role-based access controls—though single sign-on (SSO) requires pricier plans.
Feature Deep Dive #6: Klipfolio Customer Support
Klipfolio offers two ways to get help for most users: sending an email or finding answers in the knowledge base. Dedicated onboarding and priority support are available, but only for the most expensive plan—starting at $690/month.
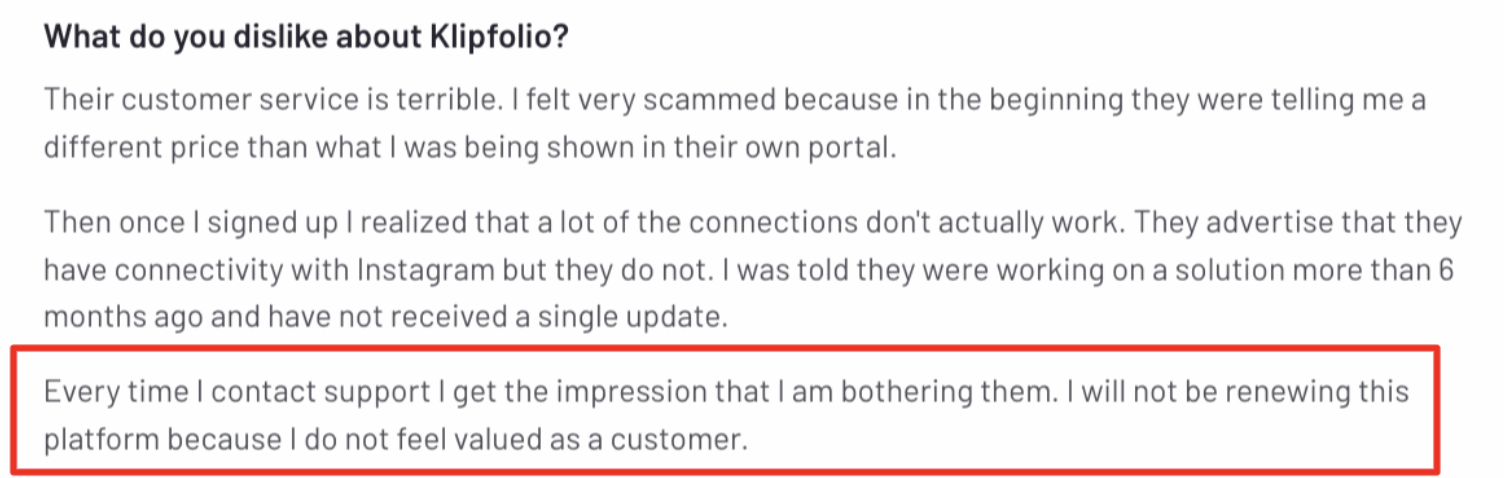
When we looked at user reviews on Klipfolio, we noticed many users were disappointed with the customer support.
One G2 user even said they felt like bothering the support when getting in contact:
With Whatagraph, users on all plans have access to:
✅ Live chat and email support with first response times of under 4 minutes
✅ A dedicated Customer Success Manager
Your CSM helps connect data sources, organize data, create reports, migrate data, and anything else you can think of.
And our customers love our dedication to their success. Kim Strickland, Digital Marketing Specialist at Peak Seven agency, says:
I've joked about this often—with Whatagraph, we're not paying for a reporting system. We're paying for customer support. There's a level of dedication from the Whatagraph team that you don't often experience anywhere else.
Read the full case study.
Klipfolio’s support is limited to email and self-service unless you’re on a $690/month plan. Users have felt that they are not valued by Klipfolio’s support team.
How does Whatagraph Compare Against Klipfolio?
Now that you have a better understanding of Klipfolio, let’s see how it stacks up against Whatagraph, one of the top Klipfolio alternatives.
What is Whatagraph?
Whatagraph is an all-in-one marketing data platform that makes it easy to collect, analyze, and report on your data—whether it’s social media, email, PPC, SEO performance, or more.
Here’s how Whatagraph solves many of the problems Klipfolio users face:
✅ Stable integrations and uptime of 99.95%
- The Klipfolio Problem: Users say many of the connections don't actually work, or the platform "hangs" when working with large volumes of data.
- The Whatagraph Solution: Our integrations are fully managed, and you can work with 100’s of widgets and 10+ sources without slowing down the platform. We also have an average uptime of 99.95%, which means your reports and dashboards are always available when you need them. If something goes wrong, our product engineers will be on real-time alert to fix system outages.
Our stable integrations make cross-channel reporting easy, as Bruhith I., digital marketing specialist put it:
Whatagraph pulls in data from Google Ads, Meta, LinkedIn, and even TikTok without any hassle. I love how I can set up automated reports that look great and are client-ready. No more fiddling with spreadsheets or wasting time building slides.
✅ Ease of use and setup
- The Klipfolio Problem: Klipfolio offers high flexibility but has a steep learning curve. Aside from the 17 templates, users need to build dashboards and widgets from scratch, connect each data source individually, and often recreate similar structures for each client or campaign.
- The Whatagraph Solution: Whatagraph is designed for speed and simplicity. You can choose from 55+ pre-made templates and add pre-built (and custom) widgets to your dashboards and reports—all from a single interface.
This verified user on G2 appreciated the ease of use and said:
Whatagraph is an extremely user-friendly reporting tool that helps us communicate the key aspects of our clients' digital marketing in practically real-time. It is quick to use, and building new reports is effortless.
✅ Data blending and integrations
- The Klipfolio Problem: Klipfolio supports a wide range of integrations and excels at combining business metrics. However, you’ll need to work with SQL queries and code to blend data, which is beyond most users' capabilities.
- The Whatagraph Solution: Whatagraph offers powerful (yet easy) data blending features. You can blend data from different platforms (e.g., Facebook Ads + Google Ads) into single widgets or unified metrics, all within a no-code environment. This not only makes your reports easy to read but also gives a better view of overall performance.
As one G2 user put it simply:
The ability to integrate multiple data sources and create customized reports quickly is a great advantage.
✅ Excellent customer support
- The Klipfolio Problem: The only way for most users to contact support is via email, and users felt like they were bothering the support team. Priority support is available, but only for the most expensive plan.
- The Whatagraph Solution: No matter which plan you have, you’ll have access to an email and live chat (with under 4-minute first response times) and a dedicated Customer Success Manager.
But don’t just take our word for it; see what this Brinda G. said on G2:
The customer support team is lightning fast. And I mean, whenever I've had an issue, I can expect to have a proper conversation from within my dashboard in real time in under 3 minutes of raising a ticket.
Want a full breakdown? Check out our guide on Klipfolio alternatives.
Final Verdict: When to use Klipfolio and When to Switch to Whatagraph
Klipfolio and Whatagraph are both data visualization tools, but ultimately serve different use cases.
Below is a breakdown of when we’d recommend teams to choose Klipfolio and when Whatagraph:
Choose Klipfolio if:
- You’re part of a team wanting to manage internal KPIs
- You can handle a more technical UI and setup process
- You need metric-centric analytics with advanced customization
- You need a dashboard builder with deep data source integrations
- You’re comfortable setting up custom formulas and visualizations manually
- You don’t need to automate large-scale client reporting workflows
Klipfolio is a business intelligence (BI) platform designed for teams that need customizable analytics and real-time dashboards. It has a steep learning curve, but can be suitable for teams with time (and expertise) to build advanced dashboards.
If you’re part of an agency and need a fast setup, automated reporting, full white-labeling, and easy cross-channel data blending, Whatagraph may be a better fit.
Choose Whatagraph if:
- You’re an agency owner juggling reporting for 10+ clients
- You want to use 50+ templates and widgets to speed up the reporting workflow
- You’re looking for a more intuitive UI with a shorter setup time
- You want white-labeling across all plans: logos, domains, colors, custom themes, etc.
- You want to blend data from multiple sources and create custom metrics easily
- You plan to export data to platforms like BigQuery or Looker Studio
- You want access to AI insights and summaries to explain campaign performance for clients
Get in touch with our team to get started.