
Challenges
The Need to Move Away from Frustrating Reporting Tools
Tanja Keglić, Performance Marketing Manager at Achtzehn Grad, had a lot on her plate.
She takes care of the entire performance lifecycle for her six long-term clients—from planning campaigns to optimizing performance.
But there was one part of her job that felt like pulling teeth every single time: reporting.
Before switching to Whatagraph, Achtzehn Grad cycled through Looker Studio, Supermetrics, and ReportGarden, each bringing its own set of limitations.
Looker Studio + Supermetrics: Slow and Unreliable
For a large automotive client with multiple data sources and platforms, Looker Studio struggled to handle large datasets. Reports took forever to load, making it frustrating to pull insights quickly.
“We wanted to see our data quickly, but Looker Studio took so long to load," Tanja shared.
Plus, to connect non-Google platforms, Tanja had to rely on a “middleman” – Supermetrics – but that only added more work.
“Looker Studio is fine if you’re only using Google data, but it gets tricky when you need to connect to other channels,” Tanja explained. “You have to pay extra for Supermetrics, and then there are all these connection issues.”
Supermetrics connectors frequently broke, sources failed to load properly, and Tanja had to either waste time fixing them herself or contact Support for help.
“It’s such a pain to reconnect a lot of sources and accounts—and it takes so much time, which you don’t have when you want a quick report,” Tanja stated.
ReportGarden: Limited and Static
Hoping for a smoother experience, Achtzehn Grad switched to ReportGarden—which solved the connection issues but came with its own limitations.
Building reports was frustratingly manual, and it took Tanja half a day to build one from scratch.
“To build a new report with lots of channels and data sources, it would take me half a day to have everything ready and make it visually appealing,” she explained.
Customization was another pain point. Achtzehn Grad liked minimalistic reports but ReportGarden’s templates were static and old-fashioned.
“The templates were super fixed and not really modern-looking. You couldn’t escape much out of them.”
ReportGarden was limited in data transformation features too. The only option was its basic ‘Calculated Metrics’ feature, but Tanja couldn’t blend multiple sources together or create custom metrics.
With all these issues combined, it was clear ReportGarden wasn’t what she was looking for.
“We needed a tool that could do dashboards, reports, and provide a clear overview of performance for Account Managers and clients who aren’t deep in data,” Tanja said.
And so, she continued her search.
We needed a tool that could do dashboards, reports, and provide a clear overview of performance for Account Managers and clients who aren’t deep in data.
Solution
Holistic Reporting Tool for Clients and Internal Teams
When the team decided to move away from ReportGarden, their goal was clear: onboard a holistic marketing reporting tool where they could:
- Integrate all their channels
- Include offline data if needed
- Merge data from different channels to have a holistic view of performance
- Build an internal monitoring dashboard with an overview of key metrics for all clients
Tanja first discovered Whatagraph through an outbound email which piqued her interest. Later on, she started comparing us with different reporting tools in terms of:
- Integrations
- Custom visuals
- Ease of use
- Stability
And the Achtzehn Grad team settled on Whatagraph among all the tools they were evaluating.
“We were comparing different tools and Whatagraph checked all the boxes, and we went straight to testing it,” she said.
Phase 1: Proof of Concept and Onboarding
During the proof of concept period, Whatagraph immediately stood out for its ease of use.
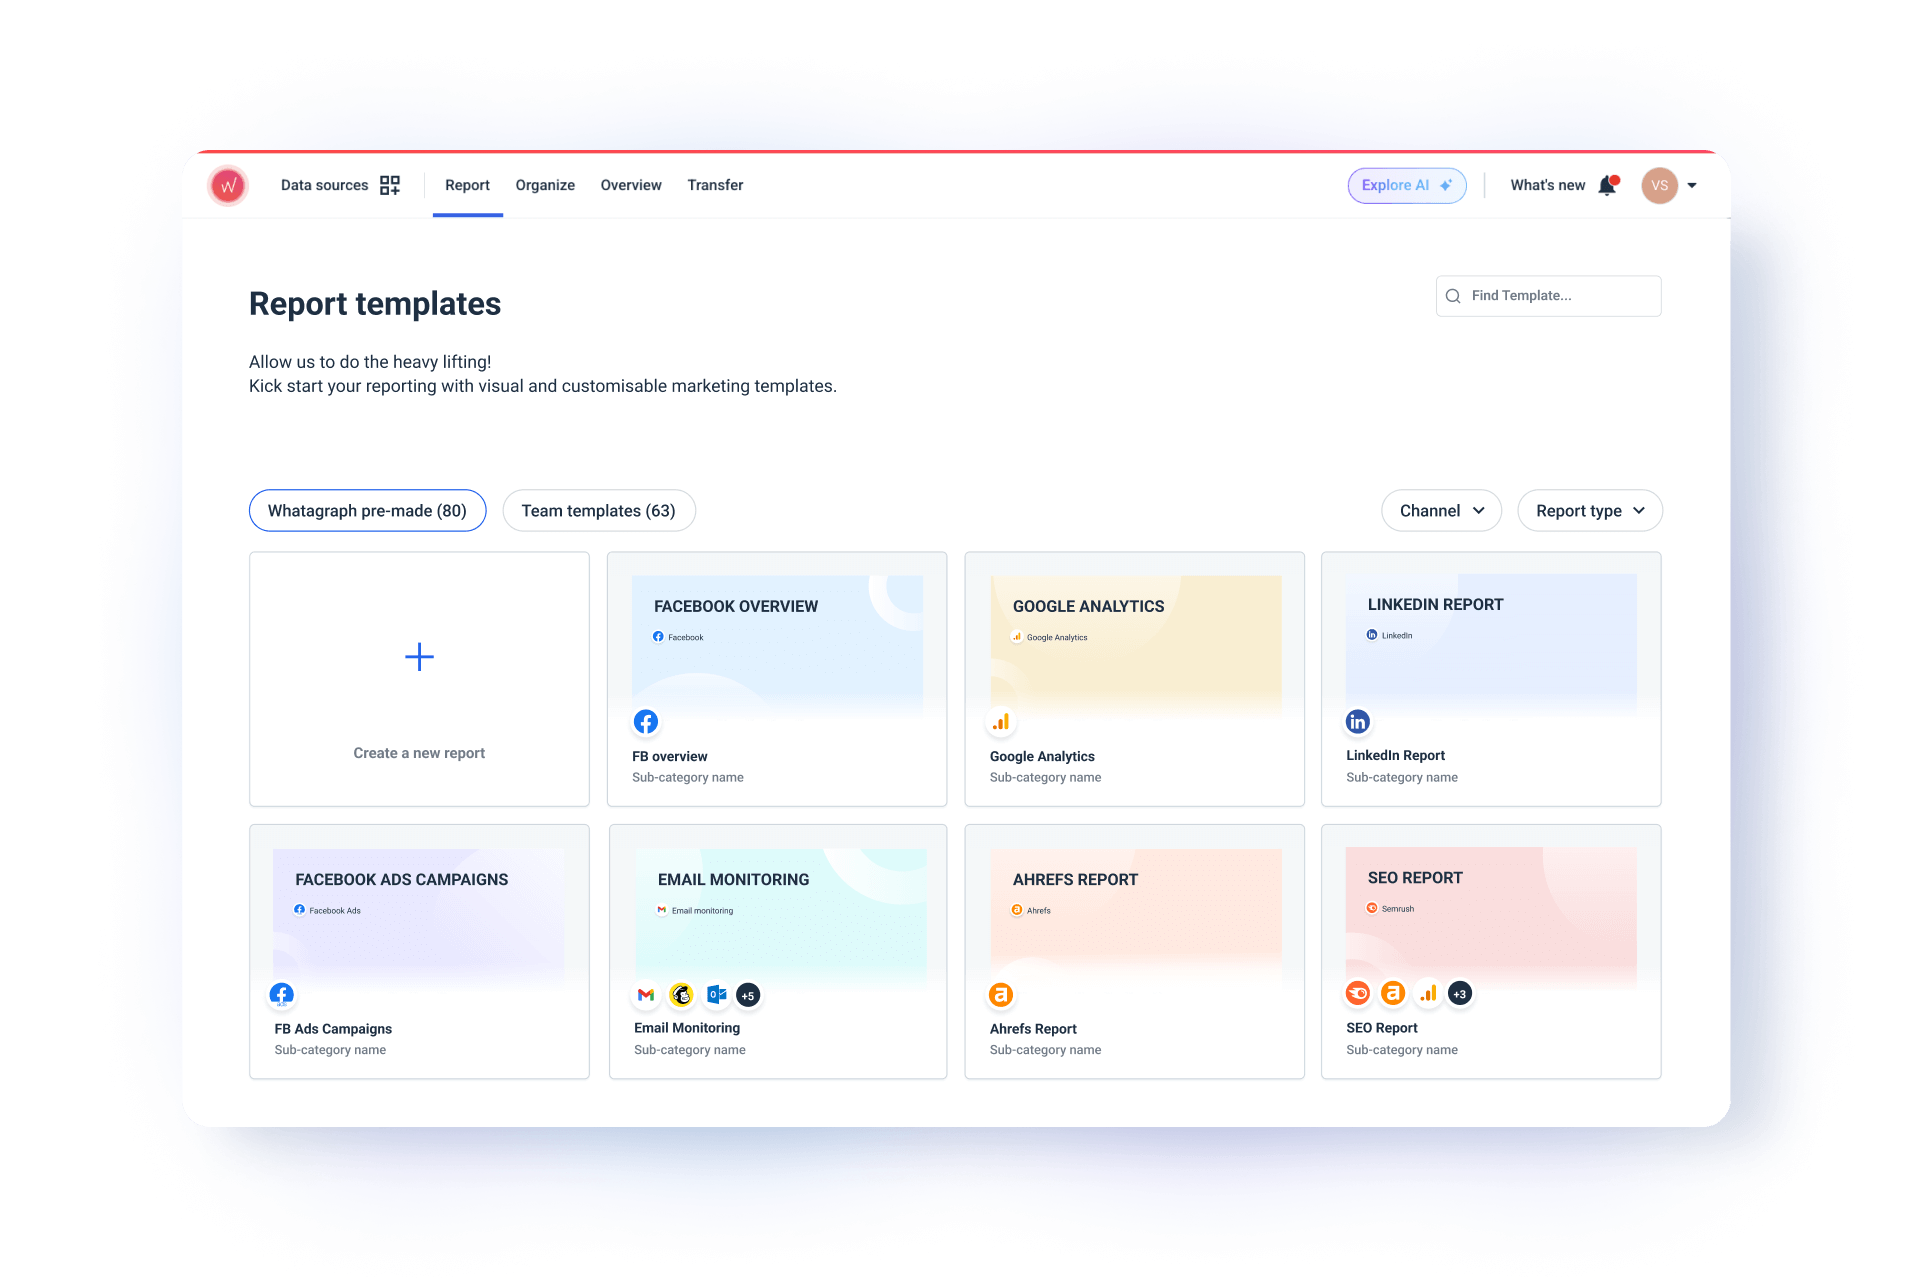
“My first impression was that Whatagraph was very intuitive and easy to use. I didn't really need much time to get into everything, and there were a lot of templates I could already use and play with,” Tanja told us.
Once the team was confident in going forward, the migration from ReportGarden took around two months, as Tanja started building all her reports on Whatagraph.
She first used the ready-made templates available on Whatagraph, which sped up the process.
 Once she was comfortable with the platform, she started building her own reports in the structure and style she wanted and saved them as her own templates.
Phase 2: Implementation
Now, whenever she needed to create a report for a new client, she would just duplicate one of the templates, switch out the data sources and make a few quick adjustments. This only takes her around 30 minutes.
“It’s very convenient to be able to duplicate everything and not lose any widgets or styles,” Tanja noted.
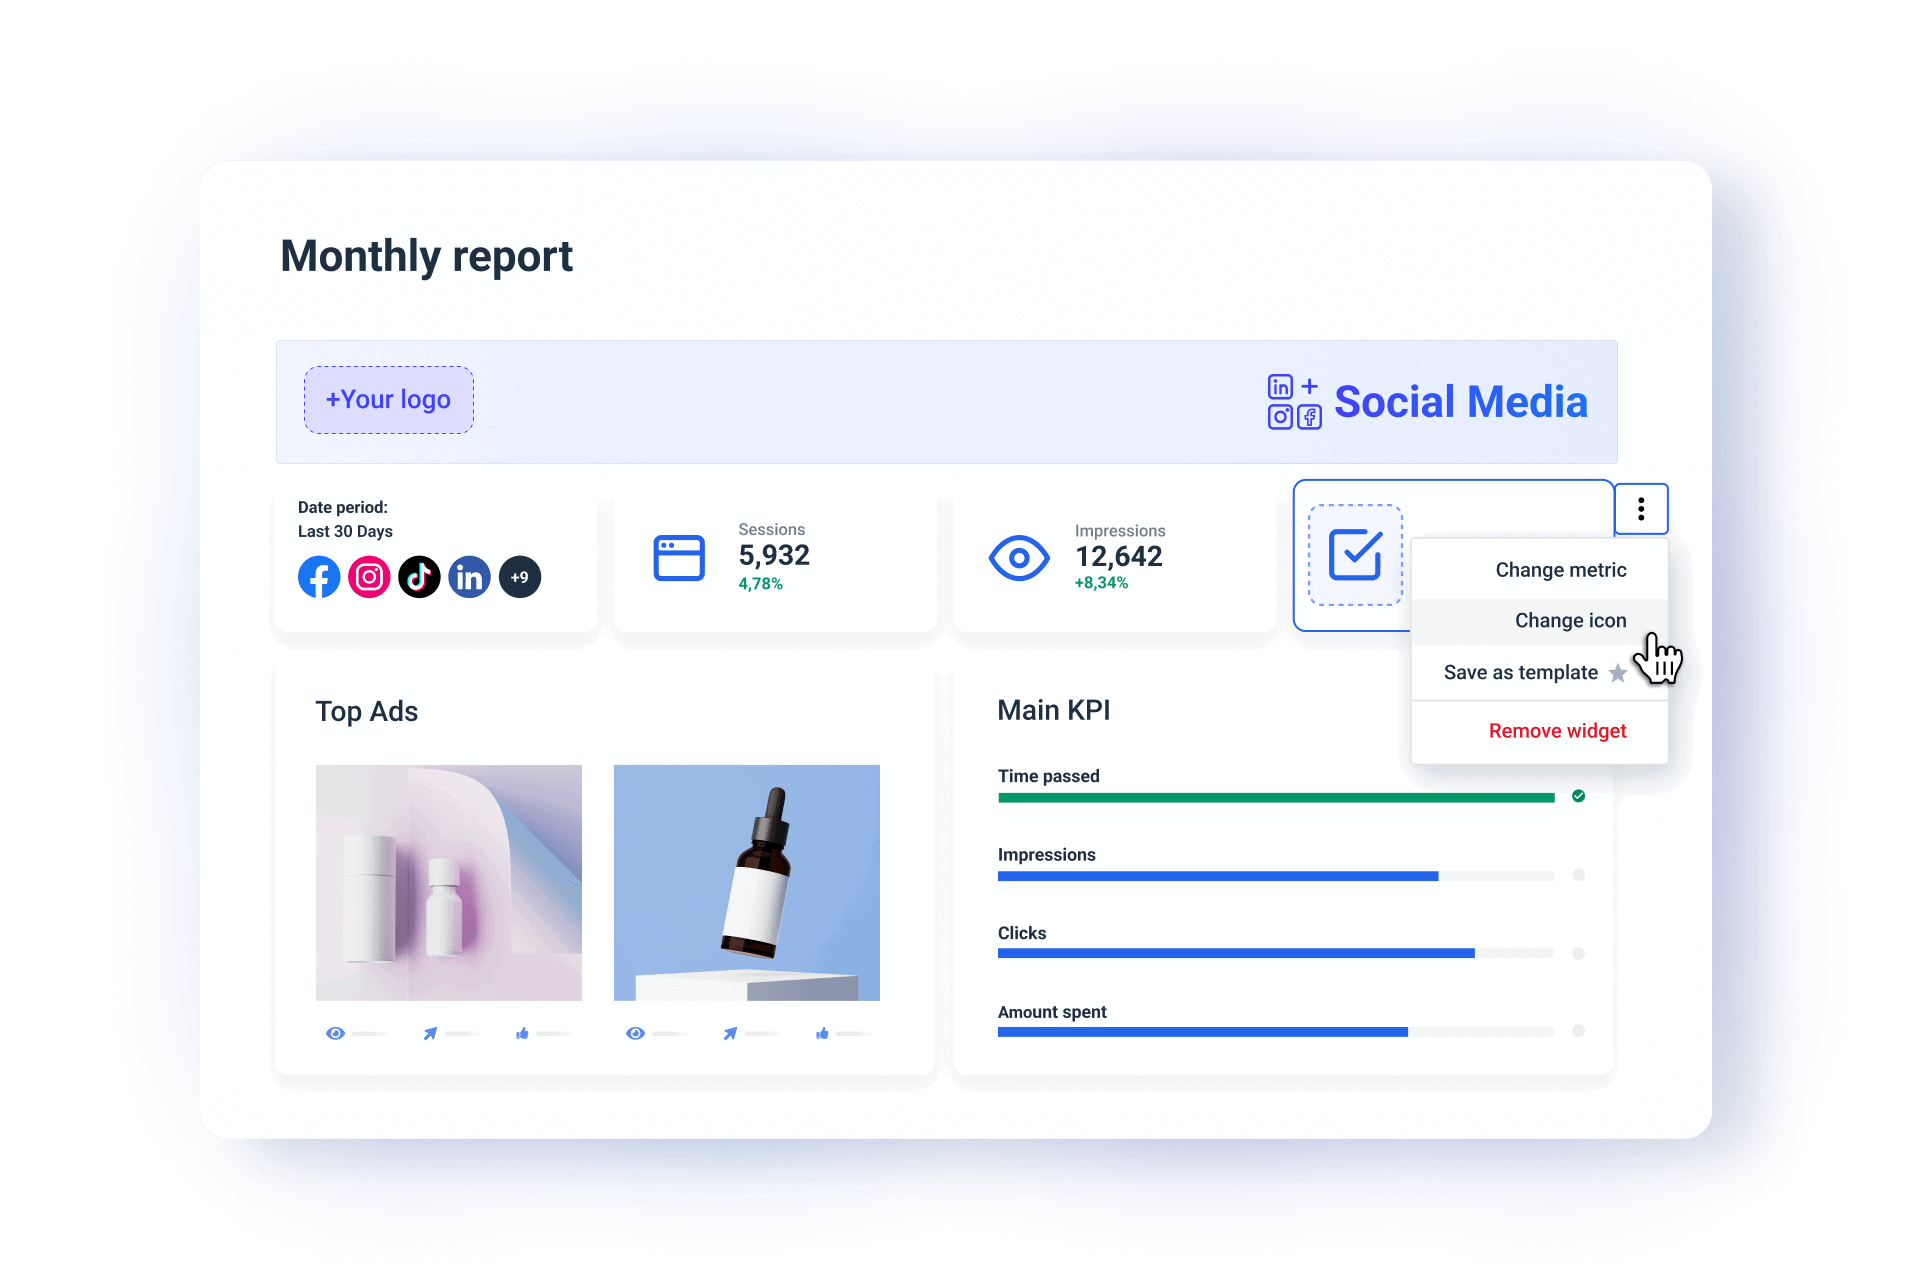
Instead of being locked into rigid templates on ReportGarden, Tanja could now fully brand reports with the agency’s and even their client’s colors, icons, and logos.
“Having the same colors with each report makes everything look very cohesive, and you’d know right away that it’s OUR report,” Tanja said.
Beyond just aesthetics, Tanja could also structure her reports any way she wanted on Whatagraph. She could resize widgets, select icons for widgets, and add custom images anywhere she wanted on the report.
“I love how I can change up everything on Whatagraph, and super quickly too,” Tanja added.
The only thing she likes to do manually now is to add section dividers with Achtzehn Grad’s custom image to further customize the reports.
An example of a section divider on Whatagraph
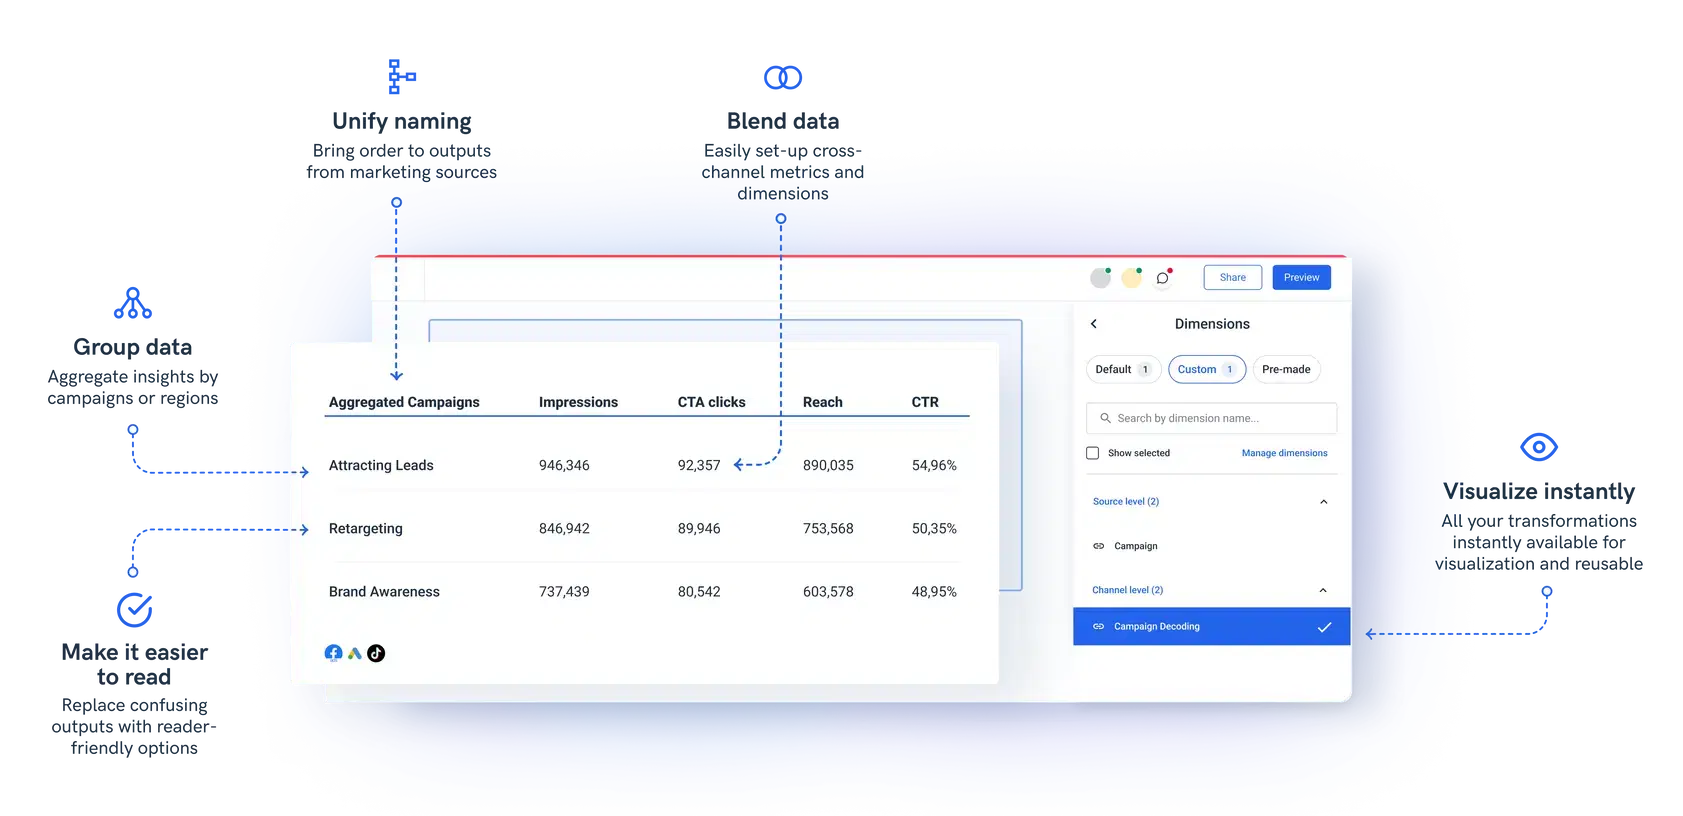
But what Tanja loves most about Whatagraph is our Organize feature, where she could:
- Combine metrics from multiple platforms for a single, holistic view of performance
- Standardize metric names, campaign names across all channels into one, clear format
- Calculate any new metrics she wanted based on client’s or agency’s needs
 This kind of granularity wasn’t possible on ReportGarden.
And while on Looker Studio, data blends are limited to 5 sources per blend, on Whatagraph there are no limits.
Tanja told us, “The biggest reason we chose Whatagraph was because of that holistic approach. We wanted to blend more sources together to see in one overview what's the performance and what we should change or adapt.”
Phase 3: Adoption
Today, Tanja and the Achtzehn Grad team uses Whatagraph as their single source of truth for reporting.
Whenever she’s on a call with clients, she uses the PDF report created on Whatagraph and goes through the numbers in real-time.
“It’s super easy to understand for the clients because the reports are nicely designed,” she said.
Internally, Tanja has built an Overview where the Account Managers can see the key results and trends for their clients.
“The overview is the easiest for our internal way of working. Our Account Managers don’t have to ask me for KPIs anymore—they just grab the link and send it to the client quickly without my help. It’s just quicker and easier.”
 Going forward, Tanja plans to dig deeper into our new Performance Monitoring features, like adding custom tags to data sources and combining similar data sources into unified Source Groups.
The biggest reason we chose Whatagraph was because of its holistic approach. We wanted to blend more sources together to see in one overview what's the performance and what we should change or adapt—and Whatagraph made this possible.
Results
Fast and Reliable Platform
The biggest win Achtzehn Grad saw with Whatagraph was stability and speed.
While with Looker Studio and Supermetrics, the connections were often broken and Tanja had to waste time manually fixing them, with Whatagraph, the connections are direct, seamless, and stable.
“We don’t have any connection issues on Whatagraph at all. We just connected the platforms once, and that was it,” Tanja raved.
This meant she could focus on campaign insights and strategy rather than waste time fixing issues.
Previously with Looker Studio, Tanja would have to wait a long period of time for reports to load, but with Whatagraph, she sees all her data and reports instantly.
“Whatagraph is very, very quick when loading the data. Even when I change a source in the report, it’s super quick and I barely ever have to wait,” Tanja emphasized.
Perfectly Customized Reports
Lack of customization was a major pain point with ReportGarden, and Whatagraph delivered on that front.
While with ReportGarden, Tanja was locked into rigid templates, with Whatagraph, she could fully white-label reports and structure them any way she wanted.
“I love that on Whatagraph, I really can build and edit whatever I want and however I want the structure to be,” Tanja beamed.
This level of customization wasn’t just about aesthetics—it made reports more structured, easier to read, and clearer for clients to understand.
“We have a lot of clients who don’t fully understand marketing, but when everything is visualized clearly on Whatagraph, it’s much easier for them to follow," she said.
5 Hours Saved Per New Report
Apart from stability, speed, and style, Whatagraph also saved Tanja massive time on reporting.
Reports that used to take half a day to build were now ready in 30 minutes.
“Duplicating and adjusting reports takes half an hour now. If I build one from scratch, maybe three hours—but most of the time, I don’t have to,” Tanja explained.
On live client calls, this was a game-changer. No more waiting for reports to load—Tanja could walk clients through real-time data, with zero lag.
And unlike past experiences where she had to log Support tickets on Supermetrics and wait, Whatagraph’s live chat and knowledge base were quick and effective.
“Support replies in five minutes, max. Even if they don’t have the answer right away, they get back to me quickly with one later on,” Tanja explained.
Tanja’s Recommendation
When asked if she would recommend Whatagraph, Tanja gave a great summary:
“I would definitely recommend Whatagraph. It’s super easy to use and intuitive even for people who are not Performance Managers. Anyone can quickly learn how to use it.
The customizable visuals are a huge plus, along with custom metrics and data blending.
Whatagraph saves time, looks great, and makes reports easy to understand for Account Managers and clients outside the marketing field.”
Achtzehn Grad finally had the reporting tool they had been searching for—one that saved them time, reduced frustration, and gave them the flexibility they needed.
Whatagraph saves time, looks great, and makes reports easy to understand for Account Managers and clients outside the marketing field.